I. INTRODUCTION
Since the development of rare-earth-doped semiconductors in 1980s, basic studies on the fabrication of practical light-emitting devices have been performed. Reference Pomrenke, Ennen and Haydl1–Reference Minissale, Vinh, de Boer, Bresler and Gregorkiewicz5 Although the narrow-band luminescence due to the inner-shell transition of rare-earth dopants is attractive in practical applications, the long-term conclusion of the basic studies over 30 years suggests that some breakthrough is necessary to produce practical devices. On the other hand, a light-emitting diode (LED) using a pn junction composed of bulk semiconductors has already realized intense emission, resulting in a device that has established status as a light fixture. In this paper, the key factors for fabricating intense light-emitting devices by using rare-earth dopants are discussed via a comparison between the emissions from rare-earth dopants and bulk-semiconductor pn junction.
The discussion is developed on the basis of time-resolved analyses because the issue is considered according to the dynamic properties of the rare-earth dopants rather than the static properties of the materials. In rare-earth-doped semiconductors, the rare-earth dopants are excited after a sequential process, i.e., trapping or confinement of the free charge carriers into some nanoscale sites, followed by recombination of electron–hole (e–h) pairs at the sites. Reference Taguchi, Takahei and Horikoshi6–Reference Taguchi and Takahei8 Considering that the recombination energy is finally used for the inner-shell excitation of the rare-earth dopants, the dynamics of the charge carriers in the preprocess are crucial for improving the luminescence efficiency. Once the recombination energy is propagated to the rare-earth dopants, the inner-shell excitation and radiative transition to the ground state is completed within a nanosecond. The preprocess is generally much slower than the inner-shell processes, as shown later, and thus is the limiting process for emission.
To discuss the dynamics of the charge carriers, conventional optical measurements such as photoluminescence (PL) are not suitable because the dynamics possibly include various nonradiative processes that are not detectable by optical measurements. On the other hand, electrical measurements are sensitive to the charges; thus, we applied them to the investigation of the dynamics. As well-known electrical measurements, capacitance–voltage (C–V) measurements and deep-level transition spectroscopy (DLTS) have been generally used to evaluate the static properties of semiconductors such as the energy levels and density of trap states. Reference Elsaesser, Yeo, Hengehold, Evans and Pedrotti9–Reference Mamor, Pipeleers, Auret and Vantomme11 However, we adopt the frequency-response analysis (FRA) to obtain the dynamic properties. In FRA, the response of an AC current, i.e., the behavior of the charge carriers, is analyzed with respect to the frequency ω of the applied AC electric field. Although FRA is a technique in the frequency domain, the obtained spectra can be converted to the time domain with a Fourier transform; the result is mathematically equivalent to the time response of the charge carriers.
Despite the equivalence between the frequency domain and the time domain, FRA has the advantage of fast measurement. The typical time-domain measurement is performed with a DC current in response to light pulse, and a DC current less than a microampere is detected using a picoammeter. Therefore, the time resolution is limited by the sampling rate of the picoammeter (on the order of kHz) and is not sufficient for this research. On the other hand, FRA in the high-frequency region can be realized with well-established microwave techniques; therefore, accurate spectra can be expected. The theory of the Fourier transform proved that the response time τ0 corresponds to 1/ω0, where ω0 is the response frequency expressed as an angular frequency. The conversion can be observed in the experimental results below. Although other advantages such as the analyzability of the hopping charges Reference Ishii, Towlson, Harako, Zhao, Komuro and Hamilton12 and the uniformity of the trapping level Reference Ishii, Crowe, Halsall, Knights, Gwilliam and Hamilton13 are also useful, we focused on time-resolved analyses in this study.
II. FRA OF A COMMERCIAL LED
Prior to the investigations of the rare-earth-doped semiconductors, we carried out a FRA of a typical commercial LED (resin-mold GaN with blue emission at λ = 470 nm, maximum forward current I Fmax = 50 mA, intensity at I Fmax = 12 cd). The FRA of the LED exhibits a model of the dynamics of the charge carriers in intense light-emitting devices. The model is useful for material and device designs of rare-earth-doped semiconductors.
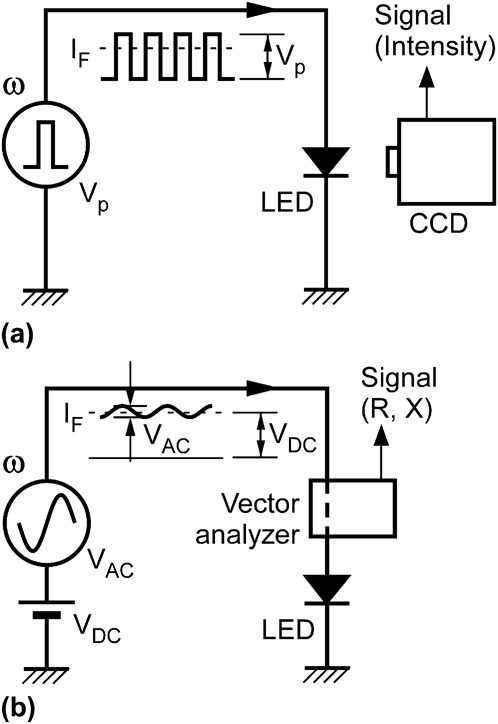
We performed optical and electrical FRAs of the LED by using the setups schematically shown in Figs. 1(a) and 1(b). The forward current I F is used as a common parameter for comparison between the spectra of these FRAs.
Setups for (a) optical FRA and (b) electrical FRA of a commercial LED.

For the optical FRA [Fig. 1(a)], the LED was operated with a pulse generator, and the emission intensity with respect to the pulse frequency ω was measured. The duty ratio was fixed at 0.5. Because the emission intensity was measured with a charge-coupled device (CCD) camera with a low frame rate of 30 fps (Toshiba, IK-629, Minato-ku, Tokyo, Japan), the high-ω operation >1 krad/s at the pulse current I P can be considered as continuous operation at the effective current I F = I P/20.5. I F was adjusted as the common parameter by the pulse voltage V P corresponding to the forward bias of the LED.
For the electrical FRA [Fig. 1(b)], an AC voltage V AC was applied to the LED, and an AC response current with respect to the AC frequency ω was detected. To perform a FRA of the LED in operation, a forward DC voltage V DC was also applied. V AC was fixed at a sufficiently small peak-to-peak value of 50 mV such that I F can be approximately determined by V DC. Because the probed AC response current generally has a different phase from the applied V AC, the response can be expressed with a complex number. The real part R and imaginary part X of the complex number were detected with a vector analyzer (Wayne Kerr, 6440B, Wayne Kerr Electronics, Bognor Regis, West Sussex, UK).
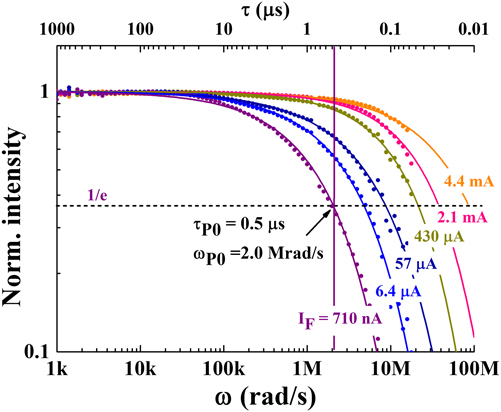
Figure 2 shows the spectra of the optical FRA obtained with the setup in Fig. 1(a). In these experiments, I F was varied from 710 nA to 4.4 mA. As shown in this figure, the normalized emission intensity of the LED decays in the high-ω region for all values of I F. The decay was reduced as I F increased. The reduction is a result of the faster e–h recombination in the thinner depletion layer of the LED.
Spectra of the optical FRA obtained with the setup in Fig. 1(a).

The decay curves can be characterized by the cutoff frequency ωP0, which is defined as the value of ω at which the normalized intensity decays to 1/e. The inverse of ωP0, 1/ωP0, corresponds to the time constant of the e–h recombination, τP0. For example, ωP0 and τP0 at I F = 710 nA were estimated to be 2.0 Mrad/s and 0.5 μs, respectively.
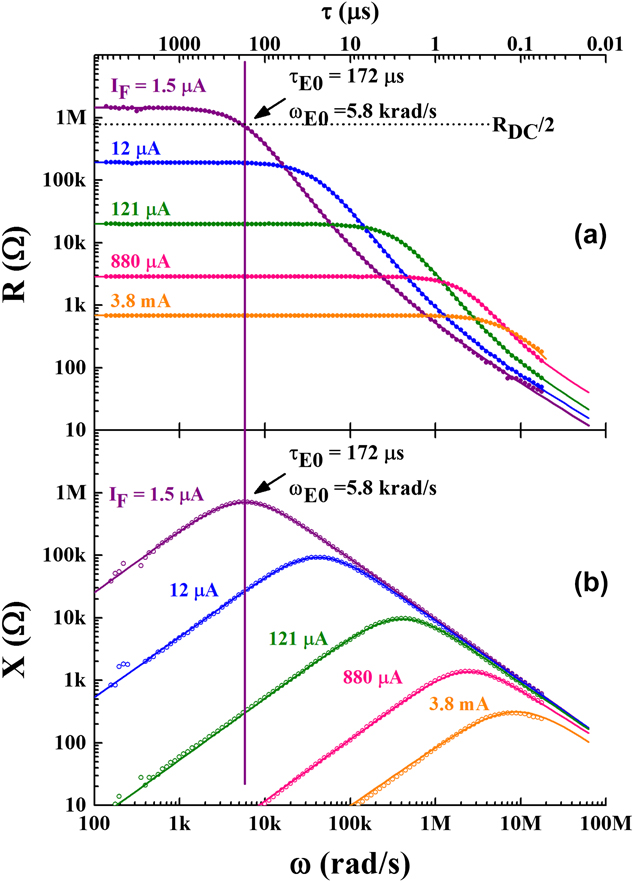
Figure 3 shows the spectra of the electrical FRA obtained by using the setup in Fig. 1(b). The electrical measurement provides the dynamics of the charge carriers in the pn junction of the LED. Because the AC response current is normalized by V AC, the vertical axes are plotted in units of ohms. R [Fig. 3(a)] and X [Fig. 3(b)] are different expressions of a response; therefore, an electrical response time constant τE0 can be evaluated from each spectrum. For Fig. 3(a), ωE0 = 1/τE0 is equal to ω, which results in R = R DC/2, where R DC is R at lower limit of ω. On the other hand, ωE0 can be identified as ω in Fig. 3(b), which is the peak of X. For example, I F = 1.5 μA results in ωE0 = 5.8 krad/s and τE0 = 172 μs.
Spectra of the electrical FRA obtained by using the setup in Fig. 1(b). Figures 3(a) and 3(b) are expressed with real part R and imaginary part X of the responses, respectively.

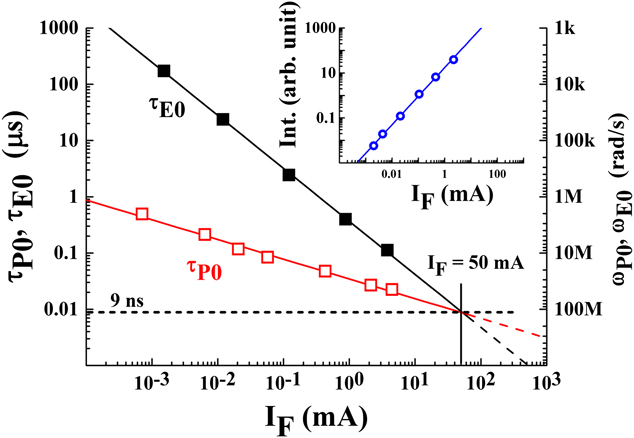
From Figs. 2 and 3, τP0 and τE0 with respect to I F are summarized in Fig. 4. In Fig. 4, τP0 and τE0 are denoted by the open squares and closed squares, respectively. As shown in the inset of this figure, the emission intensity of the LED is proportional to I F; therefore, it can be understood that τP0 and τE0 are inversely proportional to the intensity. This result means that the faster e–h recombination (smaller τP0 or τE0) results in more intense light emission.

For the electrical FRA, the nonradiative process in the LED can be identified as follows: The electrical responses in Fig. 3 can be formulated Reference Han, Senos, Mantas and Cao14 with
 $$R + jX = \left( {{1 \over {R_{\rm{p}} }} + j\omega C_{\rm{p}} } \right)^{ - 1} \quad {\rm{.}}$$
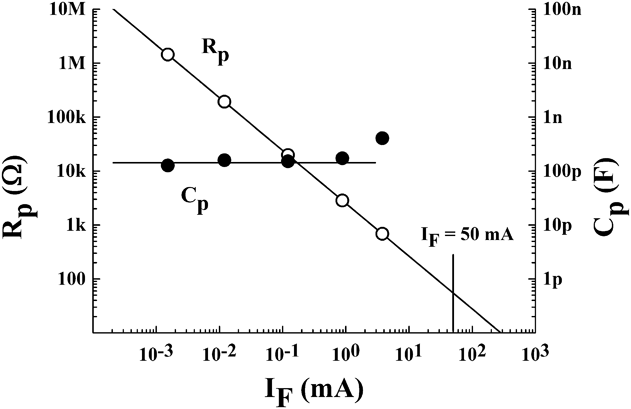
This equation indicates that the depletion layer of a pn junction is equivalently expressed as a parallel connection of a resistance R p and a capacitance C p. R p and C p can be identified by fitting the spectra in Fig. 3 and are summarized in Fig. 5. From this figure and the relation
 $$\tau _{{\rm{E0}}} = R_{\rm{p}} C_{\rm{p}} \quad {\rm{.}}$$
R p and C p evaluated from Fig. 3.

τE0 is understood to be mainly determined by R p rather than C p. Because R p physically represents the thermal loss of the charge carriers injected into the LED, Figs. 4 and 5 indicate significant thermal loss in the low-I F region. Consequently, it can be concluded that the large value of τP0 in the low-I F region in Fig. 2 is caused by the significant thermal loss of the charge carriers instead of the e–h recombination for emission.
Note that the extrapolation of τP0 and τE0 in Fig. 4 predicts that τP0 = τE0 at I F = 50 mA and τP0 > τE0 above this value of I F. However, τP0 cannot be determined for I F > 50 mA because the faster thermal loss extinguishes the emission light. In this high-I F region, the charge carriers pass through and short the pn junction, resulting in heat rather than light. Because the heat load finally causes breakdown of the LED, τP0 = τE0 determines the maximum value of I F, i.e., I Fmax. In actual operation at I F near I Fmax, the emission intensity of the LED is not proportional to I F owing to the heat load. Therefore, the linear extrapolation of τP0 and τE0 in Fig. 4 cannot be traced experimentally. By ignoring this practical fact, the optimal time constant for the maximum intensity can be determined as ∼9 ns corresponding to τP0 = τE0 in this figure.
From the discussions in this section, it can be understood that (i) the electrical FRA can characterize nonradiative processes, (ii) a larger value of τE0 indicates a larger loss in the number of injected charge carriers, and (iii) the highest intensity can be obtained at τE0 ∼ τP0, which is on the order of a nanosecond. In particular, (iii) indicates a target value for the realization of practical emission devices.
III. ELECTRICAL FRA OF RARE-EARTH-DOPED SEMICONDUCTORS
A. Sample preparation and optical properties
The samples of rare-earth-doped semiconductors for the electrical FRA measurements are thin films that have no device structure. The electrical response of the thin films was detected with a parallel electrode. The front electrode was a transparent electrode consisting of indium tin oxide (ITO) evaporated onto the sample, and the rear electrode was a conductive substrate under the sample film. Excitation light was incident upon the sample through the ITO electrode and generated e–h pairs around the optically active centers. The e–h pairs can interact with the centers; therefore, the electrical FRA of the centers can be measured without using device structures. Reference Ishii, Harako, Zhao, Komuro and Hamilton15
The rare-earth dopant used in this study was Er, which has emission lines at the wavelength λ ∼1.54 μm. The infrared (IR) luminescence due to the intra-4f-shell optical transition 4 I 13/2 → 4 I 15/2 of Er can propagate in a silica-based optical fiber with minimal transmission loss. Because of this attractive property for industrial applications, the Er dopant has long been studied. Si nanocrystals (Si-ncs) and GaAs were used as the host semiconductors. The details of the fabrication process were presented in Refs. 16–18; thus, the process is briefly introduced in the following text.
The Er-doped Si-nc (denoted by Si-nc:Er in the following discussions) was fabricated by an ion-implantation technique. Reference Crowe, Kashtiban, Sherliker, Bangert, Halsall, Knights and Gwilliam16,Reference Crowe, Halsall, Hulko, Knights, Gwilliam, Wojdak and Kenyon17 Er and Si ions were co-implanted into a 700 nm thick Si thermal oxide film on p+ Si wafer (2–5 Ω cm). The implantation energy and density of the Si ions were 80 keV and 8 × 1016 cm−2, respectively, and those of the Er ions were 300 keV and 3 × 1015 cm−2. For Si-nc formation, the implanted sample was thermally annealed at 1100 °C in a N2 atmosphere for one hour. The Si-nc surface is terminated by H using a subsequent thermal treatment at 500 °C in a 5% H2-diluted N2 atmosphere. Reference Uren, Stathis and Cartier19 A circular ITO electrode of 5 mm diameter was deposited on the sample with a magnetron sputtering technique.
The Er-doped GaAs (GaAs:Er,O) sample was grown on Si-doped GaAs (001) substrates (1.8–2.0 × 10⁻³ Ω cm) with a low-pressure organometallic vapor-phase epitaxy (OMVPE) technique. Reference Fujiwara, Furuta, Makita, Ito, Nonogaki and Takeda18 Triethylgallium (TEGa) and tertiarybutylarsine (TBAs) were used as the Ga and As precursors, respectively. The Er doping was carried out with tris(isopropyl-cyclopentadienyl)erbium [(i-PrCp)3Er] as an organometallic Er precursor. Argon gas with 38.4 ppm of 18O2 was supplied to the growth chamber at an oxygen content of 0.2 ppm. Reference Koizumi, Fujiwara, Inoue, Urakami, Yoshikane and Takeda20 The GaAs:Er,O sample grown under these conditions is a single crystal, and the codoped O atoms are known to form a single optical center with the Er dopants, Er-2O in the GaAs host. Reference Takahei and Taguchi21,Reference Hogg, Takahei, Taguchi and Horikoshi22 The front ITO electrode used for this sample was 2 mm × 2 mm square.
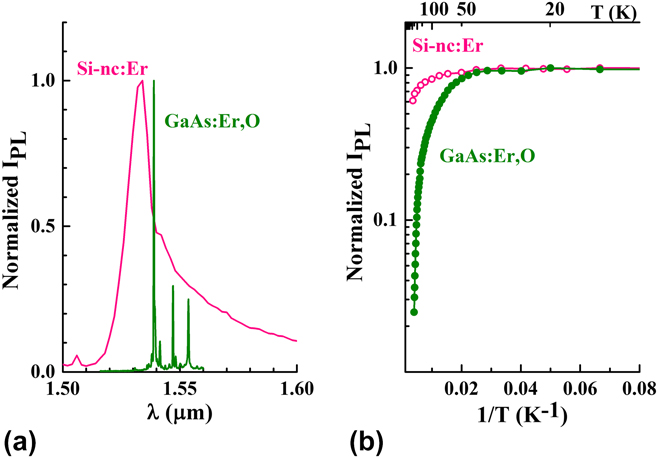
For the Si-nc:Er and GaAs:Er,O samples, the typical PL spectra of the IR emission around λ ∼1.54 μm are shown in Fig. 6(a). The measurement temperature was 10 K. From the comparison between these spectra, sharper emission lines caused by the splitting of the Er 4f states can be observed for GaAs:Er,O, indicating the higher structural uniformity of the optical center. On the other hand, a broader spectrum is obtained for Si-nc:Er, which may be caused by the Er dopants that can occupy various sites in the structurally distributed Si-ncs. Figure 6(b) shows the PL intensity of Si-nc:Er and GaAs:Er,O with respect to 1/T, where T is temperature of the sample. Although Fig. 6(a) shows the promising properties of GaAs:Er,O as a narrow-band communication device, Fig. 6(b) indicates that the thermal quenching of Si-nc:Er is smaller than that of GaAs:Er,O. The result in Fig. 6(b) shows that the energy loss of Si-nc:Er is smaller than that of GaAs:Er,O at room temperature, and Si-nc:Er is more favorable for room-temperature operations.
(a) PL spectra of Si-nc:Er and GaAs:Er,O around λ ∼1.54 μm and (b) PL intensity with respect to 1/T.

In following sections, the time constant and energy losses of nonradiative processes involved in these materials are investigated with the electrical FRA to quantify the competitive properties of Fig. 6.
B. Electrical FRA of Si-nc:Er Reference Ishii, Crowe, Halsall, Knights, Gwilliam and Hamilton23
The electrical FRA spectra of Si-nc:Er were measured with a vector impedance analyzer (Hewlett Packard, 4192A, Santa Clara, CA). The light source used in this study was a He–Cd laser with a wavelength λ = 442 nm (Kimmon Koha, IK5552R-F, 100 mW, Itabashi, Tokyo, Japan).
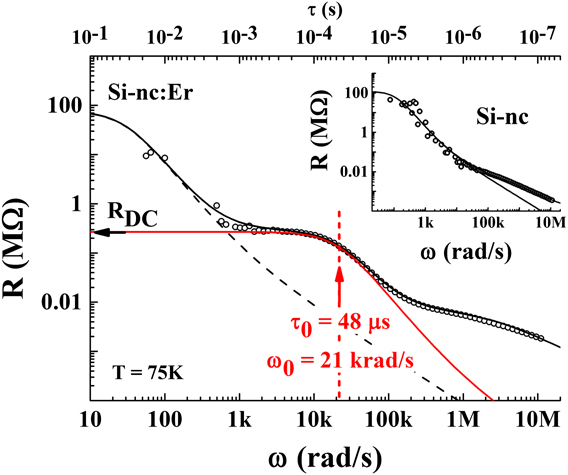
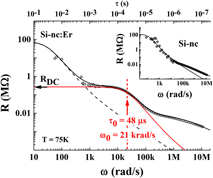
Figure 7 shows a typical spectrum of the electrical FRA of Si-nc:Er, which is plotted with respect to R, similar to Fig. 3(a). Reference Ishii, Crowe, Halsall, Knights, Gwilliam and Hamilton23 The sample temperature T for this experiment was set at 75 K. The inset of this figure shows a reference response spectrum of Si-nc without Er doping. By comparing the spectra of Si-nc with and without Er, it can be understood that the Er doping provides a new response at τ0 = 48 μs (ω0 = 21 krad/s). The other responses in the lower- and higher-ω regions, which also can be observed in the inset, are attributed to the responses of SiO2 and Si-nc unrelated to Er, respectively. In this review, only the response related to the Er dopants, which can be deconvoluted with Eq. (1), is discussed. Note that Eq. (1) was used for analyses of nonradiative processes in a pn junction of bulk semiconductors. The deconvolution in Fig. 7 indicates the ability of the electrical FRA as a selective analysis of the Er dopants. Er dopants may form an energy level Reference Elsaesser, Yeo, Hengehold, Evans and Pedrotti9,Reference Song, Chen, Zhang, Bian, Hsu, Lu, Zhang and Zhu10 that determines the luminescence property, and τ0 indicates the time constant of charge trapping at the energy level. In fact, the trapping process can be formalized with the Debye relaxation Reference Barsoukov and Macdonald24 which is mathematically equal to Eq. (1).
Typical spectrum of the electrical FRA of Si-nc:Er. The inset shows the reference spectrum of Si-nc without Er dopants. Reference Ishii, Crowe, Halsall, Knights, Gwilliam and Hamilton23 Copyright (2014) The Japan Society of Applied Physics.

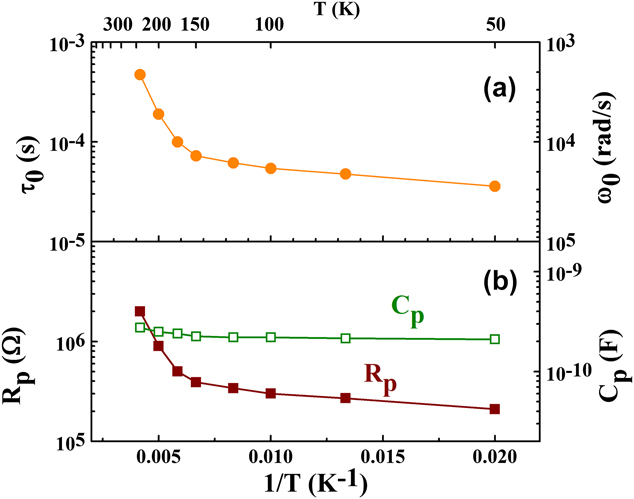
As shown in Fig. 8(a), τ0 determined from Fig. 7 depends on T. Although τ0 is well correlated with the thermal quenching of PL from the Er dopants, as shown in Fig. 6(b) and Ref. Reference Ishii, Crowe, Halsall, Knights, Gwilliam and Hamilton23 it is observed that the lowest value of τ0 = 36 μs in this temperature range in Fig. 8(a) is much higher than the response time constant of Si-nc of ∼3.7 μs in a previous study Reference Ishii, Crowe, Halsall, Knights, Gwilliam and Hamilton13 and τE0 ∼ 9 ns, which provides the maximum intensity from the commercial LED in Fig. 4. This finding indicates the low transmission efficiency of the e–h recombination energy from Si-nc to Er in this sample; this situation is similar to the condition of I F << I Fmax in Fig. 4, in which the loss of the injected charges were represented with τE0 >> τP0.
(a) τ0 and (b) R p and C p of Si-nc:Er with respect to T. These values are evaluated from the typical response spectra in Fig. 7.

Besides the low-energy transmission efficiency, the thermal quenching at room temperature suggests another loss process dependent on T in Si-nc:Er. To identify the dominant energy-loss process in the thermal quenching of this material, R p and C p are evaluated from the response spectra of the Er dopants. The evaluation is similar to Fig. 5 for the LED. The evaluated values of R p and C p for Si-nc:Er are plotted with respect to 1/T in Fig. 8(b). As shown in the figure, R p increases as T increases, whereas C p is almost constant in this temperature range, indicating that τ0 is primarily determined by R p. Figure 6(b) revealed that the thermal quenching of Si-nc:Er is smaller than that of GaAs:Er,O, whereas Si-nc:Er still has a nonradiative process accompanied by the thermal loss.
From these results, (i) the improvement in the energetic coupling between Si-nc and Er and (ii) the reduction in the nonradiative process that releases the confined charges from Si-nc are necessary to enhance the emission of Si-nc:Er. For (i), a selective formation of an optical center appropriate for coupling is effective, considering that Si-nc:Er has various optical centers for Er, as discussed in Fig. 6(a). The selective formation is also useful for the narrow-band emission demonstrated in Fig. 6(a). For (ii), a possible loss process, i.e., nonradiative e–h recombination via trapping and interface levels was proposed in a previous paper. Reference Ishii, Crowe, Halsall, Knights, Gwilliam and Hamilton23 The trapping level is higher than the quantum-well level of Si-nc, so only thermally excited charges are trapped in the level. The energy barrier height for the thermal excitation was estimated to be ∼55 meV. Reference Ishii, Crowe, Halsall, Knights, Gwilliam and Hamilton23 The trapping level represents a relaxation path for the nonradiative recombination and reduces the luminescence intensity by consuming the confined charges in Si-ncs. Although an additional surface treatment for the Si-nc surface would be useful for (ii), a considerable improvement in the emission intensity can be expected by (i) rather than by (ii).
C. Electrical FRA of GaAs:Er,O
The electrical FRA of GaAs:Er,O was measured with a vector impedance analyzer (Wayne Kerr, 6440B). As an excitation light source, a red LED (λ = 625 nm, 1 W) operating in constant-current mode (350 mA) was used.
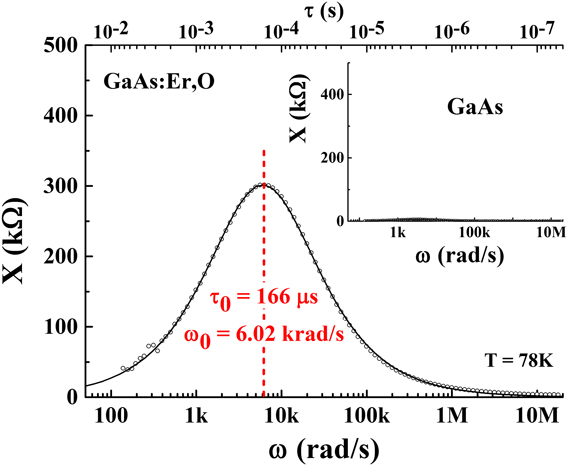
Figure 9 shows a typical FRA spectrum of GaAs:Er,O, which is represented by the imaginary part X, similar to Fig. 3(b). The sample temperature T for this experiment was set at 78 K, which is almost the same for the spectrum for Si-nc:Er in Fig. 7. As shown by the inset of Fig. 9, a reference sample of GaAs without dopants has no response in this frequency region, indicating that the photoexcited charges due to the band-to-band excitation of GaAs can rapidly propagate in GaAs. From the comparison between GaAs with and without Er and O, it can be concluded that the response in Fig. 9 originates from the Er and O dopants. These dopants can form an energy level as well as Si-nc:Er, and τ0 indicates the time constant of charge trapping at the energy level. As denoted in this figure, τ0 of GaAs:Er,O at 78 K is estimated to be 166 μs (ω0 = 6.02 krad/s), which is 3.5 times higher than that of Si-nc:Er in Fig. 7.
Typical electrical FRA of GaAs:Er,O. The inset shows that GaAs without Er dopants has no response in the frequency range.

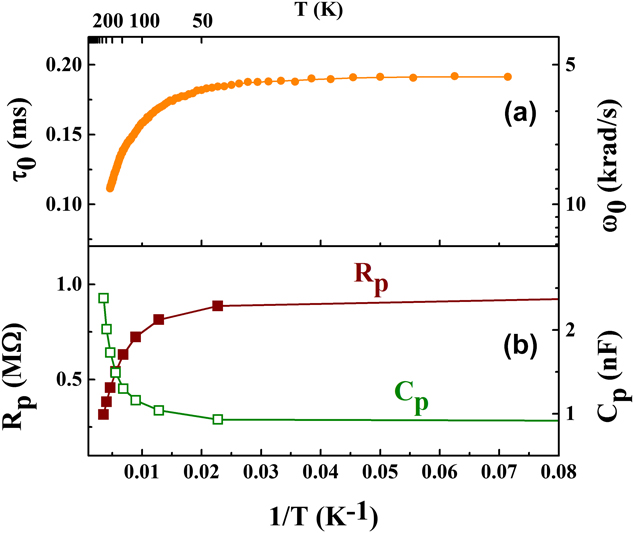
As shown in Fig. 10(a), the value of τ0 determined from Fig. 9 depends on T, and it is well correlated with the thermal quenching of the PL in Fig. 6(b). Reference Ishii, Koizumi, Takeda and Fujiwara25 In GaAs:Er,O, the trapping of the injected charge carriers into the trapping centers in the GaAs host followed by a recombination at the centers excites the Er dopants. It was understood that the response in Fig. 9 indicates a trapping process, and τ0 limits the recombination. Reference Ishii, Koizumi, Takeda and Fujiwara25 Note that τ0 of the process is higher than τE0 ∼ 9 ns, which provides the maximum intensity from the commercial LED in Fig. 4.
(a) τ0 and (b) R p and C p of GaAs:Er,O with respect to T. These values are evaluated from the typical response spectra in Fig. 9.

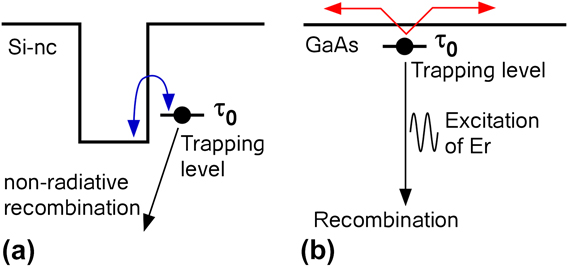
To identify the process that determines the thermal quenching property of GaAs:Er,O, R p and C p are evaluated from the response spectra in Fig. 9. The evaluated values are summarized with respect to 1/T in Fig. 10(b). As shown in the figure, R p decreases as T increases. The decrease in R p in the high-T region >50 K in Fig. 10(b) corresponds to a higher conductivity, meaning thermal excitation of the charges from the trapping centers. Note that the thermal excitation of the trapping centers in GaAs:Er,O is easier than that in Si-nc surrounded by SiO2 with a wide energy gap of ∼9 eV. Obviously, the thermally excited charges cannot contribute to light emission. Figure 11 is the difference of the thermal excitation process between (a) Si-nc:Er and (b) GaAs:Er,O. As discussed in Fig. 8(b), R p increased with increasing T, and it was concluded that the trapping level was “higher” than the quantum-well level of Si-nc. On the other hand, the trapping level in GaAs:Er,O should be “lower” than the conduction band of GaAs. The difference results in the opposite behavior of R p in high-T region as shown in Fig. 10(b). Figure 10(b) also shows increase in C p in the high-T region, which indicates capacitive loss. The capacitive loss can be considered to be the result of hopping conduction, and the mobile charges also diminish the light-emission intensity. Consequently, the loss of both the thermal excitation and hopping conduction cause the thermal quenching to be more remarkable than in Si-nc:Er.
Difference of the thermal excitation process between Si-nc:Er and GaAs:Er,O. (a) Er doping forms a “higher” trapping level in Si-nc:Er, while (b) forms a “lower” trapping level in GaAs:Er,O.

Although the lower value of R p is an origin of significant thermal quenching, it is not a fatal disadvantage because optoelectronic devices require high electrical conductivity for current injection. Therefore, to realize a lower τ0 in GaAs:Er,O, trapping centers with a higher density and/or larger capture cross-sections are required. The ideal τ0 should be close to τE0 ∼ 9 ns to fabricate practical emission devices.
IV. CONCLUSION
By using electrical FRA, the behavior of the charge carriers in Er-doped Si nanocrystals and GaAs with Er and O codopants is investigated. At this stage, the luminescence intensity of the Er-doped semiconductors is limited by the charge dynamics having a large time constant greater than a microsecond. The time constant is much higher than ∼9 ns, which has already been achieved with a pn junction consisting of bulk semiconductors in a commercial LED. To fabricate practical light-emission devices with a low response time, (i) the effective capture of charge carriers by nanostructures and trapping centers and (ii) the effective transmission of the e–h recombination energy to the Er dopants should be established. For Si-nc:Er, the selective formation of an Er luminescence center that has strong energy coupling with the Si-ncs is required. For GaAs:Er,O with high electrical conductivity, a high density and/or larger capture cross-sections are necessary for the trapping centers.
Other energy losses such as energy back transfer were not discussed in this article. However, the emission intensity is mainly determined by the preprocesses prior to the rare-earth excitation, which are analyzed in this study. To realize a high emission intensity as strong as a pn junction on bulk semiconductors, the emission process of the Er dopants should progress with a fast time constant of the order of a nanosecond.
ACKNOWLEDGMENTS
This work is partly supported by an international collaboration research program of JSPS, and KAKENHI, Grand-in-Aid for Scientific Research (26420287). The author thanks Dr. I. F. Crowe, Prof. M. P. Halsall, and Prof. B. Hamilton of the University of Manchester for the sample preparation of Si-nc:Er and fruitful discussions. The ion implantation was performed with the collaborators, Prof. A. P. Knights (McMaster University) and Prof. R. M. Gwilliam (University of Surrey). GaAs:Er,O was grown by a collaborative group consisting of Dr. A. Koizumi and Prof. Y. Fujiwara (Osaka University) as well as Prof. Y. Takeda (Nagoya University).