Introduction
School food services are a central part to almost all public schools with the underlying premise that learning and healthy diets go hand-in-hand. Securing these services requires a considerable procurement effort and networking with suppliers on the side of schools while it is linked to new opportunities and challenges on the side of suppliers. Particular public school food procurement programs initiated in several countries pursue two objectives: to strengthen the viability of local agricultural production systems and to counteract the health status deterioration among children due to poor eating habits (Vogt and Kaiser, Reference Vogt and Kaiser2008; Bagdonis et al., Reference Bagdonis, Hinrichs and Schafft2009). In the USA, for example, more than 1000 single farm-to-school programs have been established across 34 federal states since the 1990s, when the first pilot projects were initiated (Kalb, Reference Kalb2008). This emergent trend is continuing, with more than 40,000 schools covered under these programs (National Farm to School Network, 2014). Despite the practical relevance of these programs, only a few studies have investigated the role of suppliers in the US farm-to-school and fresh fruit and vegetable (F&V) programs (Izumi et al., Reference Izumi, Wright and Hamm2010a; Peterson et al., Reference Peterson, Selfa and Janke2010).
What is already known of the factors determining participation in these programs is restricted to the USA and there are only very few equivalent results emerging from the European Union (EU). The results of these studies indicate that economic as well as non-economic factors determine suppliers' participation in such programs. Regarding economic motives, only a few studies have found a relatively high increase in suppliers' sales and profit (Conner et al., Reference Conner, King, Kolodinsky, Roche, Koliba and Trubek2012). Most previous studies suggest that food service sales to schools often represent only a very small percentage of farmers' income (Ohmart, Reference Ohmart2002; Bridger, Reference Bridger2004; Joshi and Beery, Reference Joshi and Beery2007; Izumi et al., Reference Izumi, Wright and Hamm2010a, Reference Izumi, Wright and Hammb). Nevertheless, participation in those programs is consistent with farmers' overall economic strategy of spreading their risk across different markets (Izumi et al., Reference Izumi, Wright and Hamm2010a). In addition, Hoellmer and Hartmann (Reference Hoellmer and Hartmann2013) show, in a qualitative study for Germany, that suppliers see their participation in school schemes as a means to improve their reputation and, thus, to potentially win new customers (e.g., citizens in the local community), revealing the importance of longer term economic incentives of the scheme.
Although the economic aspects and the perceived future market potential of school food services are important reasons for participation in such programs, farmers do consider non-economic motives as well, such as the social benefits of the program (Izumi et al., Reference Izumi, Wright and Hamm2010b). For example, the feel-good factor from helping to improve children's dietary habits and supporting the local community has been identified as an important motive (Izumi et al., Reference Izumi, Wright and Hamm2010b). This finding reveals that social embeddedness plays a role in inducing farmers to participate in such programs.
Recent developments have led to new, more diverse and larger local food systems (Buckley et al., Reference Buckley, Conner, Matts and Hamm2013). On the one hand, supply chains become increasingly specific with complex business-related communication processes leading to the integration of new specialized companies in the chain. On the other hand, state-supported local food programs motivate suppliers, which so far did not take part in local food systems, to enter a new market (Renting et al., Reference Renting, Marsden and Banks2003; Gligor and Autry, Reference Gligor and Autry2012; Buckley et al., Reference Buckley, Conner, Matts and Hamm2013; Bateman et al., Reference Bateman, Engel and Meinen2014). Whether social relationships continue to be important in these new systems is therefore a relevant question. Buckley et al. (Reference Buckley, Conner, Matts and Hamm2013) conclude based on a qualitative analysis of a US farm-to-school program, that relationships of trust remain relevant even if local food systems are becoming larger and more complex. Bateman et al. (Reference Bateman, Engel and Meinen2014) find, in another qualitative study, that separating economic opportunities and social benefits in US farm-to-school programs is hardly possible (Bateman et al., Reference Bateman, Engel and Meinen2014). Employing a quantitative approach, Conner et al. (Reference Conner, King, Kolodinsky, Roche, Koliba and Trubek2012) identify three clusters of school supplier participants in the USA: a socially motivated cluster, a low-engaged cluster and a market-motivated cluster. The last constitutes the smallest group with respect to the number of suppliers among the three identified clusters. Compared with the other groups, these suppliers have significantly higher sales volume of food per school, have the greatest percentage of respondents who reported a benefit for their own enterprise, invest in the capital requirements of the program and experience an increase in farm profitability. However, the borders between the groups are fluid (Conner et al., Reference Conner, King, Kolodinsky, Roche, Koliba and Trubek2012).
Similar to the US programs, the EU school fruit scheme (SFS) aims to promote a healthy diet and to stabilize regional food markets. More specifically, the aim of the SFS is to encourage F&V consumption among European schoolchildren and to strengthen the F&V market in the EU. Although the SFS has been implemented in 24 EU countries since its initiation in 2008/09, to the best of our knowledge, no quantitative study has so far identified or analyzed the relative relevance of factors motivating farmers and retailers to intensify or reduce their participation in this scheme. The objective of the present study is to reduce this research gap. Our analysis focuses on investigating suppliers' willingness to change the degree of their SFS participation intensity explicitly considering the relationship and interaction between suppliers and schools. This relationship cannot be analyzed for suppliers that never took part in the SFS. Thus, the target group of our investigation consists of suppliers already participating in the scheme. In our analysis, we concentrate on North Rhine-Westphalia (NRW), the largest federal state in Germany.
Public procurement in the EU: the EU SFS
Considerable structural change in the German horticultural sector is seen with declines in the number of farms growing F&V while the acreage and intensification have increased (Steinborn and Bokelmann, Reference Steinborn and Bokelmann2007; Dirksmeyer, Reference Dirksmeyer and Dirksmeyer2009). With a more concentrated horticulture value chain the power imbalance increased in the chain thus enhancing the challenges for small- and medium-sized enterprises (SMEs) that grow F&V as well as for those SMEs that trade in such produce (e.g. Hingley, Reference Hingley2005). These enterprises have used various strategies including differentiation to respond to the emergence of large and partly multinational competitors and supply chain partners in the value chain (Hinson, Reference Hinson2005). Policy-driven initiatives provided additional opportunities for those firms. Local food schemes have been implemented to foster the marketing of regionally produced food to institutional buyers. They have been introduced as a new instrument to link producers and consumers and establish more sustainable food networks (Peterson et al., Reference Peterson, Selfa and Janke2010).
The SFS initiated by the EU belongs to the group of policy-driven procurement programs. It was launched in the 2009/10 academic year. EU funds available for the SFS increased from € 90 million in 2009/10 to € 150 million in 2014/15. EU funds have to be supplemented by national or private co-funding. The requested level of co-funding differs between countries and over time. In the academic year 2013/14, € 12 million were allocated in the framework of the SFS from the EU budget to Germany, of which € 2.8 million were assigned to NRW, the largest federal state. Given the obligation of a 50% co-funding for Germany that year implied that in 2013/14 about € 5.6 million could be spent in the framework of the SFS in NRW (European Commission, 2013) [The numbers refer to the year our analysis was carried out. For 2014/15 these have changed e.g., € 22.8 million EU funds for Germany and 6.1 million to NRW. The requested share for co-funding declined from 50 to 25% (MKULNV, 2015)].
Children in participating schools are provided with F&V free of charge. Uptake of the scheme has been growing steadily, and for the 2013/14 academic year over 800 schools in NRW were enrolled (European Commission and MKULNV, 2012; MKULNV, 2015). In the same year, 130 active suppliers participated in the SFS in NRW. The price F&V suppliers receive (30 cents/100 g) and the quantity of F&V each child obtains (100 g portion−1; 3 portions week−1) are fixed. Firms interested in providing schools with F&V in the SFS framework in NRW can apply for authorization. Schools eligible to receive F&V in the SFS package can choose from the list of authorized suppliers, which is published on the official NRW SFS website as are the schools participating in the SFS (MKULNV, 2015). Both sides can terminate the supply relationship on short notice, for example, if the schools are not satisfied with the quality or service of their seller or the supplier does not feel that the co-operation with the school is beneficial.
EU member states or even federal states have a great flexibility on how to implement the SFS. The procedure in NRW is an example of those schemes that secure a direct relationship between suppliers and schools. Because the NRW system has been rated successful, it was also adapted by other federal states that joined the SFS in later years. Against this background the results of our analysis, though derived for NRW, have implications for a potential generalization for others parts of Germany and with some limitations also for other countries.
The intensity of participation in public programs
Even though programs aiming to connect local SMEs, especially farmer units, to school procurement systems is a relatively new, fledgling movement, qualitative studies in the USA, in particular, have already analyzed the supplier's motivation (Vallianatos et al., Reference Vallianatos, Gottlieb and Haase2004; Allen and Guthman, Reference Allen and Guthman2006; Berkenkamp, Reference Berkenkamp2006; Kalb, Reference Kalb2008; Izumi et al., Reference Izumi, Wright and Hamm2010b; Schafft et al., Reference Schafft, Hinrichs and Bloom2010; Conner et al., Reference Conner, King, Kolodinsky, Roche, Koliba and Trubek2012; Thornburg, Reference Thornburg2013; Bateman et al., Reference Bateman, Engel and Meinen2014; Thompson et al., Reference Thompson, Twomey, Hemphill, Keene, Seibert, Harrison and Stewart2014). These studies' findings on program outcomes differ, but they are unanimous about the economic as well as social motivation for participation. Evidence for the EU is still lacking despite steady growth of such programs in nearly all member states.
Theoretically, most studies are based on a mixture of approaches. In particular, a combination of the concepts of embeddedness, marketness and economic instrumentalism has become a robust framework in the analysis of alternative food networks, including school procurement programs (Hinrichs, Reference Hinrichs2000; Izumi, Reference Izumi2008; Morgan and Sonnino, Reference Morgan and Sonnino2008; Izumi et al., Reference Izumi, Wright and Hamm2010b; Thornburg, Reference Thornburg2013). The concept of embeddedness is based on Polanyi's (Reference Polanyi2001) critique of the market economy, developed in the middle of the 20th century. According to this theory, the economy has always been embedded within the social framework of our societies and is subordinated to politics, religion and social relations (Polanyi, Reference Polanyi2001; Izumi, Reference Izumi2008). In the context of several studies, embeddedness refers to the values (e.g., community and health) and non-monetary dimensions (e.g., equity and localness) that influence economic transactions (Marsden et al., Reference Marsden, Banks and Bristow2000; Goodman, Reference Goodman2003; Kirwan, Reference Kirwan2004; Izumi, Reference Izumi2008). With respect to the research about school procurement programs constructs like social awareness and commitment form the foundation of embeddedness. However, studies have also warned that a one-sided view leads to a too romantic and optimistic analysis of food networks (Hinrichs, Reference Hinrichs2000; Winter, Reference Winter2003; Goodman, Reference Goodman2004; Born and Purcell, Reference Born and Purcell2006; Izumi, Reference Izumi2008).
The supplementation by marketness and instrumentalism reduces this risk. While marketness analyzes the strength of monetary signals, instrumentalism measures the extent to which individual economic benefits play into economic behavior (Izumi, Reference Izumi2008). At one end of the continuum, transactions are purely motivated by economic self-interest. At the other end, behavior is determined by variables such as community or morality (Hinrichs, Reference Hinrichs2000; Izumi, Reference Izumi2008; Thornburg, Reference Thornburg2013). In a continuum of marketness, actors decide whether to buy or sell a good based on price signals (Polanyi, Reference Polanyi2001; Thornburg, Reference Thornburg2013), e.g., in the case of agriculture, high marketness implies that consideration of price or margins dominate a supplier's decision-making process regarding whether to participate in a given market. Lower degrees of marketness mean that other factors related to food-provisioning activities, such as a desire to provide fresh food to schoolchildren, influence suppliers' decision making (Thornburg, Reference Thornburg2013)—whereas the continuum of instrumentalism helps explain the degree to which self-interest places economic goals ahead of e.g., friendship or morality (Hinrichs, Reference Hinrichs2000). However, these are theoretical assumptions—in reality most likely only very few cases can be found at one of the ends of the continuum. A firm will not be socially conscious without some level of profitability and thus longevity. Indeed, research shows that faced with positive expectations of economic benefits from engaging with schools, suppliers may be even more motivated to support the nutrition as well as the education of the schoolchildren consuming their products (Conner et al., Reference Conner, King, Kolodinsky, Roche, Koliba and Trubek2012).
We adopt the same economic and social drivers of the supplier participation in the SFS identified in the previously mentioned studies. This consensus has guided the formulation of our hypotheses, which are explained in the following section. Participation can be defined as the sum of actions taken by members of a system in order to influence or attempt to influence outcomes. Participation varies in extent and intensity. It is considered increasingly extensive as more people engage in it and more intensive as its cost to the individual in effort, money or time increases (Hardin and Nagel, Reference Hardin and Nagel1989; Singer, Reference Singer1995). In physics, intensity is defined as the activity/power per unit area. Transferred to human behavior it measures the activity or involvement in e.g. a program (Andrews et al., Reference Andrews, Durvasula and Akhter1990; Scharnberg, Reference Scharnberg2010). The intensity of participation (PART) may include the willingness to participate supplemented by further aspects like the willingness to change the business focus in favor of another activity (in this case the participation in the SFS). In contrast to the willingness to participate, which is the target variable in several studies, PART refers to already participating suppliers in our study.
For many suppliers, the SFS combines two different novelties: development of a new trade channel (Hoellmer and Hartmann, Reference Hoellmer and Hartmann2013) and participation in a policy-driven public program. Aibinu and Al-Lawati (Reference Aibinu and Al-Lawati2010) propose, citing the example of e-bidding, that the perceived barriers and benefits, especially the former, of using new trade channels as well as long-term reliability concerns are factors influencing the intensity of participation [which is also embedded in the TAM (technology acceptance model) as perceived usefulness]. Reluctance to use new trade channels is especially high where traditional channels have proved reliable whereas the new ones are associated with uncertainties. The study also indicates that respondents consider the entry costs of building new business opportunities relative to their perceived or real benefits (Aibinu and Al-Lawati, Reference Aibinu and Al-Lawati2010). In addition, concerns about the development of a new trade channel, for example, due to high or even unfair competition, reduce a supplier's PART (Zanetell and Knuth, Reference Zanetell and Knuth2004). The results of the studies cited indicate that to understand why suppliers get involved in new trade channels, as offered by the SFS, it is important that one considers the investments required to participate in this trade channel (e.g., material investments as well as new staff), the degree of reliance (level of competition), the transaction costs, and the economic benefits. However, as our analysis does not focus on the SFS accession process but on the willingness to intensify participation in this new channel, investments likely play a more ambiguous role. This is the case since investments usually include sunk costs that cannot be recovered, firms will have less flexibility in their business decisions (path dependency). This holds especially for very small businesses that are in general more hesitant to make investments and have more problems to bear sunk costs (Skuras et al., Reference Skuras, Tsegenidi and Tsekouras2008).
Methods to measure business performance can be classified as financial as well as operational (non-financial) (Venkatraman and Ramanujam, Reference Venkatraman and Ramanujam1986). Financially oriented measures of success such as profit indicators or sales alone are not always appropriate to capture the whole picture. Therefore, both financial and non-financial measures of business performance are likely important (Prahinski and Benton, Reference Prahinski and Benton2004; Haber and Reichel, Reference Haber and Reichel2005; Tregear, Reference Tregear2005; Reijonen, Reference Reijonen2008; Toledo-López et al., Reference Toledo-López, Díaz-Pichardo, Jiménez-Castañeda and Sánchez-Medina2012). Non-financial measures can include entrepreneurial satisfaction or perceived customer satisfaction (Haber and Reichel, Reference Haber and Reichel2005) and contentment due to adherence to traditions or the feeling of autonomy and pride (Paige and Littrell, Reference Paige and Littrell2002; Reijonen, Reference Reijonen2008). The latter are more difficult to operationalize but can be linked, in the SFS framework, to the conviction that one's own action is successful (i.e., it improves child nutrition) and to key non-price competitive success factors such as quality, delivery of service and flexibility (Venkatraman and Ramanujam, Reference Venkatraman and Ramanujam1986; Prahinski and Benton, Reference Prahinski and Benton2004). These factors can also be used for self-evaluation of a supplier's fit for the SFS market. The importance of product- and service-related factors for sustained competitive advantages, especially for SMEs, is also emphasized by Salunke et al. (Reference Salunke, Weerawardena and McColl-Kennedy2013). In line with the above expositions, we derive the following hypotheses:
H1a
The higher the impact of the SFS on a supplier's financial performance, the higher the PART.
H1b
The higher a supplier's entrepreneurial performance in the SFS, the higher the PART.
H2a
The higher the investments already made, the higher the PART.
H2b
The higher the transaction costs linked to the participation in the SFS, the lower the PART.
H2c
The higher the level of perceived (unfair) competition in the SFS market, the lower the PART.
H3
The more suppliers are convinced that the SFS has improved child nutrition, the more they are willing to participate.
Suppliers' intensity in using new trade channels such as selling their products in recently introduced public procurement programs is determined by a multitude of factors that likely go beyond the ones discussed above. The theory of embeddedness (Polanyi, Reference Polanyi2001) and Granovetter's (Reference Granovetter1985) paradigm of social embeddedness acknowledge that economic action and institutions are affected by social relations. Further, theory claims that economic life is submerged in social relations (Granovetter, Reference Granovetter1985).The theory stresses the importance of personal relations and networks of relations in economic life (Rooks and Matzat, Reference Rooks and Matzat2010), implying that this is a complementary and partly rival concept to the neoclassical theory (Schmid, Reference Schmid, Maurer and Schimank2008; Izumi et al., Reference Izumi, Wright and Hamm2010b). According to this theory, the buyer–supplier relationship has an effect on the supplier's success (Prahinski and Benton, Reference Prahinski and Benton2004) and influences the intensity of participation or rather the intention to intensify the supplier's efforts in a business relationship such as in the SFS. Bassi et al. (Reference Bassi, Zaccarin and de Stefano2014) point out that compared with regular market situations the overall business structure in special programs or projects is mainly characterized by collaboration rather than simple customer–supplier exchanges. Especially with respect to the F&V sector research often pronounced that networks directly and indirectly affect buyer–seller relationships as well as market performance (Lu et al., Reference Lu, Feng, Trienekens and Omta2008; Riedel et al., Reference Riedel, Bokelmann and Canavari2009).
Several studies characterize this aspect of relationship in terms of the strength of ties, the extent to which values are shared, and the level of trust (Kale et al., Reference Kale, Singh and Perlmutter2000; Dhanaraj et al., Reference Dhanaraj, Lyles, Steensma and Tihanyi2004; Li, Reference Li2012). Since social embeddedness tends to reduce barriers against, for example, transfer of information, decreasing the differences between suppliers and buyers is an important step toward creating cohesiveness and building trust (Dyer and Nobeoka, Reference Dyer and Nobeoka2000; Li, Reference Li2012). On the basis of these insights, social embeddedness can be defined as the degree to which a supplier builds networks and manages lateral relationships with buyers and is characterized in terms of tie strength and shared systems (Li, Reference Li2012). Tie strength refers to the extent to which suppliers receive support from buyers or maintain their relationship with buyers, whereas shared systems refer to the extent to which a supplier shares information with buyers openly (Li, Reference Li2012). This social interaction within the buyer–supplier relationship is important in explaining the success of new ventures, but is mostly under-represented in entrepreneurship research (Lechler, Reference Lechler2001).
Furthermore, supplier commitment as part of social embeddedness has been found to be a strong driver of success (Shin et al., Reference Shin, Collier and Wilson2000; Li, Reference Li2012). Performance differences are due to heterogeneous manufacturing capabilities and supplier commitment to operational activities. Buyers tend to choose the services of suppliers who demonstrate a higher level of commitment (Cormican and Cunningham, Reference Cormican and Cunningham2007). Highly committed suppliers are devoted to ensuring the continued success of the relationship by providing buyer satisfaction, which in turn enhances their success (Prahinski and Benton, Reference Prahinski and Benton2004; Li, Reference Li2012). Previous results also show that social embeddedness helps firms to manage their transactions with less effort. Although one-sided specific investments, as well as monitoring of problems and transaction volumes, lead to more negotiation efforts, such efforts decrease if transactions are ‘better’ embedded in a temporal or network sense or if buyers and suppliers can rely on more institutional embeddedness (Rooks et al., Reference Rooks, Raub, Selten and Tazelaar2000).
The findings emphasize that the social relationship between a supplier and the school(s) could influence supplier's SFS participation intensity. Therefore, this study hypothesizes as follows:
H4a
The higher the degree of social embeddedness between a supplier and the school(s), the higher the PART.
H4b
Conflicts in buyer–supplier relationships have a negative influence on the PART.
Materials and Methods
Data collection
The data for this research were obtained by a telephone survey conducted between November 2013 and January 2014 based on a standardized questionnaire. Content validity was supported by a qualitative pre-study of guided interviews with 28 school fruit suppliers from NRW, an extensive literature review, and a pre-test of the questionnaire with 18 school fruit suppliers from another federal state with similar framework conditions. The aim was to conduct a census. Therefore, all of the 130 active suppliers in NRW were contacted. With 99 completed questionnaires we arrived at a response rate of around 80%, which can be considered as relatively high.
The questionnaire started with an introductory part to obtain facts on suppliers' participation in the SFS (e.g., entry date in the scheme) as well as on suppliers perception of the outcome of the SFS on children's nutrition and nutritional knowledge. Subsequently, information was obtained primarily via statement batteries on
-
• processes and demands such as investments linked to the supplier's participation in the SFS,
-
• supplier's plans to intensify or reduce his/her participation in the scheme,
-
• supplier's expectations prior to and the outcome after entering the scheme,
-
• supplier's interaction with the schools (e.g., acquisition and communication),
-
• supplier's perceived competition in the market,
-
• supplier's perceived own relative (to competitors) performance in the market,
-
• the appreciation the supplier perceive to receive due to his/her engagement in the SFS,
-
• supplier's stated motivation for being involved in the SFS.
In the third part, general questions about business facts were requested.
The questionnaire was developed for a larger research project. Thus, only about 60% of the questions of the survey were used for this study.
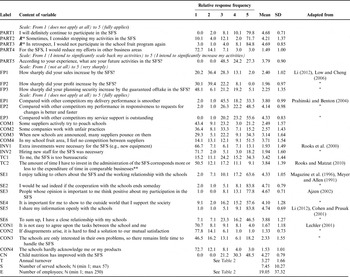
The statements in the different subsections were randomized and read out to the suppliers Participants were in general asked to what extent they agree to the statements on a five-point summated semantic scale ranging from 1 (does not apply at all) to 5 (fully applies). All items from the questionnaire with relevance for the study including scales and descriptive statistics are shown in Table 1. The order in Table 1 is linked to the later analysis and does not follow the sequence of the questionnaire previously described.
Descriptive statistics of the variables.

n = 99; PART, intensity of participation; SE, social embeddedness; COM, competition; FP, financial performance; CON, conflicts in buyer–supplier relationship; NFP, non-financial performance; INV, investments; TC, transaction costs, CN, children's nutrition; T, turnover; S, number of schools; E, number of employees; R*, item has been reverted in order to align with the scale of the other variables; **1 does not apply at all = higher to 5 fully applies or lower.
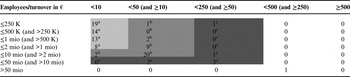
Size classes of enterprises.

Superscript letters correspond to the categories of a = micro, b = small and c = medium-sized enterprises in the European Commission recommendation 2003/361/EC; n = 96 (since 3 of the 99 initial firms have missing values for turnover).
Table 2 shows that almost all companies participating in the survey belong to the category of SMEs, according to the EU definition (2003/361/EC). Most of them are micro and small-sized enterprises. The 99 suppliers involved in the research comprise 36 agricultural enterprises and farm shops, 28 supermarkets, 20 F&V wholesalers, 13 greengrocers and 2 others. The 58 companies in our sample are located in urban areas and 41 in rural or semi-urban areas. Descriptive statistics regarding annual turnover, number of employees and number of served schools are shown in the last three rows of Table 1.
Dependent variable: participation intensity
The literature review provided only limited support for operationalizing the factors that determine suppliers' willingness to intensify their participation in a program such as the SFS. Some studies have a limited scope in that they analyze only the extent to which the suppliers are willing to participate using a single item (Söderqvist, Reference Söderqvist2003; Aibinu and Al-Lawati, Reference Aibinu and Al-Lawati2010). Other studies use multi-item measures by also considering, besides the willingness to participate, the changes in business practices and cooperation (Zanetell and Knuth, Reference Zanetell and Knuth2004), the willingness to assume risk (Napier et al., Reference Napier, Thraen and Camboni1988) or the willingness to invest (Suh and Houston, Reference Suh and Houston2010).
Five statements were developed according to the insights derived from the literature (see Table 1). All statements were measured on a five-point Likert scale. As so far there exist no studies providing information regarding the appropriate weighting of the items considered in PART we decided to apply an equal weighting of all five items. Thus, the dependent variable PART of our multi-regression analysis is determined as the unweighted average of suppliers' responses to these five statements:
 $${\rm PART} = \displaystyle{{\mathop \sum \nolimits_{i = 1}^5 {\rm PAR}{{\rm T}_i}} \over 5}$$
PART2 and PART3 were reverted before the dependent variable PART was calculated in order to align with the scale of the other variables with a low value representing a low intensity of participation and a high value representing a high intensity of participation.
However, aggregating the five items to a multi-item variable also implies a loss of information. Thus, in addition five ordered logit models were estimated considering each of the five individual PARTn variables as dependent variable.
Independent variables: the basic items
To measure financial performance, this study used self-assessment questions concerning profit changes, sales turnover and planning reliability (Cohen and Prusak, Reference Cohen and Prusak2001; Haber and Reichel, Reference Haber and Reichel2005; Li, Reference Li2012). Additionally, the overall yearly turnover, the number of employees and the number of served schools (which is a reliable indicator for sales in the SFS) are considered. Besides financial indicators, business performance can also be measured by operational (non-financial) items. Regarding the latter, we adapted variables from the literature regarding smooth delivery, responsiveness to requests for changes and service support, with each item evaluated relative to a firm's competitors' performance (Prahinski and Benton, Reference Prahinski and Benton2004). In addition, we asked the respondents about their perception regarding the level and fairness of competition in the SFS.
Suppliers may incur costs before entering the SFS (e.g., investments in new equipment or hiring new staff) and in the course of the program (e.g., transaction costs). Similar to Rooks and Matzat (Reference Rooks and Matzat2010), we considered both cost components in asking respondents whether they had made investments or hired new personnel before entering the program and also requested information regarding the perceived bureaucratic and administrative efforts linked to the program (Rooks and Matzat, Reference Rooks and Matzat2010). To measure social embeddedness, we relied on variables adopted from the literature, such as commitment (Meyer and Allen, Reference Meyer and Allen1991; Wilson, Reference Wilson1995; Magazine et al., Reference Magazine, Williams and Williams1996), subjective norms (Lechler, Reference Lechler2001; Ajzen, Reference Ajzen2002) and the strength of the relationship with the school as well as the existence of a shared system (Wilson, Reference Wilson1995; Cohen and Prusak, Reference Cohen and Prusak2001; Li, Reference Li2012). To capture the role of conflicts in the buyer–supplier relationship, questions regarding the coordination level and conflict resolution (Lechler, Reference Lechler2001) were used. The suppliers' opinion regarding SFS's effects on child nutrition was also determined from the questionnaire.
Results
The results reveal that suppliers show a high interest to increase their participation in the SFS (see Table 1). Especially, the variables PART1, PART2 and PART3 obtained high scores—70–85% of the survey participants gave a score of 5. The five variables are correlated but at a lower level than expected (0.223–0.487). This response variety confirms the multidimensional nature of the PART variable. The mean of the multi-item variable PART is 3.46 (SD 0.60) on a summated semantic scale from 1 to 5 and their distribution is reasonably approximated by the normal. The Cronbach's alpha of PART is 0.6. Subsequent analysis was performed in two steps. A factor analysis was used to extract relevant factors that explain PART, followed by a linear regression analysis to test the hypotheses derived above. Furthermore, five ordered logit models were estimated for the individual PARTn variables.
The results regarding the independent variables can be summarized as follows: Most suppliers participating in the survey rated the financial benefits of the SFS relatively low, whereas planning security and entrepreneurial performance obtained higher scores. The competitive situation is perceived heterogeneously by the study participants—while 51% of respondents recognize absolutely no competition in their supply area (COM4), 34% describe a very offensive market behavior of competitors (PART3) and even unfair competition (COM2). Based on findings from the qualitative pre-study perceived unfair competition may include special support for schools by the suppliers which contradicts the rules of the SFS. Although overall suppliers point to a low necessity for investments, there are 20% of suppliers, which indicate that high investments (INV1) and the recruitment of new employees (INV2) was linked to entering the SFS. Furthermore, 34% (TC1) describe the SFS as very bureaucratic and time consuming. This holds especially if compared to other business activities (50%; TC2). With reference to the further variables a high social embeddedness and only a few conflicts between suppliers and schools are described. In addition, the perceived significant improvement of children's nutrition associated with the SFS is emphasized by 48% (CN).
Factor analysis
A principal component analysis with varimax rotation was performed as it is the default method of extraction in social sciences (Costello and Osborne, Reference Costello and Osborne2005). The number of factors was determined by a screen test. All factors in this study had an eigenvalue >1 (Kaiser–Guttman criterion).
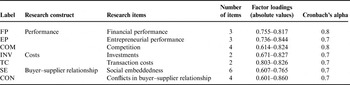
Table 3 presents the factor analysis results for each construct involved in this study. In terms of the reliability analysis, the factor loading for each item was >0.5, and Cronbach's coefficient alpha for each extracted factor was larger than 0.5 (Churchill, Reference Churchill1979; George and Mallery, Reference George and Mallery2003). Furthermore, the Kaiser–Meyer–Olkin value, calculated at around 0.6, was acceptable. Additionally, the Bartlett test of sphericity was significant (χ2 = 783.28; p < 0.001), which is an additional requirement for the suitability of data for factor analysis. The individual items with their allocation to each factor are shown in Table 1.
Factor analysis for each construct.

Regression analysis
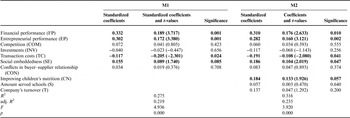
Multiple linear regression analysis was used to examine the influence of social embeddedness, performance, and costs on suppliers' SFS participation intensity. Two models were estimated. Model 1 (M1) considers all factors identified in the factor analysis using the factor scores from Table 3. These factors are also used as independent variables in the ordered logit estimations in Table 5. Model 2 (M2) is an extension of M1 as in addition, suppliers' belief of child nutrition improvement by the SFS, the amount of served schools in the SFS framework, and the annual turnover are considered. Standardized regression coefficients are used for model comparison. According to an F-test, all models are significant overall and no serious violations exist in the plots of standardized residuals as compared to the predicted values and the normal probability plots of standardized residuals. This implies that residuals were normally distributed. The result of the regression analysis is shown in Table 4. The adjusted R 2 ranges between 0.219 (M1) and 0.235 (M2). The variance inflation factor was calculated in all cases to check for multicollinearity between the independent variables of the models. To verify these results, a correlation matrix of all factors and additional variables was calculated. All regression coefficients are much lower than 0.4, indicating no substantial multicollinearity in the independent variables. Furthermore, a correlation analysis could reveal relationship patterns between supplier characteristics. For instance, financial performance correlates negatively with company size (−0.35 for turnover as against −0.30 for employees; p < 0.01). Regarding financial performance and business focus, they are in point biserial correlation with farms/farm-shops (0.23; p < 0.05), greengrocers (0.20; p < 0.05) and supermarkets (−0.29; p < 0.01). Point biserial is used because of the categorical scale of the business focus variables.
The influence on the intensity of participation in the SFS (dependent variable).

Variables p ≤ 0.1 in bold type.
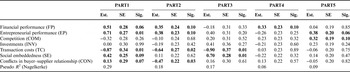
Ordered logit models for the single variables PART 1 to PART 5.

Variables p ≤ 0.1 in bold type.
Est., estimation; SE, standard error, Sig., significance.
The influence of performance on supplier's PART
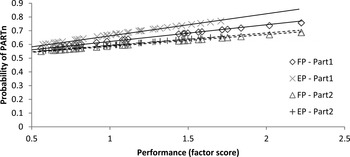
Both financial performance and entrepreneurial performance have a significant influence (p ≤ 0.01) on PART in both models (M1 and M2). With respect to the standardized coefficients (Table 4), the effect of financial performance is slightly stronger compared with entrepreneurial performance. This holds for models M1 and M2 and thus if the multi-item factor is used for the dependent variable PART. Having a closer look at the results based on the single-item dependent variables (PARTn) a more heterogeneous picture emerges (see Table 5). First, Table 5 reveals that financial and entrepreneurial performances are only significant in the PART1 and PART2 models. Second, the relative relevance of financial and entrepreneurial performance is different between PART1 and PART2. The lines in Figure 1 illustrate the simulated probabilities of PART1 (solid lines) and PART2 (dashed lines) across FP and EP. The difference between the solid lines demonstrates that the numerical influence of EP is higher than FP for PART1, while for PART2 no difference is identifiable (congruent curve progression of dashed lines). Surprisingly, the amount of served schools (which indicates the SFS turnover) and the annual turnover do not influence PART (see Model M2). Overall, our results only partially support H1a and H1b.
Simulated probabilities of PART1 and PART2 across FP and EP.

The influence of costs, level of competition, and perceived child nutrition on supplier's PART
Monetary costs, such as investments and new staff (INV), do not show a significant influence on PART. Similarly, the level of perceived (unfair) competition has no significant impact. Transaction costs, however, significantly reduce PART in M1 and M2 (p ≤ 0.05), a result which is also confirmed by the majority of the ordered logit models. Therefore, H2a and H2c are rejected, while H2b is supported. In addition, the suppliers' conviction about improvement in child nutrition due to the SFS influences PART positively (see M2 in Table 5). Therefore, H3 is supported, too.
The influence of social embeddedness on supplier's PART
We tested H4a and H4b with models M1 and M2 as well as with the five ordered logit models. The results reveal that general social embeddedness has a positive influence on PART while conflicts in the buyer–supplier relationship show no significant impact on PART in M1 and M2. The ordered logit models that are based on the single-item dependent variables PARTn reveal the same tendency for the factor ‘social embeddedness’ (see Table 5). Furthermore, they give some indication that also conflicts may have an influence depending on the dependent variable used (e.g., for PART2). Therefore, H4a is supported, whereas H4b is rather disproved.
Discussion
The purpose of this research was to determine the influence of social embeddedness, performance, and costs on supplier's SFS participation intensity. Several key insights emerge from the study.
Our findings mostly correspond to as well as complement the theoretical assumptions and the results of previous studies. Overall, adjusted R 2 value indicates that approximately 25% of the variance is explained by the models applied. These are rather satisfactory results for a cross-sectional enterprise-based study. However, not all predicted variables could be integrated in the models. As in US studies of farm-to-school programs we can show that the reasons for SFS participation are multifaceted (Izumi et al., Reference Izumi, Wright and Hamm2010a, Reference Izumi, Wright and Hammb; Conner et al., Reference Conner, King, Kolodinsky, Roche, Koliba and Trubek2012). In the estimated models, the financial performance was identified as the most influential single factor and thus supports to some extent the relevance of the neo-classical view. This finding is in contrast to qualitative case studies that suggest that this aspect is of rather minor importance, while it supports the results of studies that identified at least subgroups of suppliers in public procurement programs with a distinctive financial motivation (Conner et al., Reference Conner, King, Kolodinsky, Roche, Koliba and Trubek2012). We could detect no influence of a subjective perception of competition on PART. However, entrepreneurial performance, which consists of competitive success factors, contributes significantly to PART. Besides the business-driven determinants, the buyer–supplier relationship is clearly shown to have a significant influence on PART and the social motivation for the promotion of child nutrition. The more suppliers are embedded in the social system, the more they are willing to intensify participation. Considering the standardized coefficients the entrepreneurial performance is of similar relevance as financial performance followed by the factors social embeddedness and transactions costs. However, the results of the ordered logit regressions reveal that the influence of the different explanatory variables may vary depending on the dependent variable used (PARTn). This finding is not surprising, given that the correlation between the five items of PART was rather low as they summarize different dimensions of the ‘Willingness to intensify participation’ in the SFS. Thus, one could argue that if all five variables measure the same, it would not be necessary to combine them to a multi-item PART variable and a comparison of the different single-item ordered models would be meaningless as well.
This study does not claim to separate suppliers' motivations or even suppliers themselves into ‘good’ or ‘bad’ clusters. Rather, it indicates that determinants for a firm's participation in food networks are multidimensional and may differ depending on the company's individual situation (Paige and Littrell, Reference Paige and Littrell2002; Haber and Reichel, Reference Haber and Reichel2005; Reijonen, Reference Reijonen2008; Toledo-López et al., Reference Toledo-López, Díaz-Pichardo, Jiménez-Castañeda and Sánchez-Medina2012). Programs like the SFS were initiated, among other things, to strengthen the viability of local and often small-scale agricultural production systems (Vogt and Kaiser, Reference Vogt and Kaiser2008; Bagdonis et al., Reference Bagdonis, Hinrichs and Schafft2009). The high share of micro and small-sized enterprises as well as farms and farm shops in the sample indicates that the SFS can be attractive to these groups.
Conclusion
We found evidence that suppliers' participation intensity is not only driven by economic motives but that social embeddedness and suppliers perception of the societal value of the SFS have an important effect on PART. To strengthen the latter two government can provide more information about the SFS, thereby making suppliers but also the general public more aware of the relevance of the scheme for children's nutrition. This likely would not only increase suppliers' perception regarding the societal relevance of the SFS but would enhance suppliers' prestige in society with a positive effect on the factor embeddedness. In addition, information could be made available to suppliers that support them in solving conflicts with schools thereby improving buyer–supplier relationship.
Though suppliers' embeddedness and their perception of the impact of the scheme on children's nutrition are important determinants of PART, financial and entrepreneurial success is according to the results of the study even more important for suppliers' willingness to intensify their participation in the SFS. Accordingly, decision makers need to secure that the scheme remains economically profitable. In this respect it is not only relevant at what level the price per 100 g of F&V delivered to the school is fixed, but also of importance are the transaction costs linked to the program.
Regarding the special situation of the SFS in NRW, the results show that the program is very well suited to very small, small and medium-sized companies. In fact, the results showed that neither the size of the enterprise nor the amount of F&V served in the framework of the scheme has a significant effect on suppliers' willingness to intensify their participation in the scheme. For (very) small suppliers serving only a few schools might be interesting and potentially can generate a significant share of the companies' overall sales.
As with all empirical research, this study suffers from several limitations. First, it would have been interesting to investigate the determinants of suppliers' willingness to intensify their participation in the SFS using structural equation modeling. This would have allowed considering potential interactions between independent variables. However, given the sample size of 99 firms this approach was not possible. Second, unfortunately, we did not succeed in convincing all participating suppliers to take part in the survey. Although, biases cannot be completely ruled out, the high response rate and the fact that from our knowledge of SFS suppliers in NRW not specific groups (e.g., with respect to size—large enterprises or with respect to the business area—farmers) primarily declined their participation we are rather confident that the sample is highly representative for all suppliers in NRW. Third, as the investigation was restricted to the largest federal state in Germany, there are limitations in transferring the finding to other EU member states as there exist cultural differences and a diversity in e.g., agricultural structures between EU countries.
Thus, in order to generalize and validate the presented model as a framework for analyzing suppliers' willingness to intensify their participation in the SFS, further research is needed covering other regions. Furthermore, it would be interesting to investigate the determinants of economic success of suppliers' participation in the SFS. Finally, research on different forms of implementing the SFS in other federal states and in other countries could generate insights toward identifying the framework that is most appropriate for the promotion of the local economy while at the same time succeeding in improving children's nutrition.
Acknowledgements
This paper derives from a research project funded by the state government of North Rhine-Westphalia and the European Union.