


Introduction
Study of the genetic structure of the populations of South American nations has been relatively recent, and most studies have mainly examined the frequencies of traditional DNA markers. This is the case for Uruguay, whose population has been analysed using classical genetic markers as well as nuclear and mitochondrial DNA markers (Sans et al., Reference Sans, Alvarez, Callegari-Jacques and Salzano1994, Reference Sans, Salzano and Chakraborty1997, Reference Sans, Weimer, Franco, Salzano, Bentancor and Alvarez2002, Reference Sans, Merriwether, Hidalgo, Bentancor, Weimer and Franco2006, Reference Sans, Figueiro, Ackermann, Barreto, Egaña and Bertoni2011; Bravi et al., Reference Bravi, Sans, Bailliet, Martínez-Marignac, Portas and Barreto1997; Bertoni et al., Reference Bertoni, Budowle, Sans, Barton and Chakraborty2003; Bonilla et al., Reference Bonilla, Bertoni, González, Cardoso, Brum-Zorrilla and Sans2004; Gascue et al., Reference Gascue, Mimbacas, Sans, Gallino, Bertoni, Hidalgo and Cardoso2005). Genetic data have shown that the continental contribution to the Uruguayan population is around 10–14% Native American, 7–9% sub-Saharan African, and the rest European or Mediterranean (Hidalgo et al., Reference Hidalgo, Bengochea, Abilleira, Cabrera and Alvarez2005; Bonilla et al., Reference Bonilla, Bertoni, Hidalgo, Artagaveytia, Ackermann and Barreto2015). However, Uruguay lacks data on its genetic structure using surnames, with only one previous study including isonymy related to a small population derived from a former Native reduction, Villa Soriano (Barreto, Reference Barreto2011).
The use of surnames has been controversial as it has been shown that they have sometimes been changed or taken from other, non-related individuals. For example, in Uruguay the present population lacks Native-origin names, with a very few exceptions. For example, the descendants of the Charrúa Chief (cacique) Sepé initially used the surname Sepé but changed it recently to García (Acosta y Lara, 1981). González-Rissotto and Rodríguez-Varese (Reference González-Rissotto and Rodríguez-Varese1989) stated that Indians from the Jesuit Missions that came to Uruguay changed their habits and their names in an attempt to hide their Native ancestry. Also, African slaves and their descendants took different surnames, such as those of their owners or others, as shown by Rosal (Reference Rosal2009) in a study of the people of African and African descent in Buenos Aires, Argentina. However, very few studies have been performed on this in Uruguay, and in general terms, most have focused on particular issues – for example, the Africans or African descendants that took their name of the national hero Artigas (Yarza Rovira, Reference Yarza Rovira2009). Moreover, some surnames from Europe, the Mediterranean region or elsewhere have been changed or spelt in different ways (Flores, Reference Flores2010). Finally, paternal surnames are frequently lost because of illegitimate unions (see for example, Barreto, Reference Barreto2011), adoption and the inversion of the order of maternal and paternal surnames as a consequence of the influence of the Portuguese-Brazilian system of surnames, especially near the Brazilian border. Moreover, since 2004, in Uruguay it has been possible to choose the paternal or maternal surname as the first surname, and children with only one last name receive either the two maternal (or paternal) surnames or are assigned a ‘common name’ when the child has only one parent, and this parent only has one surname (2004 Uruguay Law 17.823). However, all individuals considered here were born before 1993; that is, before the application of the Law.
The aim of this work was to make a comprehensive study of the present isonymic structure of Uruguay, resulting from population movements and surname drift in the country. For that purpose, the Uruguayan population was investigated to detect its structure through the study of isonymy (Crow & Mange, Reference Crow and Mange1965; Yasuda & Morton, Reference Yasuda, Morton, Crow and Neel1967) at the main administrative level of the nation, namely its nineteen departments. Isonymic distances between departments were analysed in relation to geography. Moreover, by studying the geographic heterogeneity of surnames based on the analysis of different isonymy parameters, it was possible to detect the signs of the direction of migrations.
Methods
Data
The República Oriental del Uruguay is one of the smallest countries in South America, surrounded by Argentina and Brazil, and with an Atlantic Ocean coastline. At its maximum, it is about 700 km long and 500 km wide, with an area of slightly over 176,000 km2. According to the 2011 National Census (INE, 2011) it is inhabited by approximately 3.3 million persons. The country is divided into nineteen departments.
In Uruguay, surnames originated and have been established generally in the same way as in most South American countries. However, Uruguay and Argentina make an exception to the Spanish biparental surname system, with the maternal surname not generally being mentioned, although it appears on official documents.
In 2012, the authors JED and EA obtained surname data from the Corte Electoral of Uruguay suitable for describing the isonymy structure of the country. The data comprised the electoral list for the 2011 presidential general election – a total of 2.5 million individuals over the age of 18 years, distributed in the nineteen departments of the country.
The 2011 National Census found that 7.8% of those interviewed reported African descent, while the percentage with Amerindian descent was 4.9%; 90.8% stated European descent and only 0.5% recognized an Asian descent, while 3.6% gave no response (INE, 2012). These percentages take into account multiple descents. Since ethnic origin is only weakly related to surnames, in the present analysis ethnicity was ignored and departments (sub-national level) were taken as the statistical units. The geography of Uruguay’s departments is well defined, and all individuals in the sample were classified according to the department in which they were enrolled to vote. This location was usually the place of residence, and did not always coincide with their place of birth in Uruguay. For the analysis, 2,501,774 paternal surnames were available.
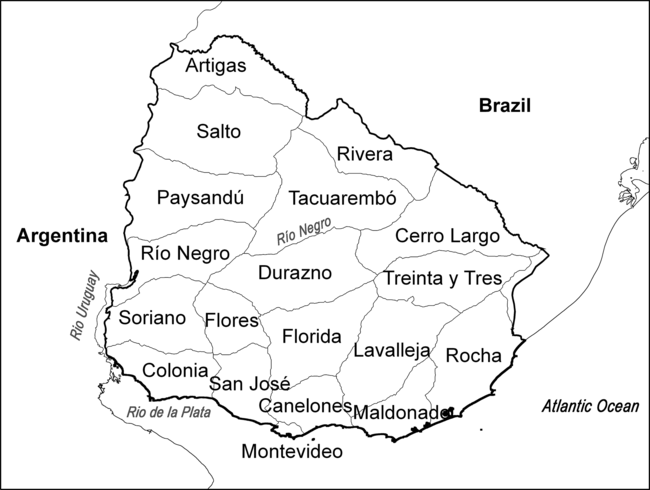
The study area covered the entire nation. The nineteen departments differ in their position, area and population (Fig. 1), and most border the three main rivers of Río de la Plata, Uruguay and Río Negro. Río Negro divides the country north and south, and this affects the country’s population distribution: while the south was mainly populated from the harbour of Montevideo, the north (at least the north-east) was mainly populated from Brazil (Pi Hugarte & Vidart, Reference Pi Hugarte and Vidart1969).
Map of Uruguay showing the nineteen departments.
Analysis
The surname distribution for the whole Uruguay sample was studied by fitting a regression line to the log-log transformation of the number of surnames (S) represented k times (Fox & Lasker, Reference Fox and Lasker1983) in populations I and in population J. The main statistics derived from surname distributions were isonymy and random isonymy. Isonymy within a group J is given by:
 $${I_{jj}} = {\sum_k}{p_{kj}}^2$$
where p kj is the relative frequency of surname k in group J, and the sums comprise all surnames. Random isonymy between groups I and J is estimated as:
 $${I_{ij}} = {\sum_k}{p_{ki}}{p_{kj}}$$
where p ki and p kj are the relative frequencies of surname k in groups I and J, respectively, and the sums comprise all surnames. In addition, Fisher’s α = 1/I jj and Karlin-McGregor’s ν = α/(N−α) were calculated, where N is the surname’s number.
To detect isolation by distance, the linear correlation of surname distances (Lasker’s, Euclidean and Nei’s distances) between localities I and J with their geographic distances was calculated.
Lasker’s distance (Rodríguez-Larralde et al., Reference Rodríguez-Larralde, Scapoli, Beretta, Nesti, Mamolini and Barrai1998) is defined as:
 $$L = - \log ({I_{ij}})$$
Euclidean distance (Cavalli-Sforza & Edwards, Reference Cavalli-Sforza and Edwards1967) is defined as:
 $$E = \sqrt {1\mathop { - \sum }\limits_{\hskip 9pt{k}} \sqrt {{p_{ki}}{p_{kj}}} }$$
where the summation is over all surnames. Nei’s distance (Nei, Reference Nei and Morton1973) is given by:
 $${N_d} = {\rm{-log}}\left( {{{{I_{ij}}} \over {\sqrt {\left( {{I_{ii}}{I_{jj}}} \right)} }}} \right)$$
The definitions of these statistics and their meaning in the study of the microevolution in human groups have been described previously by Barrai et al. (Reference Barrai, Scapoli, Beretta, Nesti, Mamolini and Rodríguez-Larralde1996, Reference Barrai, Rodríguez-Larralde, Mamolini, Manni and Scapoli2000), Rodríguez-Larralde et al. (Reference Rodríguez-Larralde, Dipierri, Gómez, Scapoli, Mamolini and Salvatorelli2011) and Dipierri et al. (Reference Dipierri, Alfaro, Scapoli, Mamolini, Rodríguez-Larralde and Barrai2005); but see also Herrera Paz et al. (Reference Herrera Paz, Scapoli, Mamolini, Sandri, Carrieri, Rodríguez-Larralde and Barrai2014) for a description of Fisher’s α corresponding to the effective surname number; for an exhaustive review see Relethford (Reference Relethford1988).
The random kinship Φ ij (x) between any two localities I and J at distance x is given by:
 $${\Phi_{ij}}\left( x \right) = K\exp ( - Bx)$$
where K is the average kinship at geographic distance x = 0, say average F ST (measured as I jj /4) and B is a function of the average mutation rate and the variance of x (Malécot, Reference Malécot1955; Kimura, Reference Kimura1960). The value of Φ ij (x) is always positive and is expected to decrease exponentially to 0 with increasing distance. Random kinship between groups I and J was estimated as:
 $${\Phi _{ij}}\left( x \right) = {I_{ij}}\left( x \right)/4$$
where average F ST is the average kinship at distance x = 0 (Barrai et al., Reference Barrai, Rodríguez-Larralde, Dipierri, Alfaro, Acevedo and Mamolini2012). Linear geographic distances were obtained using ArcGis® (ESRI) software.
The significance of correlations was assessed with Mantel’s test using 1000 permutations (Mantel, Reference Mantel1967; Smouse et al., Reference Smouse, Long and Sokal1986). For a graphic representation of the relationship between surname distributions at different locations, these were mapped on the first and second dimensions of the Multidimensional Scaling (MDS) of Nei’s distance matrix. To this purpose, the R® software package was used (R Development Core Team, 2012). To detect the direction of surname diffusion, following Menozzi et al. (Reference Menozzi, Piazza and Cavalli-Sforza1978), the first three components from the Principal Component Analysis (PCA) of the same matrix were also projected individually on the Uruguay map, again with the ArcGis software package.
To clarify and complement the clusters obtained with the MDS, dendrograms of departments were built, obtained from the matrices of isonymic distances between these administrative sections. The dendrograms were only an additional option for the clustering, and do not imply that their results were generated by subsequent splits of pre-existing clusters.
Results and Discussion
Most frequent surnames
The distribution of study sample surnames by department is given in Table 1, along with the main parameters derived from isonymy theory. The distribution of the logarithm of the number of surnames over the logarithm of the number of times they occur (Fox & Lasker Reference Fox and Lasker1983) was fairly linear. Some convexity in the distribution was apparent, and a possible explanation for this is the immigration of independent family groups with uncommon surnames, which has been observed in Uruguay.
Distribution of study sample surnames and main parameters derived from isonymy theory by Uruguay department

Long = longitude; Lat = latitude; N = number of surnames; S = number of different surnames; α = Fisher’s; ν = Karlin-McGregor’s v; I = isonymy; and F ST = random component of inbreeding.
The average number of instances (persons) with the same paternal surname, that is (Sample Size)/(Number of Surnames) ratio (SS/S), the so called ‘type-token’ ratio of glottologists (Adamic & Huberman, Reference Adamic and Huberman2002), was 36 (see Table 2) – the lowest ratio that was observed in previous studies covering six countries and more than 77 million surnames from Spanish-speaking populations. However, this value is similar to those from Spain, and comparable to those of other European countries.
Comparison of isonymy parameters in nine European countries, five South American countries, USA and Texas and in Yakutia, Siberia

The low type-token ratio, as well as the high incidence of uncommon surnames, in Uruguay is coherent with the several migration waves that make up the Uruguayan population, together with the slave trade and Native background. Unlike in Latin American countries more related to the time of first conquest, Uruguay was populated more recently by Europeans, with the first settlements being founded at the end of the 17th century by Iberians (Spanish and Portuguese), who brought some African or African-descendant slaves. In 1662, Spain founded Villa Soriano, initially a Native Indian reduction, and in 1680, the Portuguese founded Colonia del Sacramento. Later, in 1724–27, the Spanish (mostly from the Canary Islands) founded the capital city of Montevideo. After the installation of the Republic (1830), in the 19th and 20th centuries waves of immigrants came from different European and Near Eastern countries. In order these were French (mostly Basques), Spanish, Italian, Slaves, Armenians, Jews and Syrian-Lebanese (Pi Hugarte & Vidart, Reference Pi Hugarte and Vidart1969). These migrations lasted until the 1960s decade and have resumed recently.
The 50 most frequent surnames were studied in some detail. The most frequent surnames were Rodríguez with 75,039 occurrences, González with 50,573, Martínez with 37,637, Fernández with 31,769, Pérez with 28,511 and García with 27,331. After these, were Silva (27,070), López (21,959), Pereira (21,337) and in the tenth place Sosa (20,257). Overall, the first ten surnames comprised 341,483 individuals, or 13.6% of the total elector sample.
The most frequent surnames were consistently Spanish. The main difference is represented by Portuguese surnames, frequent in the North East of the country near the Brazilian border. So, surnames like Ferreira (15,624), Pereira (21,137) and Silva (27,070) were highly represented. These surnames, however, are frequent also in Spain. Iberian surnames reflect the conquerors and colonizers that have entered the country since the 17th and 18th centuries. Moreover, care should be taken as Iberian surnames also applied to Natives and Africans, who took their names from conquerors, owners or others during the Spanish/Portuguese domination, with some exceptions such as Brown and Rondeau, taken from Admiral George Brown and General Jose Rondeau – military leaders who participated in the Independence war against Spain (Lucas, Reference Lucas1992).
Italian surnames were less represented. The most frequent was Ferrari (2206), followed by Rossi (1746) and Bianchi (1176), the three ubiquitous in Italy, then Parodi (1390), typical of the Genoa area, and Sanguinetti (1249) from Eastern Ligury. Two Basque surnames – Duarte (43rd, with 6300 representations) and Larrosa (49th, with 5632) – were among the most frequent 50 surnames. Italian migration was mainly related to the first waves after Independence, following the French (mostly Basque) and Spanish (Pi Hugarte & Vidart, Reference Pi Hugarte and Vidart1969).
These 50 most common surnames did not include anyone related to the latest immigration waves that took place at the end of the 19th and beginning of the first half of the 20th centuries, from different regions, including Central–Eastern Europe and the Near East. However, it is possible to identify some that denote those different origins, such as Muller/Moller (German, 627 representations), Armand Ugon (Waldensian, 317), Miller (English, 310), Schmidt (German, 216), Cohen (Jewish, 154) and Garabedián (Armenian, 59). Moreover, as spellings usually have several forms, it is possible to consider terminations: ‘ián’, usually Armenian, had 5800 appearances; ‘sky/ski’ (Slavic, mostly Polish), 2958; ‘berg’ (German/German Jewish), 913; and ‘skas’ (Lithuanian), 276. At least two Native Indian surnames were also detected, originally from the Jesuitic Missions: Yasuiré, with 111 representations, and Barité, with 64. No African-origin surnames were identified, despite special attention being given to the possible use of place names, places of birth and ethnic groups, as described by Cuba Manrique (Reference Cuba Manrique2002) in her study about the surnames of African slaves in Perú. A detailed analysis of the origin of surnames and their mutations will be done in a future article.
Isonymy by department
Fisher’s α is an estimate of the ‘effective surname number’ – the number of surnames which, having the same frequency, would result in the same isonymy as that actually observed. Uruguay department α was found to be correlated (r = 0.736, p < 0.001) with longitude, but not with latitude (r = 0.24, non-significant). So, high α and low F ST were clustered in the south-western departments, while lower α and higher inbreeding were found in the north-eastern departments. This could be explained by immigration and regional history: the north-east region was populated mainly from Brazil, while the south-west received European (as well as Iberians, Italian and Basques: Germans, Waldesians, British, Russians and Armenians) and Near East immigration waves (Turkish, Syrian, Lebanese), some of them funding colonies in the west and south-west of the country (Pi Hugarte & Vidart, Reference Pi Hugarte and Vidart1969; Vidart & Pi Hugarte, Reference Vidart and Pi Hugarte1969; Barrán & Nahum, Reference Barrán and Nahum1971).
The effective surname number, α, for Uruguay was estimated to be 302 for the country as a whole. The average for the nineteen departments was 235.8 ± 19.1. Differences between administrative levels, and the country as a whole, were observed when different subdivisions of the same area and population were considered. This is the Prefecture Effect, called F ST by Nei and Imaizumi (Reference Nei and Imaizumi1966) in Japan, and so named by Scapoli et al. (Reference Scapoli, Mamolini, Carrieri, Rodríguez-Larralde and Barrai2007). Nei and Imaizumi observed that, for the same area and population, small subdivisions have larger F ST values, and larger subdivisions have smaller F ST values. In their study, the effect was seen in towns and in the Japanese prefectures where the towns were located; hence the name. In Uruguay, departments are analogous to Japanese prefectures, so the difference in α between the country as a whole (302) and the departmental average (235.8) is a standard Prefecture Effect.
Values of the inbreeding coefficients and of α for departments are given in Table 1. The highest value of α (393.4), corresponding to the lowest random inbreeding, F ST (0.000637), were observed in Paysandú, followed by Soriano and (376.5, p < 0.001 respectively) and Colonia (361.5, p < 0.001). These three departments are on the Argentinean border, along the Uruguay River. The opposite values correspond to the north-east, being lowest in Rocha (121.8) and highest F ST (0.002040) followed by Cerro Largo (154.8, p < 0.002 respectively) and Rivera (161.1, p < 0.002). All these departments are on the Brazilian border. In Montevideo, the department with the highest number of electors, α, was 346.1, while at the other extreme, the department of Flores, with about fifty times fewer electors than the capital, had an α of 208.8, indicating a minor effect of sample size on α.
Isolation by Distance
Isolation by Distance was studied through the correlation between geographic and surname distances at the department level. Nei’s, Euclidean and Lasker’s distances between the nineteen departments were significantly correlated with linear geographic distances, being highest for Nei’s (r = 0.57 ± 0.073), intermediate for Euclidean (r = 0.46 ± 0.079) and lowest for Lasker’s (r = 0.17 ± 0.097) distances. As an example, the scatter diagram of Nei’s distance between departments over geographic distance is given in Fig. 2. Nei’s distance had the largest correlation.
Variation of Nei’s distance between departments with geographic linear distance.

The signal extracted from the scatter diagram of Nei’s distance for departments is given in Fig. 3. A clear tendency towards an asymptote is not observed, as it was in Spain, Bolivia, Chile and Honduras (Rodríguez-Larralde et al., Reference Rodríguez-Larralde, González-Martín, Scapoli and Barrai2003, Reference Rodríguez-Larralde, Dipierri, Gómez, Scapoli, Mamolini and Salvatorelli2011; Barrai et al., Reference Barrai, Rodríguez-Larralde, Dipierri, Alfaro, Acevedo and Mamolini2012; Herrera Paz et al., Reference Herrera Paz, Scapoli, Mamolini, Sandri, Carrieri, Rodríguez-Larralde and Barrai2014). In these countries the relation between isonymic and geographic distance flattened after 100 km. There was a continuous increase in surname distance up to 400 km, indicating the presence of increasing isolation and drift up to that distance. In total 171 pairs of isonymic–geographic distances were obtained – a number too small for strong considerations, particularly in comparison with other South American countries. These data can be related to two facts: 1) the lack of natural barriers inside the country, and 2) the fact that, during historic times, the country was mainly populated from the Montevideo area, radiating from the south to the rest of the territory.
Signal extraction from the variation of Nei’s distance (±SD) between departments over geographic distances.

Kinship
Random kinship between departments was plotted as a function of geographic distance (Fig. 4). Kinship tended to decrease with distance, as predicted by Malécot (Reference Malécot1955) (see also Kimura, Reference Kimura1960). However, given the very small number of points relating isonymic and geographic distances, the kinship decay could not be described as exponential. Specifically, the exponential decay should be characteristic of structures that are more linear than Uruguay; for example, as observed in Chile (Barrai et al., Reference Barrai, Rodríguez-Larralde, Dipierri, Alfaro, Acevedo and Mamolini2012), Honduras (Herrera Paz et al., Reference Herrera Paz, Scapoli, Mamolini, Sandri, Carrieri, Rodríguez-Larralde and Barrai2014) and in Albania (Mikerezi et al., Reference Mikerezi, Xhina, Scapoli, Barbujani, Mamolini and Sandri2013). In the case of Uruguay, kinship was found to decrease with distance, but it was not possible to determine the shape of the decay function.
Decay of random kinship (±SD) in Uruguay over geographic distance and pairwise distances between departments.

Relations between departments of Uruguay
In order to obtain a general idea on the movements of population groups in Uruguay, MDSs and PCAs were performed on the matrix of Nei’s isonymic distances between departments. The PCA projection on the first two axes of Nei’s matrix between departments (Fig. 5) indicated one south-centre cluster formed by Colonia, Soriano, Flores, San José, Florida and Lavalleja, and another cluster in the south including Montevideo, Canelones and Maldonado. The other departments were projected less closely.
Projection of Nei’s distance matrix on the first two components of the PCA. The first component removes 44.36% of variability, and the second component 26.03%.

Figure 6 shows the dendrogram obtained from Nei’s matrix. From right to left, a first cluster is composed of two subclusters: the most southern one (Maldonado, Canelones, Montevideo and Lavalleja) and the most eastern one (Cerro Largo, Treinta y Tres, associated with coastal Rocha). A second cluster, also with two subclusters, is formed by the west-central departments of Durazno, Soriano, Río Negro and Paysandú on the right bank of the Uruguay River, on the one hand, and by south-central Flores, Florida, San José and Colonia, on the other. Finally, the last departments to join the dendrogram are the most north-western ones: Salto and Artigas bordering with Rivera and Tacuarembó. All these clusters are related to historical events, and despite the lack of data, seem to be related also to molecular information (Sans et al., Reference Sans, Salzano and Chakraborty1997, Reference Sans, Merriwether, Hidalgo, Bentancor, Weimer and Franco2006, Reference Sans, Figueiro, Ackermann, Barreto, Egaña and Bertoni2011, Reference Sans, Mones, Figueiro, Barreto, Motti, Coble, Bravi and Hidalgo2015; Bonilla et al., Reference Bonilla, Bertoni, González, Cardoso, Brum-Zorrilla and Sans2004; Gascue et al., Reference Gascue, Mimbacas, Sans, Gallino, Bertoni, Hidalgo and Cardoso2005; Hidalgo et al., Reference Hidalgo, Mut, Ackermann, Figueiro and Sans2014). In this sense, in the first subcluster, Montevideo has only a 1% Native contribution using classical markers and 21% considering mitochondrial DNA (mtDNA); in the second subcluster, Cerro Largo has 8% Native contribution using classical markers and 32% with mtDNA; and in the last cluster, Tacuarembó has 20% and 62% respectively (Sans et al., Reference Sans, Salzano and Chakraborty1997, Reference Sans, Merriwether, Hidalgo, Bentancor, Weimer and Franco2006; Bonilla et al., Reference Bonilla, Bertoni, González, Cardoso, Brum-Zorrilla and Sans2004; Gascue et al., Reference Gascue, Mimbacas, Sans, Gallino, Bertoni, Hidalgo and Cardoso2005).
Dendrogram of Uruguay departments showing Nei’s distance, based on complete-linkage clustering method of cluster fusion.

Mapping of the first three components of Nei’s matrix
The structures revealed by the MDSs and the dendrograms are only partially indicative of the possible movements of the population. Therefore, to get a general idea of the direction of any population movements in Uruguay (following Menozzi et al., Reference Menozzi, Piazza and Cavalli-Sforza1978), the first three components of Nei’s distance matrix, obtained from the PCA and MDS, were mapped (following Menozzi et al., Reference Menozzi, Piazza and Cavalli-Sforza1978). The PCA components were provided because the relative importance of each component was given by the corresponding eigenvalue, while the MDS provides the value of the stress for a judgement of the overall fitting on the dimensions. The resulting maps are given in Fig. 7.
Projection of Nei’s matrix of surname distances on districts of Uruguay by mapping (a) the first three PCA factors (i: Factor 1 = 44.36.5%; ii: Factor 2 = 26.03%; iii: Factor 3 = 13.86%); (b) the first three MDS dimensions (i: Dimension 1; ii: Dimension 2; iii: Dimension 3. Stress = 10.47%).

The intensity of colour in each map is proportional to the deviation of the department on the respective axis. The map variation of the first component of the PCA, which accounts for almost half the variability (44.36%) in the north–south direction, indicates a sense of movement from the south of the country towards the north and the east along the Río de la Plata. This might mean that the main immigration passed through Montevideo, in the extreme south of the country, as seen when analysing Isolation by Distance. The second and third components (26.03% and 13.86%) give a somewhat similar indication, although with minor intensity, because of their size. Overall, the three components account for more than 84% of the surname variation as obtained from Nei’s distance matrix. Then, the sense of movement may be postulated as being from the south towards the north, and from west towards the east. This might be inferred also from looking at the PCAs in Fig. 7.
The mappings of the first three dimensions of the MDS are compatible with those obtained from the PCA. The indication of possible movement towards the east and north seems clear enough for the first and second dimension, but less so for the third. So, the isonymic structure of Uruguay seems to be mainly due to migration from the Plata regions, with radiation towards the east and north, and with subsequent isolation and drift, with short-range migration playing a major (and drift a minor) role in the generation of the present geographical variation in surnames.
At present, most internal migration seems to take place towards the capital and other main towns upstream and on the left bank of the River Uruguay. Although these movements have not been documented, recent internal migrations show that Montevideo is no longer the main centre of internal population movement and, moreover, part of its population has migrated to the neighbouring area of Canelones (Pellegrino, Reference Pellegrino2003). These results are an addition to the available knowledge that has been acquired over the course of time to meet the challenges of planning and organization of the territory in Uruguay (Yagüe & Díaz Puente, Reference Yagüe and Díaz Puente2008).
The methodology described in this paper has been used to analyse the isonymic structure of several South American countries (Rodríguez-Larralde et al., Reference Rodríguez-Larralde, Morales and Barrai2000, Reference Rodríguez-Larralde, Dipierri, Gómez, Scapoli, Mamolini and Salvatorelli2011; Dipierri et al., Reference Dipierri, Alfaro, Scapoli, Mamolini, Rodríguez-Larralde and Barrai2005, Reference Dipierri, Rodríguez-Larralde, Alfaro, Scapoli, Mamolini and Salvatorelli2011; Barrai et al., Reference Barrai, Rodríguez-Larralde, Dipierri, Alfaro, Acevedo and Mamolini2012) and in Central American Honduras (Herrera Paz et al., Reference Herrera Paz, Scapoli, Mamolini, Sandri, Carrieri, Rodríguez-Larralde and Barrai2014). In these countries, 4 (Venezuela), 24 (Argentina), 23 (Bolivia), 4.5 (Paraguay), 4.5 (Honduras) and 16.5 (Chile) million surnames from censuses and electoral registers were used, similar to the Uruguay study. In contrast, in European countries and in the USA surnames have been taken from telephone directories (Barrai et al., Reference Barrai, Rodríguez-Larralde, Mamolini, Manni and Scapoli2001; Scapoli et al., Reference Scapoli, Goebl, Sobota, Mamolini, Rodríguez-Larralde and Barrai2005, Reference Scapoli, Mamolini, Carrieri, Rodríguez-Larralde and Barrai2007; Rodríguez-Larralde et al., Reference Rodríguez-Larralde, Scapoli, Mamolini and Barrai2007).
The average value of α for different population unities (cities, states, districts, provinces or departments depending on the country, divisions that are relatively comparable) and Isolation by Distance, as measured by the correlation between isonymic and geographic distances, are given in Table 2 for the countries studied up to now. Several features emerge from this comparison. First, there is a general similarity among European nations and the USA in the profusion of surnames as measured by α, with the exception of Albania and Spain. Uruguay has an intermediate position between these two countries and the rest of Europe/USA, and is different to South American countries, with the exception of Argentina. Second, for Isolation by Distance as measured by the linear correlation, Spain and USA have the lowest values, and Italy, France and Venezuela, the highest, with Uruguay being close to the average. Finally, the type-token ratio (SS/S) is lower in Uruguay relative to other South or Central American countries, and is similar to those of Spain and little higher than those of most of the rest of Europe.
Conclusions
In conclusion, surnames can be used to show social patterns related to geographic spread and distance, ancient or recent migration movements, population dynamics, ethnic or geographic origins, ethnicity or other historical facts (Colantonio et al., Reference Colantonio, Lasker, Kaplan and Fuster2003; Darlu et al., Reference Darlu, Bloothooft, Boattini, Brouwer, Brouwer and Brunet2012; Cheshire, Reference Cheshire2014). Despite the lack of names of Native or African origin, illegitimate unions, as well as different spellings or surname changes, isonymy studies can work with a large amount of data allowing comprehensive analysis of present and past populations. This study’s analysis in Uruguay has several interesting finding, including the general similarity among European nations in the profusion of surnames as measured by α and for Isolation by Distance as measured by the linear correlation. Moreover, in Uruguay, the average number of persons with the same surname is small (36) for a South American country.
Different regions can be defined in Uruguay on the basis of longitude. The random inbreeding estimate (F ST ) was lower and the effective quantity of surnames (α) higher in the more densely populated south-west area, and in Montevideo, with Paysandú, Río Negro, Soriano and Colonia having the lowest levels of inbreeding. It can be concluded that the current population structure in Uruguay is the result of the action of short-range directional migration, particularly along the River Uruguay and along the Río de la Plata. The north-east (Rivera, Tacuarembó, Cerro Largo) has the highest level of inbreeding F ST and the lowest α, indicating greater isolation. In contrast to regions that were populated by a series of migration waves of different origins, the north-east had a historic penetration from the Brazilian border and the inheritance of land (Carvalho Neto, Reference Carvalho Neto1965; Rama, Reference Rama1967).
It should be mentioned that in Uruguay electors are registered according with their place of residence when they were around 18 years old; if they move, even to neighbouring countries, they do not always change their addresses. So, internal migration cannot be always be seen in the available electoral registers. Nevertheless, from the current analysis it appears that migration is a major contributor to surname differentiation, while the contribution of drift, considering the small variance in α, seems to be minor.
Author ORCIDs
M. Sans, 0000-0002-1564-8761
Acknowledgments
The authors are grateful to the Corte Electoral of Uruguay, who allowed access to the data used in the study, and to the Embajada de la República Argentina in Uruguay for their help in obtaining them.
Funding
The work was supported by grants from the University of Ferrara to Chiara Scapoli, by the University of Jujuy to Emma Alfaro and by IVIC to Alvaro Rodríguez-Larralde.
Conflicts of Interest
The authors have no conflicts of interests to declare.
Ethical Approval
The authors assert that all procedures contributing to this work comply with the ethical standards of the relevant national and institutional committees on human experimentation and with the Helsinki Declaration of 1975, as revised in 2008.



