Introduction
Natural resource governance is increasingly multi-scalar and encompasses multiple actors including governmental organizations, non-governmental organizations (NGOs) and community-based organizations (CBOs), as well as scientists (Lemos & Agrawal Reference Lemos and Agrawal2006, Bodin et al. Reference Bodin, Robins, McAllister, Guerrero, Crona, Tengö and Lubell2016). Vertical and horizontal linkages among actors are therefore necessary for effective governance (Cash et al. Reference Cash, Adger, Berkes, Garden, Lebel and Olsson2006). In particular, engaging resource users in a meaningful governance process is fundamental to effective and adaptive governance (Ostrom Reference Ostrom2008). This engagement may contribute to participatory processes that promote enhanced quality of decisions, greater perceptions of rule legitimacy, reduced management costs and increased compliance (Reed Reference Reed2008).
In practice, however, resource users are often marginalized in governance networks, lacking connectivity to decision-makers (Kooiman et al. Reference Kooiman, Bavinck, Jentoft and Pullin2005, Ernstson et al. Reference Ernstson, Sorlin and Elmqvist2008). Relationships between resource users and governing bodies at multiple levels can be difficult to develop and sustain. For example, resource users may perceive conflicts between local and scientific knowledge; local and national priorities may differ; official national languages may not be spoken in communities; and distances between communities and government centres may be large (Cash et al. Reference Cash, Adger, Berkes, Garden, Lebel and Olsson2006, Stovel et al. Reference Stovel, Golub and Meyersson Milgrom2011). These challenges can be exacerbated by fundamental inequities within the governance structure, such as power asymmetries and mistrust (Boonstra Reference Boonstra2016).
Individuals or organizations that ‘broker’ interactions across these interfaces are important in connecting resource users to wider governance networks (Cash et al. Reference Cash, Adger, Berkes, Garden, Lebel and Olsson2006, Plummer et al. Reference Plummer, Armitage and de Loë2013). Actors in brokering positions can connect resource users to information about marine resources held by other actors or, conversely, share local knowledge held by resource users. Brokers can connect resource users to managers, policymakers and scientists, bridging epistemologies, finding common priorities, facilitating information exchange and building trust (Hahn et al. Reference Hahn, Olsson, Folke and Johansson2006, Berkes Reference Berkes2009). Interactions between local-level stakeholders and co-managers, one potential form of broker, have been well-studied (Berkes Reference Berkes2009, Cinner et al. Reference Cinner, McClanahan, MacNeil, Graham, Daw and Mukminin2012), but interactions connecting resource users to other elements of formal governance systems have not (Weiss et al. Reference Weiss, Hamann, Kinney and Marsh2012). Though co-management approaches are increasingly being adopted, the need to understand mechanisms of effective brokerage to resource users in diverse governance structures remains.
Social network analysis and information brokerage
Social network analysis (SNA) provides a quantitative method for identifying actors in brokering positions (Bodin & Crona Reference Bodin and Crona2009). Brokerage is a structural network concept where an actor (the broker) occupies a network position with the potential to bridge unconnected actors and facilitates interactions, such as information flow (Gould & Fernandez Reference Gould and Fernandez1989, Stovel & Shaw Reference Stovel and Shaw2012). In its most basic form, brokerage measures the number of times an actor is located between two otherwise unconnected actors with different ‘affiliations’ (Gould & Fernandez Reference Gould and Fernandez1989). Brokerage has been observed in several contexts, bridging social strata (Bonacich Reference Bonacich1973), levels of organization, geographical space (Carlsson & Berkes Reference Carlsson and Berkes2005) or connecting science and policy (Guston Reference Guston2001). Brokers’ ability to hold information from a variety of sources allows them to respond early to threats and changes, see opportunities, facilitate collaboration and manage conflict (Folke et al. Reference Folke, Hahn, Olsson and Norberg2005, Bodin et al. Reference Bodin, Crona and Ernstson2006). In large networks where the maintenance of direct links with all actors is costly, brokers can help lower transaction costs (Folke et al. Reference Folke, Hahn, Olsson and Norberg2005).
Information brokerage is particularly important for participatory natural resource management. Effective stakeholder engagement depends upon the communication of information on, for example: resource dynamics; formal governance processes and stakeholder access mechanisms; and resource users’ likely responses to management interventions. Inadequate two-way information exchange (between resource users and wider governance networks in both directions) may hinder the achievement of the positive outcomes expected from stakeholder participation (Reed Reference Reed2008). Understanding information brokerage between resource users and other actors is therefore important to improve governance.
Previous studies in natural resource governance have measured multi-level networks across a variety of management contexts, including freshwater (Horning et al. Reference Horning, Bauer and Cohen2016) and coastal ecosystems (Cohen et al. Reference Cohen, Evans and Mills2012, Berdej & Armitage Reference Berdej and Armitage2016). However, few have compared multiple countries and governance systems to identify actors that connect resource users to wider governance networks. For example, information brokers may be formal, such as a co-management partner with a brokerage mandate, or informal, such as an environmental NGO without a brokerage mandate (Provan & Kenis Reference Provan and Kenis2008, Crona & Parker Reference Crona and Parker2012). This study addresses this gap by investigating actors engaged in information brokerage in four Caribbean countries.
Holding a brokering position does not mean that information brokerage is occurring (Gould & Fernandez Reference Gould and Fernandez1989). Brokers may lack legitimacy, resources or opportunities to support information flow (Lind et al. Reference Lind, Tirado, Butts and Petrescu-Prahova2008, Sandström et al. Reference Sandström, Crona and Bodin2013). Brokering ability may be diminished by conflicts or misalignments of priorities between actors (McClanahan et al. Reference McClanahan, Cinner, Kamukuru, Abunge and Ndagala2008). For the purpose of this paper, we suggest that broker performance is indicated by the extent to which the broker is perceived to be a source of information by resource users.
This study contributes to understanding the brokerage role of actors involved in information-sharing between resource users and governance networks, specifically for Caribbean coral reef governance, by: (1) using SNA to identify which actors broker reef-related information between reef users and governance networks; and (2) using supplementary interviews to investigate the performance of brokers, based on how well they facilitate information flow to resource users.
Methods
Study area
Geopolitical complexity, marine dependency and the state of its coral reefs make the Wider Caribbean Region appropriate for studying diverse governance interactions. The rapid ecological decline of Caribbean coral reefs is well-documented (Jackson et al. Reference Jackson, Donovan, Cramer and Lam2014), leading to calls for improved governance to deliver positive environmental and social outcomes (Mahon et al. Reference Mahon, Fanning, McConney, Coffen-Smout and McConnell2014). We conducted research in four countries – Barbados, St Kitts and Nevis, Belize and Honduras (Bay Islands) – that reflect some of the Wider Caribbean Region’s socioeconomic diversity and varied levels of marine resource dependency (Supplementary Fig. S1, available online). Our intention is not to generalize the findings across the region, but to identify the different ways in which brokers play roles within these diverse governance systems. Within each country, three coastal communities were studied, capturing a diversity of resource use (Fig. S1).
The countries studied varied in governance arrangements for coral reefs (Turner et al. Reference Turner, Fitzsimmons, Forster, Mahon, Peterson and Stead2014). Barbados and St Kitts and Nevis are small-island states where national government departments are predominantly responsible for coral reef management. In St Kitts and Nevis, the federation of the two islands adds complexity, with Nevis having its own island-level administration. Aside from this, there is little distinction between national- and local-level administration due to the islands’ small size. Few local groups or organizations are involved in reef management in either country.
In contrast, the Central American continental states of Belize and Honduras have more complex governance systems. While Belize is predominately governed at a national level, town or village councils may be involved in decisions about local reef resources. In contrast, while national government actors in Honduras are responsible for providing policies, legislation and regulations, these are implemented and enforced by local government. The Bay Island study sites have local municipal government departments with some responsibility for reef management and protected areas. In both countries, a large number of NGOs and local organizations (e.g., cooperatives) also play a role in coastal and marine resource management, including co-management arrangements. Compared to Honduras and the island nations, marine resource users are more organized in Belize, with the majority belonging to active fishing cooperatives or tour guide associations.
Defining reef governance networks
SNA measures social network structures as nodes (e.g., people or organizations in the network) and ties (relationships or interactions) that connect them. In our study, nodes included actors at the community, intermediate or national levels, with the primary criteria for inclusion being that they were governing, being governed or providing information and advice related to coral reefs and their associated resources.
Network boundaries were defined with the aim of collecting data for a full network analysis, including all relevant actors in the network being studied (Wasserman & Faust Reference Wasserman and Faust1994). Across geographical scales of reef governance, the upper network boundary was set at actors operating at a national level, including government departments and national NGOs (or international NGOs operating national programmes). We assumed that direct management from government bodies would occur at the department level (Mahon & McConney Reference Mahon and McConney2004) and communication with other actors in the network would occur primarily through specific departments. The lower network boundary was set at occupational resource user groups at the community level (e.g., groups or associations of reef fishers or marine tourism) that were considered to be representing resource users in reef governance networks. Individual resource users within these groups were not included in the network but were interviewed separately to assess broker performance.
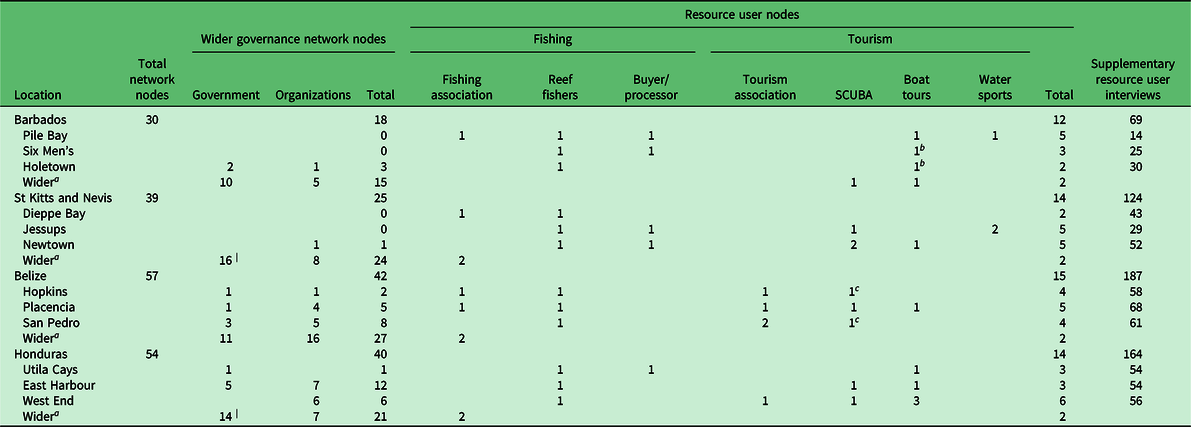
A list of actors within the network boundaries was compiled using grey literature and refined by scoping in each country. Actors included government departments (e.g., fisheries, coastal management, tourism), enforcement agencies, local and international NGOs, academic institutions and organizations representing resource users. Community-level resource user groups included both formally defined groups such as resource user associations and groups of similar resource users without formal organization (Table 1). Each resource user group was treated as a single actor. 30–57 nodes were identified per country (Table 1).
Summary of network size and node types included in the network analysis. Supplementary resource user interviews did not contribute to the social network analysis, but provided data used to assess the performance of brokers.

a Resource user nodes that were not based within a study community but were regular users of the marine environment adjacent to study communities were included as wider resource user nodes. In Honduras and St Kitts and Nevis, these also included island-level actors (7 government actors and 3 organizations in Roatan Municipality, Honduras; 6 government actors and 2 organizations in Nevis, St Kitts and Nevis).
b Users were also regularly involved in water sports.
c Users were also regularly involved in boat tours.
Data collection
Network data were collected between 2011 and 2012 through semi-structured interviews (n = 262). Where necessary, multiple individuals per node were interviewed to capture network links. For example, in informal resource user groups, network data were collected from one or more key representatives. Interviews were recorded and transcribed with permission, or detailed notes were taken; 83–95% of identified actors were interviewed per country. Commonly used metrics are considered robust with an 80% response rate (Borgatti et al. Reference Borgatti, Carley and Krackhardt2006); thus, missing data were not considered problematic.
Networks were based on responses to two interview questions about directed information sharing: (1) ‘Who has received information from your organization about marine resources and their use?’ and (2) ‘Who has your organization received information about marine resources and marine resource use from?’ Questions were directed broadly at ‘marine resources’ after piloting found that interviewees did not necessarily associate the term ‘coral reefs’ with reef-related fisheries or recreational use of reefs. The ‘roster’ method of tie nomination using the list of identified actors as a reference during interviews and a 1-year time window were used to trigger memory during interviews and encourage identification of infrequent interactions (Wasserman & Faust Reference Wasserman and Faust1994).
Binary information-sharing relationships between actors were recorded (present/absent). Data on ties were used to construct one-mode sociomatrices (actor by actor) for each country. For nodes with more than one interviewee, responses were aggregated and coded as binary where ties indicated by at least one interviewee were given the value of 1. The ‘information to’ matrix and the transpose of the ‘information from’ matrix were combined to construct a single, asymmetric (i.e., ties may or may not be reciprocated) sociomatrix for each country (Krackhardt Reference Krackhardt1987). This method preserves the direction of information flow and makes analysis more robust to missing data (Huisman Reference Huisman2009).
Network structure and connectivity
The shape and cohesion of social networks were quantified for context using standard SNA metrics: density, average degree, centralization and fragmentation (Bodin et al. Reference Bodin, Crona and Ernstson2006). To assess whether resource user groups were sharing information with other actor types, the density of information-sharing ties was calculated between three categories of nodes: resource user groups (formal associations and informal groups), organizations (NGOs, universities, national and community associations) and government actors. The latter two groups included actors at multiple levels (Table 1).
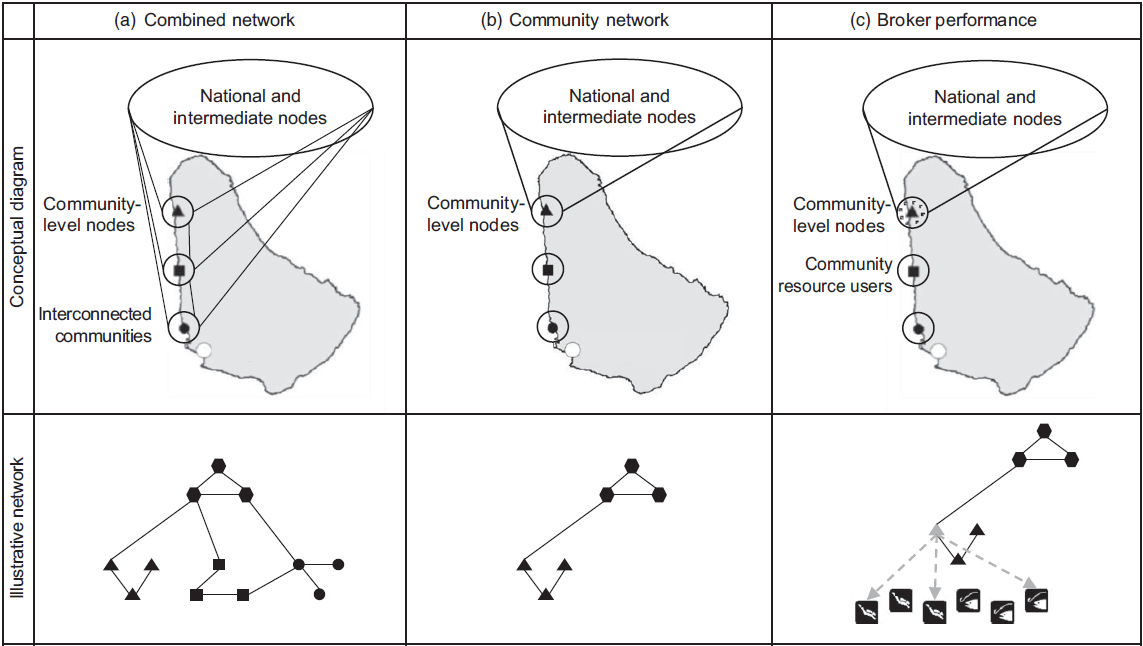
The multi-level nature of the governance networks meant that actors outside each community were typically common to all three community networks in each county. Network metrics were calculated using one combined network for each country that included actors from all three local communities and nodes at the national and intermediate levels (Fig. 1a). Combined networks recognize that horizontal linkages between communities may support information flow, but the inclusion of only three communities per country meant it was beyond the scope of this study to explore these horizontal links (Marín & Berkes Reference Marín and Berkes2010, Ramirez-Sanchez Reference Ramirez-Sanchez, Bodin and Prell2011). Combined networks therefore do not represent whole national networks, but rather illustrate the ways in which selected resource-dependent communities are connected to a wider multi-level governance network. Separate analyses for each community (i.e., 12 networks; Fig. 1b) revealed slightly higher network densities (as the three communities were not well-connected to each other), but otherwise showed similar trends (Table S1). For simplicity, results are presented for the four combined networks.
Conceptual figure showing the governance networks analysed and illustrative social networks: (a) combined network used to calculate overall network structure and connectivity; (b) community network used to identify brokers specific to individual communities; and (c) measure of broker performance obtained by interviewing resource users outside of the network. Hexagons represent nodes in wider governance networks; triangles, squares and circles represent nodes in individual study communities. In (c), the grey node indicates a broker; fish and diver icons represent reef resource users outside of the network; and dashed lines represent information flow reported by resource users.

Identifying brokers
As actors’ roles differ within the highly context-specific networks in this study, the local environment of each actor is expected to best indicate meaningful brokerage. Therefore, although we recognize conceptual advances that explore brokers’ influence on network-level properties (Valente & Fujimoto Reference Valente and Fujimoto2010, Everett & Valente Reference Everett and Valente2016), we adopted Gould and Fernandez’s (Reference Gould and Fernandez1989) approach of understanding brokerage as ‘the number of times an actor is located between two otherwise unconnected actors with different “affiliations”’. To address the first objective of identifying which actors broker reef-related information between coral reef users and wider governance networks, brokerage in each community was calculated between two affiliations: (1) resource user groups; and (2) ‘other actors’ encompassing government actors and organizations (Table 1). Separate analyses were conducted for each community to ensure that brokers specific to communities were identified (Fig. 1b). Any horizontal linkages among communities were incorporated by including resource users from other communities among ‘other actors’. For comparison across different-sized networks, brokerage scores were normalized as a proportion of the maximum possible score for each node.
Observed brokerage at the actor level was tested against a null model (Spiro et al. Reference Spiro, Acton and Butts2013, Bodin et al. Reference Bodin, Robins, McAllister, Guerrero, Crona, Tengö and Lubell2016) in which ties were randomly placed, but network density and affiliation group sizes remained constant, using the sna package in R (Butts Reference Butts2010, R Core Team 2013). This identified nodes that broker more (or less) than expected given a reference model of a network with the same number of ties than the empirically observed network, but no other structuring beyond this, highlighting actors in prominent brokerage positions. Actors in a position to broker information both to and from resource users are referred to as ‘two-way’ brokers, while ‘one-way’ brokers broker information in only one direction. Results are presented in terms of the direction of information sharing with resource users, rather than describing specific brokerage roles in classic network terms (i.e., gatekeeper or representative; Gould & Fernandez Reference Gould and Fernandez1989).
Broker performance
To address the second objective of investigating the information-sharing performance of the brokers, additional semi-structured interviews were conducted with individuals involved in reef-dependent livelihoods (n = 544; Table 1; see Turner et al. Reference Turner, Fitzsimmons, Forster, Mahon, Peterson and Stead2014 for details). Opportunistic and snowball sampling were used to target resource users selected to represent the balance of reef fishing and tourism users in the community. This sample was drawn from individual resource users outside of the lower boundary of the network (Fig. 1c). This enabled an independent measure of information flow from brokers to resource users. Resource users were asked, ‘Who do you receive information about coral reefs from?’
Responses were used as a proxy for the performance of brokers of reef-related information to resource users. We consider performance to be higher where a greater number of resource users outside of the network report receiving information from brokers in the network. Broker performance was calculated for each broker as the percentage of respondents who reported receiving information from them, and Pearson correlations using the Rcmdr package in R (Fox Reference Fox2005) were conducted to test whether brokerage scores were related to broker performance. Our measure of broker performance assumed that brokers to resource user groups in the network also directly brokered information to individual resource users. It is possible that resource user groups acted as additional brokers to convey this information to individual resource users, but it was not possible to examine this within the network boundaries set here.
Results
Network structure and connectivity
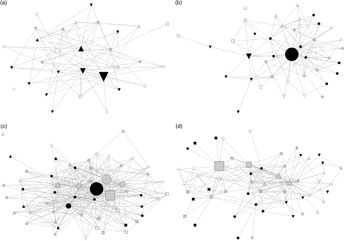
The more populous continental sites of Belize and Honduras had larger networks (57 and 54 nodes) than the smaller island states of Barbados or St Kitts and Nevis (30 and 39) (Fig. 2 & Table S2). Network densities had a small range across the four countries (10–16% of all possible ties). Barbados had the highest network density but the smallest network, with fewer overall ties. Belize had similarly high density and nearly double the network size (Fig. 2c). The St Kitts and Nevis network was highly centralized, with most information sharing focused around a single government actor (Fig. 2b). Honduras had the least cohesive network in terms of both tie density and fragmentation (Table S2).
Social networks of reef-related information sharing with significant two-way brokers identified for (a) Barbados, (b) St Kitts and Nevis, (c) Belize and (d) Honduras. Node shapes indicate location of actor (diamond = predominantly fishing community; square = mixed resource use community; upward triangle = predominantly tourism community; downward triangle = island specific (e.g. Nevis and Roatan); circle = capital or other national centre). Node colour indicates actor type (white = resource users; grey = organizations; black = government). Brokers with a prominent two-way brokering position between resource users and other network actors are indicated by increased node size for each community where they are a prominent two-way broker.

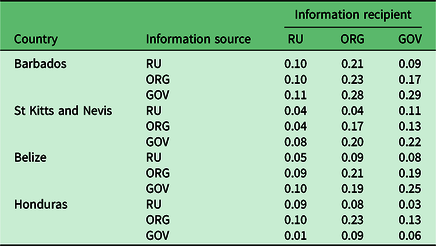
Resource user groups had lower connectivity to other actor types, emphasizing the criticality of brokers to effective information flow (Table 2). Among resource user groups (RU–RU), tie density was lowest in St Kitts and Nevis, increasing through Belize and Honduras to the most connected resource users in Barbados. The results indicate relatively limited information sharing among resource user groups across the three communities in each country. Resource user groups’ connectivities to organizations (RU–ORG) and government actors (RU–GOV) were generally higher (than RU–RU), with the exception of Honduras. Still fewer than 12% of possible information-sharing ties were present in all countries, except for information sharing from Barbadian resource user groups to organizations. Resource user groups’ connectivity to government actors was comparatively low in Honduras. Resource user groups in Barbados and Belize had similar tie densities with both organizations and government, while those in St Kitts and Nevis had a much higher density of ties with government actors. In all countries, tie densities to and from government actors were higher for organizations than resource user groups.
Density of information sharing ties within and between different actor types (n × n tables).

Actor types: RU = resource users; ORG = organizations; GOV = government bodies.
Identifying actors in broker positions
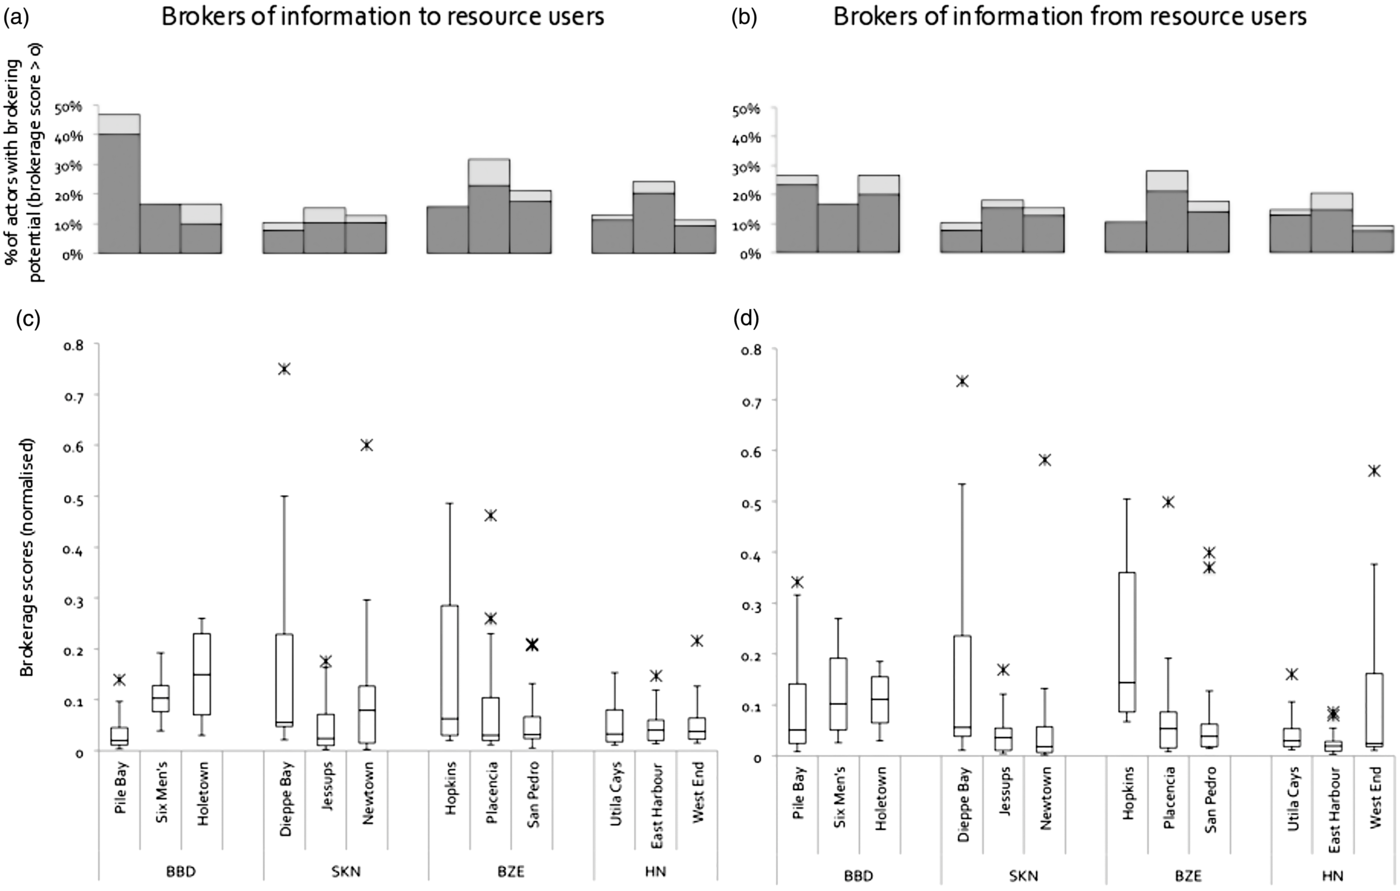
On average, 19% of actors in each country were in a position to broker information to or from resource users (i.e., brokerage score >0; Fig. 3a & 3b). Resource user groups were in potential brokering positions in all communities except Six Men’s (Barbados) and Hopkins (Belize), indicating relationships between resource user groups within communities as well as with actors in wider governance networks.
Potential brokers of information to and from resource users in each community to all other nodes in the wider governance network, and the brokerage scores of these actors. (a & b) Percentage of actors that were potential brokers (brokerage score >0); light grey indicates resource user groups for that community. (c & d) Box plots of brokerage scores for potential brokers (brokerage score >0; normalized by the maximum possible score for each actor) showing the median value (solid bar), interquartile range (box), values within 1.5 box lengths of the upper/lower quartile (whiskers) and outlying values (asterisks). BBD = Barbados; BZE = Belize, HN = Honduras; SKN = St Kitts and Nevis.

Brokerage scores for those in potential brokering positions were similar for information to resource user groups (mean = 0.09, SD = 0.12) and information from resource user groups (mean = 0.10, SD = 0.15), with some outliers having higher brokerage scores (Fig. 3c & 3d). Of the actors with the potential to broker between resource users and other actors, an average of three per community played significant one-way brokering roles compared to null models, while fewer than two per community (mean = 1.92, minimum = 1, maximum = 5) were in significant two-way brokering positions (Table 3).
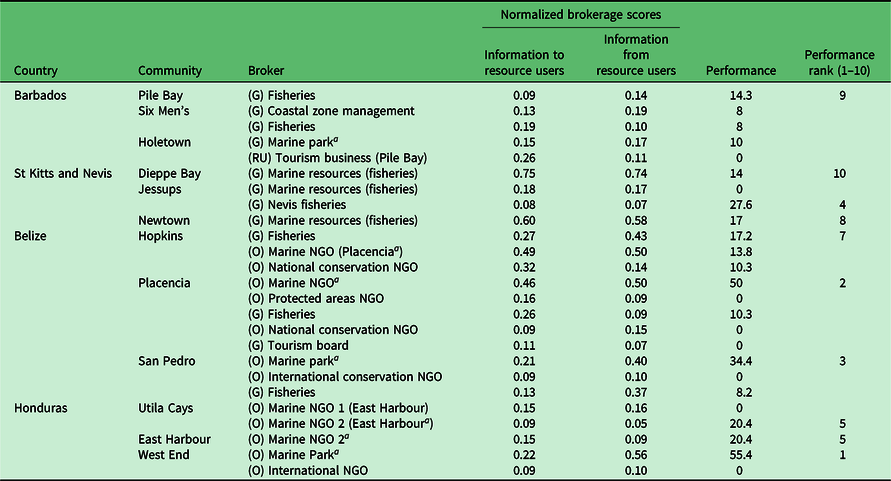
Statistically significant two-way brokers of information between resource users in each community and actors in the wider governance network (normalized brokerage score) and percentages of individual resource users from the community that receive information from each broker (performance). The top 10 brokers by performance are ranked.

a Local reef managers.
NGO = non-governmental organization.
Actors designated by type: G = government; O = organization, educational, project; RU = resource user.
Actors in prominent positions to broker information in two ways for resource user groups varied across the countries. In St Kitts and Nevis and Barbados, brokers were primarily government agencies; in Honduras, they were NGOs; and in Belize, they were both (Table 3). In all communities with a nearby marine protected area (MPA), locally based MPA managers were two-way brokers. Only one resource user group, a tourism business, held a two-way brokering position.
Government actors in brokering roles were primarily those with authority over coastal activities (e.g., fisheries, coastal zone management). Fisheries agencies were one- or two-way brokers in all communities except in Honduras. Government agencies responsible for tourism activities were only two-way brokers in one community (Placencia, Belize).
Broker performance
Resource users identified 40 actors as sources of reef-related information. Over 75% of those identified as information sources by at least 5% of resource users in each community were in one- or two-way brokering positions. Those that did not hold brokering positions were in three categories: (1) a university-affiliated research station in Holetown identified by 7–12% of resource users in Barbados communities; (2) two tourism-related organizations in San Pedro, Belize, identified by 7% and 15% of resource users; and (3) other resource users, identified as a source of information by 7–25% of resource users in all communities except Holetown and Six Men’s, Barbados.
The proportion of individual resource users that received information from brokers was highly variable, and, although the mean was low, several actors functioned as brokers of reef-related information (Table 3). In each community, a two-way broker had the highest performance, and on average nearly a quarter of resource users reported receiving information from them (mean = 0.24, SD = 0.15). On average, 14% of resource users per community received reef-related information from two-way brokers (mean = 0.14, SD = 0.15), while one-way brokers showed lower performance (mean = 0.02, SD = 0.03).
The highest-performing brokers were local co-managing NGOs, notably in Placencia (Belize) and West End (Honduras), where they were identified by >50% of resource users. Of the top ten performing two-way brokers, five were local reef managers and five were government fisheries agencies (Table 3). Brokerage scores were positively correlated with broker performance (from resource users: r = 0.45, p = 0.002; to resource users: r = 0.41, p = 0.004).
Discussion
Effective environmental governance requires the cooperation and participation of resource users and the inclusion of their knowledge in decision-making (Lockwood Reference Lockwood2010). Yet, our findings are consistent with those in other contexts that have found resource users to be poorly connected to wider governance networks (e.g., Ernstson et al. Reference Ernstson, Sorlin and Elmqvist2008, Horning et al. Reference Horning, Bauer and Cohen2016). This multi-country comparison highlights the role of brokers in sharing information between reef user groups and wider governance networks. Overall network structures reflected the nature of different governance arrangements, with island nations having relatively dense networks centralized around government actors, Belize’s high-density network reflecting centralized governance engaged in active co-management with local organizations and the more fragmented network in Honduras indicative of geographically dispersed governance arrangements. The nature of brokering is undoubtedly influenced by these context-specific governance arrangements, yet governance systems are rarely explicitly designed to deliberately position brokers, and actors often assume brokering positions inadvertently (Angst et al. Reference Angst, Widmer, Fischer and Ingold2018). A comparative analysis can help identify how brokerage may manifest across these diverse contexts.
While several actors in each network had the potential to act as information brokers, in comparison to the null model, only one or two per community were prominent two-way brokers. The paucity of brokers may be explained by the diversity and geography of actors in the network. Low brokerage performance overall suggests that many identified brokers were not effectively connecting resource users to wider governance networks. The most common two-way brokers were marine NGOs or government fisheries departments with an explicit mandate for reef management. Consistent with other research, these brokers had some authority, either legislated or informal (Gibbs Reference Gibbs2008, Cohen et al. Reference Cohen, Evans and Mills2012, Horning et al. Reference Horning, Bauer and Cohen2016). In Belize and Honduras, where devolved and co-managed governance arrangements are more prevalent and there are a wider range of governance actors, marine NGOs were the highest-performing brokers. In contrast, in the more centralized, hierarchical governance systems of the small-island states, government fisheries agencies more commonly played a role.
Local marine NGOs as brokers
The highest-performing brokers were local marine NGOs or park managers in communities with MPAs, confirming the importance of local actors as brokers of interactions with resource users (Berkes Reference Berkes2009, Gutiérrez et al. Reference Gutiérrez, Hilborn and Defeo2011). All were involved in MPA management and often had a remit that included community engagement. These actors can act as local decision-making points and can ‘translate’ between levels due to their understanding of local-level challenges and solutions (Berkes Reference Berkes2010, Prager Reference Prager2010). The high-functioning brokers, found in West End, Placencia and San Pedro had noticeable community presence, typically through a combination of outreach, education, signage and involvement with resource user associations. This continuous presence makes cooperation easier to achieve (Berkes Reference Berkes2009, Alexander et al. Reference Alexander, Armitage and Charles2015) and supports a higher frequency of face-to-face interactions that contribute to building trust (Newig & Fritsch Reference Newig and Fritsch2009). While these actors were effective brokers, the more precarious nature of NGO funding means that these roles may be more easily disrupted than those of more permanent government organizations, potentially making networks vulnerable to their exit (Hileman et al. Reference Hileman, Bastos and Lubell2018).
Although marine NGOs were commonly effective brokers, neither geographical proximity to resource users nor a mandate for reef management guaranteed effective brokerage. For example, two local MPA managers in East Harbour and Holetown were not sources of information for resource users, despite occupying brokerage positions. Their organizations had considerably lower community presence than other reef managers, and interviews raised issues of a lack of trust from resource users, attributed to limited involvement of reef users in management decisions and inconsistent enforcement and sanctions for rule-breaking. In East Harbour, trust has also been hampered by changes in staff and a period of dormancy for the co-management organization. In Holetown, the large size and diversity of the community may be a challenge to establishing and maintaining strong relations with resource users (Krackhardt Reference Krackhardt, Cross, Parker and Sasson2003).
Government fisheries agencies as brokers
Fisheries agencies were the second most common actor type among the best-performing brokers and had the highest performance in communities without nearby MPAs. While fisheries agencies may not be responsible for all stakeholder outreach (e.g., those in reef-related tourism), in all but one of the communities, over 73% of resource users participated in reef fisheries. These findings are consistent with research suggesting that fisheries agencies often play a role in connecting national and subnational levels in fisheries and coastal governance (Gibbs Reference Gibbs2008, Cohen et al. Reference Cohen, Evans and Mills2012). However, with the exception of one community (Jessups, Nevis), brokerage performance indicated that fisheries agencies were not effectively sharing information with the majority of resource users.
Several factors may help explain these low performance scores. With the exception of island-level administration in Nevis, fisheries agencies were national government agencies without dedicated extension offices, which may reflect the challenges of national governments establishing vertical connections with local communities (Prager Reference Prager2010, Vignola et al. Reference Vignola, McDaniels and Scholz2013). Honduras was an extreme case where no government actors were identified as brokers or reported by individual resource users as sources of information. The feeling of separation between the Bay Islands (200 km from the capital) and the mainland is not exclusive to reef governance. Challenges include geographical distance, different economic priorities and language (Honduras is Spanish speaking, but the Bay Islands are English speaking). In island countries, it might be expected that small size could offset some of the distance between resource users and national agencies, both in terms of physical distance and common perspectives. There is some indication of this between the Nevis Fisheries Department and resource users in Jessups, yet fisheries agencies’ performance was much lower in the other island nation communities. Furthermore, fisheries departments have frequently focused on hiring technical staff with a biology background rather than staff with outreach or communication skills (Mahon & McConney Reference Mahon, McConney and Cheunpagdee2011).
Incorporating multiple resource users
Reef-related tourism is important to Caribbean economies, yet official tourism actors were only in significant brokering positions in two communities and their performance was low. Tourism agencies seldom have a formal role in reef-related information sharing. However, tourism actors often have more national-level influence than other local actors (Breton & Davy 2006). The lack of tourism brokers may not matter in communities with local marine NGOs who broker information, and may even preferentially target outreach in tourism-focused communities (Rathwell & Peterson Reference Rathwell and Peterson2012). However, where fisheries agencies are the dominant source of reef-related information, the lack of tourism-related brokers may lead to network gaps.
Limited ‘bottom-up’ brokerage
While not identified in this study, resource user associations, community councils or other civil society organizations could act as ‘bottom-up’ brokers, which are common in customary management and tenure systems (Gelcich et al. Reference Gelcich, Hughes, Olsson, Folke, Defeo and Fernandez2010, Ruddle & Davis Reference Ruddle and Davis2013). Brokers other than local NGOs and fisheries agencies exhibited particularly low performance. NGOs without formal reef management roles were in two-way brokering positions in five communities, but were only cited as an information source in one community. Resource user associations generally had weak membership, were dormant or non-functioning or did not seek to represent their users in governance processes. One exception was the tour guide association in San Pedro, Belize. Although this association was not a broker according to our parameters, it was identified as an information source by almost 15% of resource users. Interviews indicated that it facilitated the strong brokering role of the local MPA manager (which was well-connected to the wider governance network) by creating a focal point for interaction and on-the-ground action (Prager Reference Prager2010). This example emphasizes that local brokers connecting resource users may provide important points of contact in multi-level governance networks. Furthermore, such local connections among resource users associated with the same environmental resources are likely to be conducive to positive ecological outcomes (Barnes et al. Reference Barnes, Bodin, McClanahan, Kittinger, Hoey, Gaoue and Graham2019).
Limitations
The identification of significant brokers in this study relied on a high brokering score by comparison with a null model. This approach has limitations in that it discounts ties that fall within the range of those randomly generated by the null model. While network ties are arguably inherently non-random because of contextual factors, comparison to null models of the same size and connectivity to the networks studied allowed us to more consistently highlight actors in prominent brokerage positions across diverse networks (Bodin et al. Reference Bodin, Robins, McAllister, Guerrero, Crona, Tengö and Lubell2016). Furthermore, our approach did not identify nodes connecting a small number of actors that may be important for network function (Valente & Fujimoto Reference Valente and Fujimoto2010). Nor did it take advantage of more dynamic conceptualizations of these roles (Spiro et al. Reference Spiro, Acton and Butts2013). More recent developments may offer more subtle insights into brokerage (Everett & Valente Reference Everett and Valente2016).
Critically, this research did not measure the type, quality or timeliness of information communicated to resource users. Nor did it measure the function of the brokers carrying information from resource users to decision-makers, which can bring local ecological knowledge, and corresponding benefits, into decision-making (Mackinson & Nøttestad Reference Mackinson and Nøttestad1998). Although we anticipate that two-way information flow is likely to be beneficial in engaging stakeholders, expected improvements in governance quality remain hypothetical. Furthermore, multiple one-way brokers may be equally effective, and perhaps reduce the vulnerability of the network to the removal of bridging actors (Hileman et al. Reference Hileman, Bastos and Lubell2018). Future research into the type and quality of brokering relationships would further our understanding of the nuances of network brokerage and the role of these relationships in formal resource governance processes. Nevertheless, this study represents a first attempt to empirically examine whether actors in prominent brokerage position are actively brokering information flow between resource users and governance actors.
Conclusions
Brokers are expected to facilitate the participation of local stakeholders in wider governance processes by connecting them to those making or informing decisions, laws and policy. We found that resource users were not well-connected to wider governance networks, but network analyses confirmed the presence of brokers, such as local MPA managers and fisheries agencies, who facilitated resource user access to information about coral reefs. The most effective brokers were marine NGOs located within communities. Information seldom flowed in both directions, potentially limiting the quality and extent of resource user participation in coral reef governance.
Reliance on government actors alone was insufficient for effective brokerage between resource users and the wider network. Consequently, national agencies may rely more on NGOs and other local actors to facilitate effective governance than is typical for formal governance arrangements. Efforts to improve governance networks in order to achieve effective information exchange that supports stakeholder engagement could include promoting broker legitimacy and credibility and addressing financial and legal constraints to working with resource users. In the absence of local MPA managers or strong local institutions, government agencies should take on the challenge of inclusively engaging resource users. This may involve efforts to build local institutions and capacity for self-organization while institutionalizing the participation of these actors. There are dangers that the removal of broker from the network or the loss of legitimacy of a broker could have adverse outcomes on governance; therefore, strategies to deliberately create brokers should proceed with caution. Yet, given that broker positions are often inadvertent, we contend that identifying and supporting critical brokers in their roles connecting local resource users to wider governance networks could encourage functional brokerage and wider benefits to natural resource governance.
Supplementary material
To view supplementary material for this article, please visit https://doi.org/10.1017/S0376892920000351
Acknowledgements
We would like to thank all of the participants who kindly gave their time for interviews and to the numerous partners and collaborators in each country who supported the research team: D Gill, M Phillips, R Ford, S Bonilla, S Brune, S Gardiner, J Pollock, L Chicas and C Guerrero. Thanks to three anonymous reviewers whose comments greatly improved the paper.
Financial support
The research was supported by funding from the European Union 7th Framework programme (P7/2007-2013) under grant agreement No. 244161.
Conflict of interest
None.
Ethical standards
None.