Introduction
Driving is a highly complex task that draws on a variety of visual, motor, and cognitive skills (McKenna, Reference McKenna1998; Meyers et al., Reference Meyers, Volbrecht and Kaster Bundgaard1999; Lundqvist et al., Reference Lundqvist, Gerdle and Ronnberg2000; Stutts and Wilkins, Reference Stutts and Wilkins2003; Anstey et al., Reference Anstey, Wood, Lord and Walker2005). Indeed, crash rates and driving performance are known to be affected by a number of visual problems (e.g. untreated cataracts, reduced visual acuity and contrast sensitivity, visual field loss), medical conditions (e.g. cardiovascular disease, diabetes), neurological disorders (e.g. Alzheimer's disease, Parkinson's disease, stroke), and the use of certain medications (e.g. benzodiazepines, analgesics), all of which become more prevalent with age (for reviews, see Vaa, Reference Vaa2003; Baldock, Reference Baldock2004; Dobbs, Reference Dobbs2005). In contrast, very few physical problems have been shown to affect driving, with limitations in head-neck flexibility being one factor that does impact on driving ability (Baldock, Reference Baldock2004). Intact cognitive abilities are also important to driving as they enable a person to process multiple simultaneous environmental cues in order to make rapid, accurate and safe decisions when driving (Galski et al., Reference Galski, Bruno and Ehle1992). Those impairments in cognitive functioning that have the potential to affect driving performance adversely in the elderly are the focus of this study.
Age-related changes in cognitive functioning, combined with a higher rate of motor vehicle accidents per kilometer driven in drivers aged over 55 years, have raised concerns about the driving abilities of older individuals (Marottoli, Reference Marottoli1993; Baldock et al., Reference Baldock, Mathias, Kloeden and McLean2002; Braver, Reference Braver2004). Moreover, these concerns are likely to intensify due to a maturing generation of baby boomers whose life-span is increasing (Kippen, Reference Kippen2002). While continued mobility is an important issue for older drivers, the rights of the broader community to protection from actual or potentially dangerous drivers must also be considered (Fox et al., Reference Fox, Bowden, Bashford and Smith1997). The driving abilities of older drivers therefore need to be assessed using cost-effective and accurate methods that provide clear standards for identifying potentially unsafe drivers. Chronological age in itself is a poor indicator of driving competence due to individual differences in functional ability, driving experience, and self-regulatory driving practices (Waller, Reference Waller1991; Ball et al., Reference *Ball, Owsley, Sloane, Roenker and Bruni1993; Smither et al., Reference Smither, Mouloua, Hancock, Duley, Adams, Latorella, Vincenzi, Mouloua and Hancock2004). Thus, an age-based criterion is inadequate for identifying individuals whose driving competence may be in question. Alternatively, age-related changes in cognitive ability, including changes in information processing speed, attention and memory, may provide better predictors of driving ability (Colsher and Wallace, Reference Colsher and Wallace1993; Levy et al., Reference Levy, Vernick and Howard1995; Mouloua et al., Reference Mouloua, Smither, Hancock, Duley, Adams, Latorella, Vincenzi, Mouloua and Hancock2004).
The legal regulations governing license renewal in older drivers, together with the responsibilities of medical practitioners to identify unsafe drivers, vary considerably both between and within countries (White and O'Neill, Reference White and O'Neill2000). While Australia has established some guidelines to assist clinicians in assessing driving competence in order to identify potentially unsafe drivers (Austroads, 2003), these guidelines are relatively general and do not recommend specific tools for assessing driving competence. Consequently, there is no uniform approach to license reassessment in Australia (Langford et al., Reference Langford, Fitzharris, Newstead and Koppel2004b). With the exception of Victoria, all Australian states require age-based medical (e.g. basic visual and motor evaluations) and on-road driving assessments; however, the age at which these mandatory medical and driving assessments commence varies. For example, mandatory medical assessments may be deemed necessary from the age of 70 (South Australia), 75 (Tasmania, Queensland, Western Australia) or 80 (New South Wales), and on an annual basis (e.g. in New South Wales, South Australia, Tasmania, and for those aged over 80 in Western Australia) or a 5-yearly basis (e.g. in Queensland, and for those aged 75–80 in Western Australia). Similarly, on-road tests may not be mandated (Victoria), or may be undertaken when recommended by a medical practitioner (South Australia, Queensland) or, in some states, on an annual basis for those aged 85 and over (New South Wales, Tasmania, Western Australia). Importantly, neither the age at which these medical or on-road assessments commence, nor the procedures by which relicensing decisions are made, are evidence-based. Moreover, these problems are not specific to Australia (White and O'Neil, Reference White and O'Neill2000; Grabowski et al., Reference Grabowski, Campbell and Morrisey2004).
In the absence of standardized driver assessment procedures, licensing decisions in Australia are largely made by medical practitioners despite limitations in the ability of standard medical examinations to identify individuals who may be unsafe drivers (Bédard and Molloy, Reference Bédard and Molloy1997). Moreover, medical practitioners rarely undergo specific training or have the time to undertake a comprehensive driver evaluation (Kakaiya et al., Reference Kakaiya, Tisovec and Fulkerson2000; Bogner et al., Reference Bogner, Straton, Gallo, Rebok and Keyl2004) and may face a conflict of interest knowing that patients who have to undergo mandatory assessments can “shop around” until they find another medical practitioner who is willing to sign an application for re-licensing. Consequently, driving instructors, occupational therapists and psychologists are also often required to undertake assessments of driving ability (Heikkila and Kallanranta, Reference Heikkila and Kallanranta2005). However, at present, there are no adequate evidence-based national, state or professional standards to guide driving assessments, forcing independent attempts to develop tests and guidelines for this purpose (Lee et al., Reference Lee, Drake and Cameron2002; Unsworth et al., Reference Unsworth, Lovell, Terrington and Thomas2005).
Driving assessments currently include on-road assessments of driving ability in real traffic or on a protected course (closed-circuit), the assessment of driving ability using a driving simulator, and/or cognitive evaluations (Galski et al., Reference Galski, Ehle, McDonald and Mackevich2000). There is an ongoing debate regarding the best measure of driving ability (Huchler et al., Reference Huchler2001; Lee et al., Reference Lee, Drake and Cameron2002). On-road driving assessments are often considered to be the “gold-standard” for assessing driving competence as they measure both the basic operational and cognitive aspects of driving (Meyers et al., Reference Meyers, Volbrecht and Kaster Bundgaard1999). Nevertheless, they are sometimes also criticized because there is a lack of objective, reliable and valid procedures for assessing on-road driving competence (Lee et al., Reference Lee, Cameron and Lee2003). When combined with the financial and time costs associated with on-road assessments, these factors limit their widespread use. In addition, consideration must be given to public safety if a potentially unsafe driver is allowed to operate a vehicle during an on-road test (Stutts and Wilkins, Reference Stutts and Wilkins2003). Closed-circuit assessments of driving ability and driving simulators have therefore been developed as alternatives to on-road tests (Odenheimer et al., Reference Odenheimer, Beaudet, Jette, Albert, Grande and Minaker1994). Although permitting an evaluation of many operational skills, closed-circuit assessments are conducted in the absence of other motorists and may not, therefore, adequately emulate the level of complexity experienced in an open traffic situation (Fox et al., Reference Fox, Bowden and Smith1998). The use of driving simulators, on the other hand, assumes that the driving conditions created by simulators closely approximate actual behind-the-wheel driving experiences and situations (Galski et al., Reference Galski, Ehle and Williams1997). However, driving simulators may disadvantage older drivers who are likely to be less experienced with computerized stimuli and who have declining visual abilities that are less able to cope with two-dimensional reconstructions of three-dimensional stimuli. Due to the limited availability of reliable norms and empirical evidence to confirm the diagnostic utility of closed-road and simulator driving assessments, on-road assessments are often thought to be the most reliable measure of driving competence (Keall and Frith, Reference Keall and Frith2004). However, on-road driving assessments are impractical on a large scale, thereby highlighting the need for cognitive tests to identify drivers who may need a more thorough driving assessment.
A number of screening batteries have been developed to assess age-related changes in the cognitive functions that may affect driving (Marottoli et al., Reference *Marottoli1998; De Raedt and Ponjaert-Kristoffersen, Reference De Raedt and Ponjaert-Kristoffersen2001; Szlyk et al., Reference Szlyk, Myers, Zhang, Wetzel and Shapiro2002). While most would agree that re-licensing decisions should not be based on cognitive tests alone (Withaar et al., Reference Withaar, Brouwer and van Zomeren2000; Brooks and Hawley, Reference Brooks and Hawley2005), they have the potential to identify individuals who require on-road testing before re-licensing decisions are made (McKenna et al., Reference McKenna, Jefferies, Dobson and Frude2004). Cognitive testing can also provide useful additional information, as some cognitive deficits may not be obvious in an on-road driving assessment, especially if the driving environment and route is familiar to the person being assessed (Anstey et al., Reference Anstey, Wood, Lord and Walker2005). While evidence-based cognitive testing has the potential to provide a cost-effective strategy by which to identify drivers who need to undergo comprehensive driving assessments, there is currently no agreement about which cognitive abilities should be assessed and what tests should be used to assess them.
Recent research has found that a number of commonly used cognitive tests (e.g. Trail Making Test, Rey Complex Figure Task, WAIS subtests) are associated with on-road driving ability (De Raedt and Ponjaert-Kristoffersen, Reference *De Raedt and Ponjaert-Kristoffersen2000; Schanke and Sundet, Reference Schanke and Sundet2000; Whelihan et al., Reference *Whelihan, DiCarlo and Paul2005). However, the research findings are inconsistent and, consequently, no single test or combination of tests has been identified as successfully discriminating between safe and unsafe drivers. Although numerous narrative reviews have been undertaken (Colsher and Wallace, Reference Colsher and Wallace1993; Mazer et al., Reference Mazer, Gelinas and Benoit2004; Bieliauskas, Reference Bieliauskas2005; Tamietto et al., Reference Tamietto, Torrini, Adenzato, Pietrapiana, Rago and Perino2006), these reviews do not adequately consolidate or analyze the data from these different studies. A meta-analysis, in contrast, provides an objective and quantitative means by which to compare directly the findings of all existing studies, even when they have used different cognitive tests, thereby providing an important addition to the current literature (Hedges and Cooper, Reference Hedges and Cooper1994; Rosenthal and DiMatteo, Reference Rosenthal and DiMatteo2001). The current study therefore undertook a meta-analytic review of all existing research that has compared the cognitive performance of drivers from the general community who either passed or failed a driving assessment (on-road or driving simulator) or whose recent crash history enabled them to be divided into pass/fail drivers (e.g. based on accidents or license suspension) in order to identify cognitive tests that may be suitable for screening individuals in need of a comprehensive assessment of driving ability.
Method
Literature search and inclusion criteria
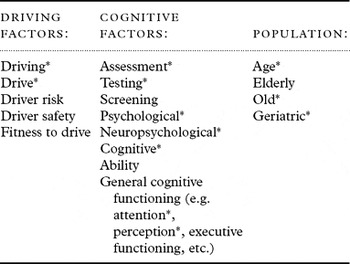
A comprehensive search was undertaken of the PubMed, PsycINFO, Cumulative Index of Nursing and Allied Health Literature (CINAHL), and Health-Source Nursing electronic databases in order to identify studies between January 1980 and December 2007 that examined the relationship between cognitive testing and driving competence in drivers over the age of 55 years. The initial search was broad in order to avoid missing potentially relevant papers (White, Reference White, Cooper and Hedges1994). The search terms are listed in Table 1.
Key search terms

Note: All studies needed at least one search term from each of the three major descriptors.
*Searches included stated terms and derivatives (e.g. age, aging, aged).
For a study to be included in the current meta-analysis, it had to meet the following criteria: (1) it was published in a journal and in English; (2) it was not a case study; (3) participants were aged 55 years and over (where age ranges were not reported, a study was deemed eligible if the mean age minus 1 SD was ≥ 55 years); (4) participants were from the general community and had not been diagnosed with dementia; (5) driving ability was evaluated via an on-road driving assessment, using a driving simulator, or based on driving problems (e.g. crash history); (6) drivers were classified as either pass or fail on the basis of these assessments; (7) standardized cognitive tests were additionally administered (studies that only used visual or motor tests were excluded for current purposes); and (8) data that enabled the calculation of effect sizes were provided (e.g. means and standard deviations, correlations, F ratio from a one-way ANOVA).
The literature search initially identified 2,349 studies. A preliminary application of the inclusion criteria to the information provided in the titles and abstracts of these articles yielded a total of 158 potentially relevant studies, which were then retrieved. Application of the inclusion criteria to the full text versions of these studies revealed that 136 of these did not meet one or more of the inclusion criteria, leaving 22 studies. However, the data from two studies (Ball et al., Reference *Ball, Owsley, Sloane, Roenker and Bruni1993; Goode et al., Reference *Goode1998) were combined and treated as one study because they used overlapping samples, thereby ensuring the independence of the data from different studies. Thus, in total, the data from 21 studies were analyzed. In addition, one study by DeRaedt and Ponjaert-Kristoffersen (Reference *De Raedt and Ponjaert-Kristoffersen2000) assessed driving ability using both on-road driving ability and driving problems.
Data collection and transformation of variables
The following information was recorded for each study: (1) study details (identification number, author, year); (2) demographic information (Nparticipants, age, gender, education, Mini-mental State Examination (MMSE) score, years of driving experience); (3) methodological variables (source of participants, whether driving and cognitive assessments were blinded, interval between cognitive and driving tests); (4) cognitive tests (cognitive domain, test/sub-test, score, direction of scoring); and (5) driving assessments (on-road/driving simulator/driving problems, score type (total correct, errors, speed), criteria for classifying pass/fail drivers). Data relating to the cognitive performance of the groups of drivers who passed and failed their driving assessments were then extracted from each study. Similar tests that assessed the same cognitive construct were combined across studies to simplify data presentation (e.g. letter and number cancellation tests were combined). Tests were classified into broad cognitive domains (e.g. perception, attention, memory) according to the descriptions given by Lezak et al. (Reference Lezak, Howieson, Loring, Hannay and Fisher2004), Strauss et al. (Reference Strauss, Sherman and Spreen2006), or the study's authors to assist data presentation and interpretation.
Effect size calculation and data analysis
Cohen's d effect sizes, which measure the standardized mean difference between two groups, were calculated using the method described by Zakzanis (Reference Zakzanis2001). For the current analysis, groups were defined on the basis of passing or failing some form of driver assessment (i.e. on-road or closed-circuit driving assessment, driving simulator test, or documented driving problems) and effect sizes were calculated to measure differences in the performance of these two groups on a variety of cognitive tests. The data for the different types of driving assessments (i.e. on-road/closed-circuit, driving simulator, driving problems) were analyzed and reported separately because they measure slightly different skills and cannot be assumed to measure actual driving ability with equal reliability and validity. While meta-analyses sometimes only report effect sizes calculated from multiple studies that have used the same measures due to the wide variation in cognitive tests used and the limited number of studies that have been undertaken, the current meta-analysis additionally reports effect sizes from single studies. This was done in order to identify tools that appear to discriminate between groups and are worthy of further consideration (Rosenthal and DiMatteo, Reference Rosenthal and DiMatteo2001).
Where means and standard deviations were not provided by a study, t values, one-way F statistics and correlation coefficients were converted to d. Probability values were not used to calculate effect sizes as they confound the magnitude of an effect size with sample size (Hunter et al., Reference Hunter, Schmidt and Jackson1982), such that a p < 0.05 may overestimate an effect size in a large sample and a non-significant result that is assigned a p > 0.05 may systematically underestimate the size of an effect in a small sample (Rosenthal, Reference Rosenthal1995).
Effect sizes were calculated in a multi-stage process. The first stage involved calculating effect sizes for each cognitive test that was used by a study. If a study provided multiple scores for a test, and these were going to be combined for the purposes of this meta-analysis, an average effect size was calculated for that test. The effect sizes obtained from different studies using the same cognitive tests were then averaged in order to evaluate the combined findings. As the reliability of an effect size is affected by the size of the sample from which it is derived, it is important to weight effect sizes before they are combined and averaged (Lipsey and Wilson, Reference Lipsey and Wilson2001). While weighting by sample size is one option, Hedges and Olkin (Reference Hedges and Olkin1985) argue that weighting by the inverse variance (i.e. the inverse of the squared standard error) is preferable because it provides a better measure of the precision of an effect size (i.e. larger standard errors are associated with less precise effect sizes). An overall weighted mean effect size (dw) for a test was therefore calculated by weighting the effect size from each individual study by the inverse of its variance and then obtaining an average.
All effect sizes were calculated in such a way that a positive Cohen's dw indicated that persons who passed the driving assessment performed better on the cognitive tests than those who failed. Using Cohen's criteria (Cohen, Reference Cohen1992), a small effect was defined as d ≥ 0.2, a moderate effect as d ≥ 0.5, and a large effect as d ≥ 0.8. To put this into perspective, a medium effect size of 0.5 indicates that the means of the two groups differ by half of a pooled standard deviation. A percentage overlap (%OL) score was also calculated in order to measure the extent to which the cognitive performance of the two groups (pass/fail drivers) overlap. The %OL is inversely related to an effect size and was calculated using the table provided by Zakzanis et al. (Reference Zakzanis, Leach and Kaplan1999). An effect size of zero (d = 0) is associated with 100% overlap in the scores of the two groups, while an effect size of 4.00 is associated with only 2.3% overlap in scores, indicating that the groups perform very differently on that measure; 95% confidence intervals (CIs) for the effect sizes were additionally calculated using the method described by Lipsey and Wilson (Reference Lipsey and Wilson2001) in order to evaluate statistical significance. It can be concluded that the true population effect size differs from zero when the confidence interval does not span zero, suggesting that there is a significant difference between the cognitive performance of those who pass the driving test (on-road/closed-circuit, driving simulator, or driving problems) and those who do not.
In addition, fail-safe N (Nfs) statistics were calculated in order to address a common criticism of meta-analytic procedures, namely the problem of “publication bias” (Zakzanis, Reference Zakzanis2001), which results from the tendency to publish statistically significant research findings. The Nfs statistic estimates the number of unpublished studies with non-significant findings (i.e. small effect, d = 0.2) that would have to exist in “file drawers” in order to call the current findings into question and was calculated using the formula provided by Lipsey and Wilson (Reference Lipsey and Wilson2001). The larger the Nfs statistic, the more confident we can be in the current findings.
Finally, it was intended that the impact of methodological differences between studies on effect sizes would be examined using moderator variable analyses (Rosenthal and DiMatteo, Reference Rosenthal and DiMatteo2001). Specifically, between-study differences in age, education, driving experience and general cognitive status (MMSE) were to be examined in order to determine whether these variables influenced the magnitude of the cognitive differences of drivers who passed or failed a driving assessment. However, education level was only provided for five studies, driver experience for three studies and MMSE scores for two studies, therefore precluding an analysis of these variables. The remaining variable, age, was examined by correlating it with the mean effect size for the studies that reported this data.
Data interpretation
Weighted mean effect sizes (SD) were calculated for the 75 cognitive tests and subtests that were examined in this meta-analysis, as were %OL, 95% CIs and Nfs. The conclusions drawn from this study are based on the combined interpretation of these statistics. From a screening perspective, a clinician would be more confident that a particular cognitive function discriminates between those who pass and those who fail a driving assessment when there are large group differences (Cohen's dw) and, consequently, there is limited overlap in the performance of the two groups (%OL). Clinicians would also be more confident in using a measure to assess the driving competence of older adults if the 95% CI did not span zero (i.e. the effect size is statistically significant) and it was unlikely that unpublished findings with non-significant findings (i.e. small effects) could draw the current findings into question (as measured by the Nfs statistic). For the purpose of this meta-analysis, it was decided that, in order for a cognitive test to be used to screen older drivers, it must meet the following three criteria: (i) have a large effect size (i.e. d ≥ 0.8), (ii) have a confidence interval that did not span zero (note that CIs are affected by N and variance), and (iii) have a Nfs score that was large enough to make it unlikely that there were that number of unpublished studies with non-significant findings in existence. As different tests were used with varying frequency, it was decided that the Nfs should at least be greater than the number of published studies that had used a particular test (i.e. Nfs > Nstudies).
Results
Demographics
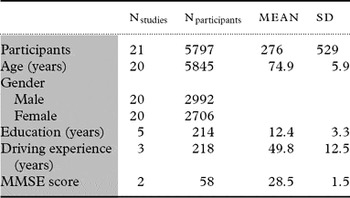
Twenty-one studies contributed to the current meta-analysis, comprising a total sample of 5,797 participants. Demographic data, including age, gender, and years of education and driving experience, are provided in Table 2. The majority of studies recruited participants from the general community (Nstudies = 14) or those referred for a driving assessment by their medical practitioner (Nstudies = 5), while a small number of studies recruited individuals at the time of their license renewal (Nstudies = 2). The person conducting the driving assessment was blind to the results of the cognitive tests in 14 studies. The remaining seven studies did not report this information. Seven studies assessed driving ability using an on-road driving assessment, three used driving simulators, and 12 used driving problems to classify driving ability into pass and fail categories.
Demographic details for the meta-analysis participants

Nstudies = number of studies providing data; Npartcipants = number of participants providing data; SD = standard deviation; MMSE = Mini-mental State Examination.
On-road driving assessments
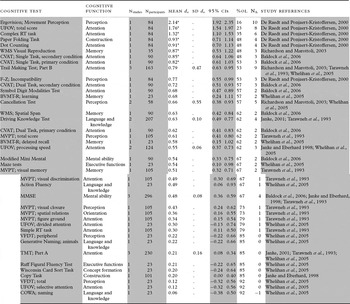
The weighted effect sizes for the cognitive predictors of on-road driving performance (mean dw, SD, 95% CIs, %OL, Nfs), rank ordered by effect size, are provided in Table 3. The seven studies that used on-road driving assessments to determine driving ability used samples that ranged in size from 23 to 105 participants. These studies used 25 different cognitive tests, which yielded 40 test scores (i.e. some tests provided multiple measures).
Cohen's d effect sizes for cognitive tests administered to drivers who passed/failed an on-road driving test

Nstudies = number of studies contributing to the effect size; Nparticipants = total number of participants; M dw = weighted mean effect size; SD dw = standard deviation of the effect size; 95% CI = 95% confidence intervals; OL% = percentage overlap between pass and fail groups; Nfs = Fail safe N; UFOV = Useful Field of View Test; RT = Reaction Time; WMS = Wechlser Memory Scale; CVAT = Computerized Visual Attention Test; TMT = Trail Making Test; F-Z = Fimm Zimmerman Test Battery; BVMT = Brief Visual Memory Test; MVPT = Motor Free Visual Perception Test; MMSE = Mini-mental State Examination; VFDT = Visual Form Discrimination Test.
*Effect size met the study criteria; d > 0.8, Nfs > Nstudies, 95% CIs did not span zero.
A range of measures that assess information processing speed and attention, memory, perception, knowledge, concept formation, mental ability and executive functioning were used by these studies. Attention was the most commonly assessed cognitive function, followed by perception, memory, language and general knowledge. The most commonly used tests were the MMSE and Trail Making Test (Parts A and B), both of which were used by three studies. The remaining cognitive tests were only used by one or two studies. All effects were positive which indicates that persons who failed an on-road driving test performed more poorly on the cognitive tests than those who passed. These effect sizes ranged from very small (dw = 0.06) for a word fluency task (Controlled Oral Word Association test: COWA), to very large (dw = 2.14) for a motion detection test (Ergovision Movement Perception), suggesting that there is enormous variability in the extent to which these measures are able to discriminate between those who passed or failed an on-road driving test.
Of the tests that were used by more than one study, there were no measures that met the criteria for a large effect (dw > 0.8). However, there was one measure (TMT, Part B) that demonstrated relatively large (dw = 0.79) and significant (95% CIs) differences between those who passed or failed an on-road driving assessment, together with a Nfs statistic that suggests a high degree of confidence in this finding. Instead, the most discriminating tests were amongst those used by only one study. Eight measures had large to very large and significant effects and good Nfs statistics (Ergovision Movement Perception Test; Useful Field of View overall score; a Complex Reaction Time Task, Paper Folding Task, Dot Counting, Wechsler Memory Scale: WMS Visual Reproduction, Computerized Visual Attention Test: CVAT Single Task secondary and primary conditions). In particular, the performance on the Ergovision Motion Detection Test for those who passed or failed the on-road driving assessment differed by more than two standard deviations, suggesting that this measure of perceptual ability may be particularly suited to differentiating between those who are likely to pass or fail an on-road driving assessment. Similarly, performance on the UFOV test (total score), which is a measure of attention specifically designed for use in driver evaluations, and to a lesser extent complex reaction times, differed by very large amounts, again suggesting that these are discriminating measures. Notably, the individual subscores of the UFOV (e.g. Processing Speed, Divided Attention) were less successful in discriminating between pass/fail drivers than the full test, detecting only small to moderate differences between pass/fail drivers. Finally, drivers who failed the on-road assessment also showed poorer average performance on a Paper Folding Task, Dot Counting Task, and Visual Reproduction subtest of the WMS, and two subtests of the CVAT, also indicating that these tests may provide useful screening tools.
Interestingly, the MMSE (and a modification of it), which is a highly accessible measure of general mental ability that is frequently used by medical practitioners for a variety of purposes, showed only moderate discriminative ability, possibly reflecting the fact that the average score on this test was in the upper range. A test of driving knowledge (e.g. traffic sign recognition) appeared to be equally effective as the MMSE for discriminating between pass/fail drivers.
Overall, these results suggest that there are three tests that detect a very large and significant decline in motion detection (Ergovision Movement Perception), attention (UFOV) and information processing speed (complex reaction times) in drivers who are deemed to be unfit to drive on the basis of an on-road driving assessment. An additional five measures detect large declines in construction (Paper Folding), attention (Dot Counting, two CVAT subtests) and immediate memory (WMS Visual Reproduction), amongst those who fail an on-road test.
Driving simulator assessments
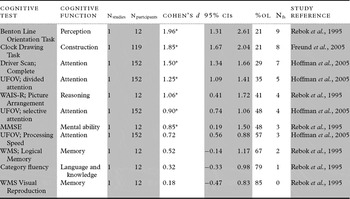
In total, there were only three studies that used driving simulators to determine driving competence using samples that ranged in size between 12 and 152 participants. A total of eight tests yielding 11 scores were used by these studies. The weighted effect sizes for these studies are provided in Table 4 (mean dw, SD, 95% CIs, %OL, Nfs).
Cohen's d effect sizes for cognitive tests administered to drivers who passed/failed a simulator driving test

Note: Nstudies = number of studies contributing to the effect size; Nparticipants = total number of participants; d = effect size; SD d = standard deviation of the effect size; 95% CI = 95% confidence intervals; OL% = percentage overlap between pass and fail groups; Nfs = Fail safe N; MMSE = Mini-mental State Examination; UFOV = Useful Field of View; WAIS = Wechsler Adult Intelligence Scale; F-Z = Fimm Zimmerman Test Battery; BVMT = Brief Visual Memory Test.
* Effect size met the study criteria; d > 0.8, Nfs > Nstudies, 95% CIs did not span zero.
Once again, attention was the most frequently assessed cognitive function, with four of the 11 measures assessing this construct. Although no test was used by more than one study, there were four measures that yielded very large and significant effects, with good Nfs statistics (Benton Line Orientation, Clock Drawing, Driver Scan, UFOV divided attention task). Although highly discriminating, the result for the Benton Line Orientation test was based on only a small sample. A further three measures had large effect sizes (WAIS Picture Arrangement, UFOV selective attention, MMSE), although two of these (Picture Arrangement, MMSE) were also only used with small samples. The Benton Line Orientation and Clock Drawing Tasks are not only highly discriminating but are also quick and easy to administer. While the MMSE was more effective in discriminating between pass/fail drivers when predicting driving simulator performance than on-road driving, it was still not as effective as the aforementioned measures.
Driving problems
Driving problems were the most frequently used measure of driving ability, with 12 studies examining cognitive functioning in relation to documented driving offences. Most studies compared people who had no crash history to those who had been in one or more crashes (N = 8), while others compared those involved with at-fault crashes with people involved in no-fault crashes (N = 3), and one study compared those who were involved in observable unsafe road incidents (accidents, running red lights, unsafe speed, unsafe distance between vehicles, poor positioning on the road) with those who were free of any such incidents. The samples sizes for these studies ranged in size from 53 to 1,910. A total of 21 different cognitive tests, yielding 50 scores, were used to discriminate between pass/fail drivers. The weighted effect sizes for these studies are provided in Table 5 (mean dw, SD, 95% CIs, %OL, Nfs).
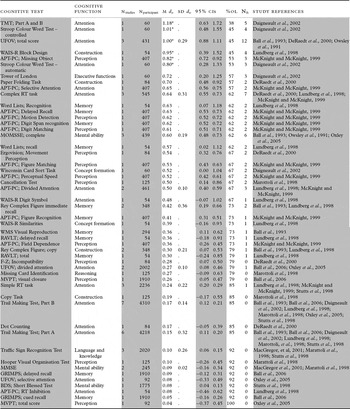
Cohen's d effect sizes for cognitive tests administered to pass/fail drivers based on driver problems

Nstudies = number of studies contributing to the effect size; Nparticipants = total number of participants; M dw = weighted mean effect size; SD dw = standard deviation of the effect size; 95% CI = 95% confidence intervals; OL% = percentage overlap between pass and fail groups; Nfs = Fail safe N; UFOV = Useful Field of View; WAIS-R = Wechsler Adult Intelligence Scale-Revised; APT-PC = Automated Psychological Test- Computer Administration; MOMSSE; Mattis Organic Mental Syndrome Screening Examination; WMS = Wechlser Memory Scale; RAVLT = Rey Auditory-Verbal Learning Test; F-Z = Fimm Zimmerman Test Battery; MVPT = Motor Free Visual Perception Test; RT = Reaction Time; MMSE = Mini-mental State Examination; GRIMPS = Gross Impairments Screening Battery; BDS = Blessed Dementia Scale.
*Effect size met the study criteria; d > 0.8, Nfs > Nstudies, 95% CIs did not span zero.
Once again, attention was the most commonly assessed cognitive function, followed by perception and memory. The majority of tests were only used by one study and all showed positive effects, indicating that older drivers who had experienced driving problems in the recent past (e.g. traffic accidents, traffic violations) consistently performed more poorly on the cognitive tests than those who did not have a documented history of driving problems. Although a very large number of tests were used, only a small proportion of these met the study criteria (i.e. d > 0.8, CI ≠ 0, Nfs > Nstudies). More specifically, drivers who had experienced problems showed large and significant decrements in their performance on the TMT (Total of Parts A and B), Stroop Color Word Test (SCWT; controlled and automatic tasks), UFOV (total score), WAIS Block Design, and the Missing Object subtest of the computerized Automated Psychophysical Test (APT). Moreover, the Nfs statistics suggest that we can be confident that it is unlikely that there would be enough unpublished studies with non-significant results (i.e. small Cohen's d) to draw these findings into question.
Moderator variables
The potential influence of age on differences in the cognitive performance of pass and fail drivers was examined by correlating age and mean effect sizes for studies that reported this data. Age data were available for a total of 20 studies, seven of which assessed driving using on-road tests and 10 of which used driving problems to determine driving ability. Only three studies used simulators, therefore precluding an analysis of these data. Age correlated positively, albeit non-significantly, with the differences in cognitive performance of drivers who passed or failed an on-road driving assessment (r = 0.57, n = 7, p = 0.179). Importantly, although this correlation was not significant, it amounts to a large effect (Cohen, Reference Cohen1992), indicating that as people age, there are larger differences in the cognitive performance of drivers who pass or fail an on-road driving assessment. In contrast, the correlation between age and driving problems was small (equating to a small effect) and non-significant (r = −0.16, n = 10, p = 0.653).
Discussion
The current study was designed to examine cognitive predictors of driving ability in older drivers with a view to identifying cognitive tests that could be used to make decisions about an individual's driving competence. These tests could be used either as a means of evaluating driving competence or as part of a multi-tier screening procedure to identify drivers who need to under-go a comprehensive on-road assessment. Meta-analytic techniques were employed to identify the tests that were able to discriminate between drivers who passed or failed one of three criterion measures of driving ability, namely: performance on a structured on-road driving test, performance on a computerized driving simulator, or documented driving problems. In doing so, the results of existing studies were consolidated to allow a direct comparison of the research findings.
This meta-analysis revealed that a wide variety of cognitive tests have been used in research that has examined driving ability in the elderly, although relatively few of these tests have been used by more than one study. Moreover, there is considerable variation in the ability of these measures to distinguish between good and bad drivers and, with one exception (UFOV), different predictors were identified for the three criterion measures of driving competence (on-road driving, driving simulator, or driving problems). This may reflect the limited overlap in the cognitive tests that were used by the studies using these different criteria, combined with the fact that the criterion measures may tap different aspects of driving ability. In all cases, the good/pass drivers performed better than the bad/fail drivers on the cognitive tests. Measures of attention featured most highly amongst the measures that best discriminated between pass/fail older drivers, followed by tests of construction and perception. Tests of memory, reasoning, and general cognitive ability were less commonly used and proved to be less discriminating.
Two cognitive tests (Ergovision Movement Perception subtest and UFOV complete test) showed very large group differences (d ≥ 1.5) between older drivers who passed or failed an on-road driving tests, and a further six (Complex RT tasks, Paper Folding task, Dot Counting, WMS Visual Reproduction, CVAT Single task, primary and secondary conditions) showed large group differences (d > 0.8 and < 1.5). While the superior discriminative power of the Ergovision Movement Perception test and UFOV is desirable, it is worth noting that both of these tests, and all but one of the other six tests, require computer presentation, which may limit their use in some settings. Indeed, the WMS Visual Reproduction subtest is the only test that has a paper-and-pencil format and successfully discriminated between pass/fail drivers. Also noteworthy was the finding that there was a strong association between age and the differences in cognitive performance of drivers who passed or failed an on-road driving assessment, suggesting that cognitive screening is more likely to be effective in detecting the more elderly poor drivers.
Of the cognitive tests that were used to predict the performance of older drivers on a driving simulator, three (Benton Line Orientation Task, Clock Drawing task, and a Driver Scanning task) had very good discriminative ability (d ≥ 1.5) and a further four had good discriminative ability (UFOW divided and selective attention subtests, WAIS Picture Arrangement, MMSE). Moreover, the three best tests (Benton Line Orientation, Clock Drawing, Driver Scanning) are paper-and-pencil measures that are simple to administer and score, making them highly accessible tests. As with on-road driving ability, the UFOW was a good predictor of performance on a driving simulator.
Finally, although there were no tests that were very good predictors of documented driving offences (d ≥ 1.5), six measures (TMT, Stroop Word reading and Color-word reading, UFOV complete test, WAIS Block Design, APT Missing Object) showed good discriminative ability (d > 0.8). Of these, only the UFOV and the APT are administered by computer. Also interesting is the fact that the UFOV once again featured as a predictor of driving ability. This may, in part, reflect the fact that this was one of the more commonly examined tests, with the TMT being the only other test to be examined by more than three studies. The remaining measures, the TMT, Stroop and WAIS Block design, are all relatively simple and quick to administer and score.
Study limitations and directions for future research
There are a number of limitations to the current study that warrant consideration. First, although comprehensive searches of the PubMed, PsycINFO, CINAHL and Health-Source Nursing databases were undertaken, these searches necessarily rely on key word searches of the title or abstract and may, therefore, overlook some studies that have used other less commonly used terms. While a large number of search terms were used and the reference lists of all included studies were examined for additional studies, it is possible that some studies were not included in this analysis. It is also possible that there are other studies that failed to find a relationship between cognitive tests and driving competence but were not published and, therefore, not included in this study. Fail-safe N statistics were calculated in an effort to address this problem.
Secondly, the results of single studies, particularly those using small Ns, are generally considered to be less reliable than those of multiple studies. However, given the diversity of tests that have been used to assess the cognitive abilities of older drivers, it became apparent that there was limited overlap in the tests that have been used, making it necessary to consider all available results. The results of single studies, particularly those with small Ns, should therefore be viewed with greater caution.
Thirdly, a meta-analysis involves synthesizing the research findings of studies that may differ in terms of some of their methodological variables (e.g. age, education, driving experience). Theoretically, it is possible to examine the impact of these variables on the results by treating these as moderator variables but this can only be done if the primary research studies report this information. In fact, most studies did not report these data. Only age could be analyzed in this way and even these analyses were limited by small sample sizes. Future research needs to address this by providing more detailed descriptions of their participants.
Fourthly, there was considerable variation in the methods that were used to assess driving competence. Not only were different criterion measures used (on-road driving, driving simulator, driving problems) but there was also variation in terms of how these measures were operationally assessed. For example, on-road driving tests potentially differed in terms of the driving course (structured or unstructured), the vehicle that was used (own vehicle vs modified/unfamiliar vehicle), how driving performance was classified (pass or fail; pass or fail or conditional/unsure/temporarily unsafe), and who determined driving competence (driving instructor, occupational therapist, or multidisciplinary team). Similarly, driving problems were established on the basis of self- or other-reports or state records, on either a retrospective or prospective basis, and over differing time frames. The conclusions of the current meta-analysis are limited by the measures of driving competence that were used by the primary studies that were entered into this analysis. The development of a systematic on-road assessment with standardized administration procedures and detailed guidelines for evaluating driving competence would assist in improving both the quality and consistency of these assessments.
Fifthly, it was also not possible to determine the extent of overlap in the people who were identified as potentially unsafe drivers and in need of more comprehensive driving assessments by the different cognitive tests. It is possible that these tests identified different subsets of drivers. Moreover, the cognitive tests are also likely to identify drivers who, upon further testing, prove to be safe drivers. Research using the most discriminating measures that were identified by the current study and administered to the same sample of older drivers is now needed to answer these questions.
Finally, there is a need for research that assesses the sensitivity (i.e. ability of cognitive tests to identify unsafe drivers correctly) and specificity (i.e. ability of cognitive tests to identify safe drivers correctly) of the most discriminating tests that were identified by this study in order to improve the practical usefulness of these tests in clinical and health settings. Unfortunately, the research examined here did not provide the data necessary to calculate these statistics. It is essential that these statistics, or contingency tables (containing numbers of true positives and negatives, and false positives and negatives) that would enable the calculation of these statistics, be established. Future research needs to identify cut-off scores for the cognitive tests that optimize the accuracy with which drivers are categorized as safe/unsafe drivers (where driver safety is independently determined by formal driving assessments). Cut-off scores, with known sensitivity and specificity, could then be used in health settings to determine the need for additional driver assessments. If cognitive tests are only used to screen drivers and not as the basis for making licensing decisions, the inclusion of safe drivers amongst those who are identified as needing additional driving assessments would not pose a serious problem, as these drivers would be detected in the second, more comprehensive, stage of assessment. However, the failure to detect unsafe drivers using cognitive tests is a much more serious problem, which should be minimized by establishing cut-off scores that optimize test sensitivity.
Summary and implications
Older drivers are involved in significantly more motor vehicle accidents than younger drivers when the number of licenses held and the distances driven are taken into consideration (Baldock et al., Reference Baldock, Mathias, Kloeden and McLean2002; OECD, 2001). This raises questions about the procedures for determining license renewal in older drivers, a group for whom mobility is important to their continued independence. Age alone is not an adequate predictor of driving ability (Sommer et al., Reference Sommer, Falkmer, Bekiaris and Panou2004) and mandatory on-road assessments of drivers over a particular age are not cost-effective (Langford et al., Reference Langford, Fitzharris, Koppel and Newstead2004a). Instead, age-related declines in cognitive ability are likely to prove more fruitful in identifying at-risk older drivers who are most in need of a comprehensive driving assessment. Indeed, evidence-based cognitive screening should assist in providing a more cost-effective and needs-based allocation of resources so that expensive and time-consuming on-road driving assessments are provided to those drivers whose driving ability is most likely to be compromised. However, there is currently no consensus about what cognitive abilities should be assessed or the specific tests that are most suited to this purpose.
The current meta-analysis identified a number of potentially useful screening measures, the choice of which needs to be guided by a number of considerations. First, an acceptable criterion measure for assessing driving ability needs to be decided upon. While some may consider on-road driving to be the “gold standard” for measuring driving ability, others may also be willing to accept performance in a simulated driving situation and/or documented driving problems as criterion measures. The fact that the majority of studies included in this meta-analysis used simulated driving performance and driving problems as the dependent variable suggests that there is considerable acceptance of these measures in the scientific community. The choice of one or more of these criterion measures will determine the range of cognitive tests that are under consideration, as only one test (UFOV) was identified as a predictor for all three.
A second consideration relates to the type and amount of resources that are available to assess older drivers. This will vary depending on the context in which these measures are being used. Specifically, access to a computer and the time and expertise available to assess an individual are all variables that will limit the range of cognitive tests that can be used in any given situation. The most discriminating computer-based measures were the Ergovision test (Movement perception), UFOV (total test, divided and selective attention subtests), a complex reaction time task, and a Driver Scan task. These all showed very large differences in the performance of pass and fail drivers, as defined by an on-road or simulated driving test performance, or documented driving problems. In addition, the Paper Folding, Dot Counting, CVAT, and Automated Psychophysical (Missing Objects subtest) tests are computerized measures that showed large group differences between pass/fail drivers. The most discriminating paper-and-pencil measure, on the other hand, was the Benton Line Orientation and Clock Drawing tests. The WMS Visual Reproduction subtest, Trail Making Test, WAIS-R Picture Arrangement and Block Design subtests, MMSE and Stroop are also paper-and-pencil tests that showed good discriminative ability.
Conflict of interest
None.
Description of authors' roles
J. L. Mathias was responsible for identifying the research question and for writing the article. L. K. Lucas was responsible for data collection and data entry, and assisted with writing the article. Both authors participated in designing the study and analyzing the data.