Introduction
The potential for site-specific crop management (SSCM) in vegetable crops in Australia has received little research attention, so there is minimal information on how/where/if traditional uniform management could be modified to optimise production. The potato industry in Tasmania was chosen for this study as it is the dominant contributor to Tasmanian vegetable production and Tasmania has one of the highest costs for potato production worldwide. Production costs for ware potatoes are approximately A$14000/ha, and breakeven yield is around 42 t/ha. The average production in Tasmania is 54 t/ha, making enterprise profit margins tight. The study area covered potato producers that are contracted to Simplot Australia Pty Ltd in the Midlands and Northern regions of Tasmania. These regions are the main contributors to the contracted tonnage of potatoes. The Midlands region of Tasmania has soils with a significant texture contrast between horizons that at times are difficult to manage, particularly the application of irrigation water across variable soils.
To begin exploring the potential for implementing this ‘site-specific’ agronomy, the magnitude and spatial scale of variation in important components of crop production need to be quantified and any production limiting factors in the field identified. This research aims to help bridge this knowledge gap on within-field production variability for potato crops and provide some information on what data may be useful to stimulate the adoption of SSCM. To this end a number of sensors and techniques applied in other cropping systems will be employed. Soil apparent electrical conductivity (ECa) has been shown to provide corroboration to the spatial yield pattern observed in many broadacre and viticulture fields, and correlation with a number of deterministic physical soil parameters such as soil texture and moisture (Jaynes, Reference Jaynes1996; Bramley, Reference Bramley2001; Whelan & McBratney, Reference Whelan and McBratney2003). Field topography has also been shown to provide an indirect indication of variability in soil physical and chemical attributes - again usually due to a high correlation with a deterministic attribute such as soil texture (Sudduth et al., Reference Sudduth, Drummond, Birrell and Kitchen1996). Topography also provides indirect information on microclimate attributes and water movement that influence crop production potential (Moore et al., Reference Moore, Gessler, Nielsen and Peterson1993). At the point sampling scale, Cotching et al. (Reference Cotching, Sparrow, Hawkins, McCorkell and Rowley2005), found that soil structure and depth to rooting resistance in Tasmanian soils were positively correlated with potato yield.
Therefore the general aim is to gather relevant information on resource and production variability and provide an assessment as to whether the pattern and size of observed production variability would warrant varying input rates (nutrients, irrigation water etc.) within a field to produce a more profitable result than uniform input application. If so, a preliminary set of decision rules for moving towards the spatial management of inputs based on the sensor data would be useful to permit potato growers to begin accessing gains in yield and production efficiency to be made through SSCM. The insights gained may also be used as a template for exploring SSCM in other mechanised vegetable crops.
Materials and methods
Data collection
Soil apparent electrical conductivity (ECa) and elevation data were gathered via an on-ground survey on 16 paddocks across the two regions in each of two seasons. The survey was carried out on ~15 m swaths using an all-terrain vehicle fitted with an electro-magnetic induction instrument (Geonics EM38DD®) to measure soil ECa and a carrier-phase DGPS to gather high quality elevation data. Once gathered, the method of Taylor et al. (Reference Taylor, McBratney and Whelan2007) was used to clean the data and map each layer to a common grid for each field. With the layers on a common grid, a multivariate k-means clustering process was employed (Hartigan and Wong, Reference Hartigan and Wong1979) to delineate potential management classes (PMC). In this instance, each field was stratified into three PMC and a stratified random sampling procedure, with the three classes used as strata, was employed to identify six sites for directed sampling. At these identified sampling sites, soil physical and chemical properties along with soil disease pathogen loads were measured.
During the growing season the crop was monitored using multispectral VIS-NIR aerial imaging to calculate the Normalised Difference Vegetation Index (NDVI). Aerial imaging was undertaken at week 8, 12, 14, 16 and close to harvest (week 19). Physical crop measurements and tissue samples were taken, as crops approached maturity, to ground-truth the information obtained from the aerial sensors and also compare to crop yield measurements. The samples were taken at the previously identified soil observation sites to enable a full landscape to yield analysis.
Potato yield was measured using Simplot harvesters fitted with a sensor and monitoring system (YM1) developed by ATV Adelaide. The system involved the mounting of an active weighing scale under the final grading belt, a GPS on the harvester roof, with both connected to a monitor in the cabin. The system recorded tared weight from the belt, along with field position information, which when combined with harvesting width could be used to calculate a yield in tonnes/ha every second of the operation. Total delivered yield for each field was recorded.
Data analysis
Correlation analysis was used to identify relationships between individual landscape and production properties. For correlation analysis of whole-field survey, NDVI and yield data where sample numbers were high (thousands of observations) a conservative level for significance testing was implemented (Pearson correlation coefficient n =100 p<0.01 =0.25).
Spatial analysis of the whole-field survey and yield data was used to provide quantitative information on how the landscape and production varies within a field.
At each location where physical point soil and plant samples were taken, ECa, elevation, NDVI and yield data were extracted from the whole-field data sets and combined with the point data. Correlation analysis on the entire set of point samples was undertaken to identify significant relationships and stepwise regression performed to build an understanding of the importance of measured factors on production variability.
Results
Whole field data analysis
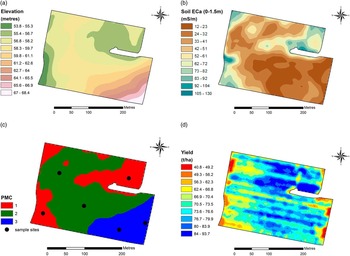
An example of the data gathered during the field surveys and yield mapping is shown in Figure 1. The surveys confirmed that in both the North and Midland regions there was extensive variation in ECa and elevation within fields. Potato yields also varied substantially between fields (54 t/ha to 78 t/ha; avg=64.3 t/ha, med=64.5 t/ha) with an average 3.5-fold yield variability within a field (28 t/ha to 96 t/ha. The data showed that the yield monitoring system as operated to manufacturer’s instructions results in an average absolute error of 10%. The receival yield data was used to post calibrate the yield monitor data to reflect actual field average yield prior to further analysis.
An example of field survey and yield monitoring data. (a) elevation, (b) soil ECa (0–1.5 m, (c) PMC and sampling points, (d) potato yield map.

Relationships documented at this scale (not shown here) led to the following interpretations:
-
∙ Changes in elevation and the related soil physical changes observed using ECa are generally working in concert to influence crop greenness/vigour/health, with higher NDVI at higher elevation inferring the elevation/soil interaction is actually combining with rainfall/irrigation quantities to create a production restriction at lower elevations during the first 2/3 of the season.
-
∙ It is more useful to gather aerial imagery from mid-season onwards if in-season prediction of variability in crop yield, or identification of potentially low production areas, is desired.
-
∙ The influence of soil and landscape position on production variability varied widely within and between regions, providing an indication that site-specific management information will be required at the within-field level.
Sample site data analysis
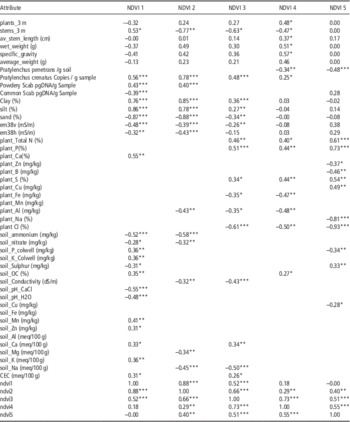
The sample site data aims to identify the soil and plant properties that are significantly related to the variability in production measures of NDVI and on-harvester yield data. Table 1 shows the results of the analysis for each aerial survey date and the correlation coefficients for relationships with all the plant and soil physical properties that were measured are included to illustrate any trends in significance with time. Non-significant correlations between NDVI and the other plant and soil chemical properties are omitted from Table 1.
Correlation coefficients from the analysis of relationships between NDVI gathered over the growing season and soil and plant physical and chemical measurements. All coefficients for physical plant and soil measurements are recorded along with all significant correlations. (*=p<0.10, **=p<0.05, ***=p<0.01).

The NDVI observations from each survey are significantly correlated (p<0.05) with the observations at least 2 surveys later or early in time. This provides evidence that even at the sample site observation scale, the NDVI is representing a smooth change in plant conditions through the season.
It is also obvious from Table 1 that the first NDVI survey is significantly influenced by soil physical and chemical parameters, is positively related to the soil-borne disease pathogen load, and is not responding to physical or chemical plant parameters. The second NDVI survey (NDVI 2) is still influenced by the physical soil parameters but the soil chemical and soil-borne disease pathogen load relationships are reducing while relationships with the physical plant parameters are beginning to increase. At the NDVI 3 survey, the influence of the soil physical and soil-borne disease pathogen loads are declining further and the relationships with plant chemical properties increases. By the 4th aerial survey (NDVI 4) the relationships with soil physical parameters have become non-significant, relationships with plant physical and chemical properties have peaked. At the last aerial survey (NDVI 5), the significant relationships are concentrated on the plant chemical properties.
These results offer significant support to the conclusion from the whole-field analysis that variation in aerial reflectance surveys from mid-season onwards are significantly responding to differences in plant related physical and chemical properties. It is worth noting that differences in both plant N and plant P, the two major elements applied in fertilizer management regimes, are significantly influencing NDVI. Early season surveys are responding significantly to differences in soil properties and disease pathogen load.
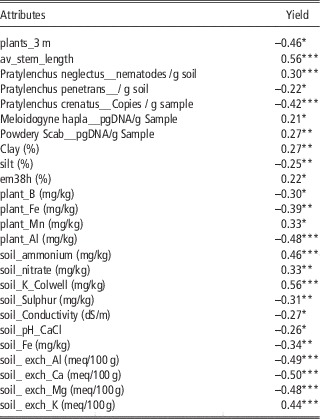
Table 2 shows the results of the general analysis of the relationships between harvester-gathered yield and the same site-measured soil and plant parameters. Of the soil physical properties, increasing clay and decreasing silt content have the most significant effect on raising crop yield.
Correlation coefficients from the analysis of relationships between yield data and soil and plant physical and chemical measurements. All significant correlations shown. (*=p<0.10, **=p<0.05, ***=p<0.01).

Soil Nitrogen and Potassium show a significant positive relationship with yield and the results suggest that when the exchangeable cations Al, Ca and Mg increase as a portion of CEC then yield can be negatively impacted. The concentration of key micronutrients Boron and Iron in plant tissue are negatively related to yield indicating a potential for toxicity. Increased Iron concentration in the soil also records a negative impact on yield. Manganese concentrations in the plant tissue show a positive relationship with yield which may indicate an important tendency towards deficiency in both regions.
The relationship with yield and the soil-borne disease pathogen load show a negative correlation with Pratylenchus penetrans and Pratylenchus crenatus suggesting a tendency for the present loads to be negatively impacting yield. Positive correlations with Pratylenchus neglectus, Meloidogyne hapla and Powdery Scab may indicate that where yield is highest, the conditions and increased plant material is causing pathogen loads to build but they are not yet at damaging levels. From a plant physiological view, increasing the average stem length of the plants within a 3 metre length of row is recorded as the most significant plant parameter positively effecting crop yield compared to the number of plants or numbers of stems.
Preliminary rules for exploring SSCM in potato production
The data gathered in this project has identified substantial between-field and within-field variability in the soil ECa used for growing potatoes in the North and Midlands of Tasmania. The variability is substantially driven by significant variation in soil texture, with changes in the clay and silt contents displaying the most influence. Coupled with the identified within-field variation in terrain, especially in the Northern region, the most appropriate option for exploring SSCM appears to be the pursuit of individual field-based decision rules within broad recommendations for useful field-scale data and sampling/analytical operations. This result mirrors findings in a range of other cropping industries (Bramley, Reference Bramley2001; Robertson et al., Reference Robertson, Llewellyn, Mandel, Lawes, Bramley, Swift, Metz and O’Callaghan2012; Koshla et al., Reference Khosla, Inman, Westfall, Reich, Frasier, Mzuku, Koch and Hornung2008).
In that context, a general set of preliminary rules is distilled here that could be used to initiate exploration of SSCM at the within-field scale across the potato production regions of the North and Midland regions of Tasmania. The results here indicate that a simple focus on managing spatial variability in the main macronutrients should be the first target. That this may bring financial benefits in potato production has been previously shown by Simard et al. (Reference Simard, Nolin and Cambouris1998) for variable-rate application of P and K and by Cambouris et al. (Reference Cambouris, Zebath, Ziadi and Perron2014) for N. It may also bring improvements in quality and uniformity (Widjmark et al., Reference Wijkmark, Lindholm and Nissen2005). This is also a well adopted management target in other cropping industries so technology for operations is widely commercialised. The second area for consideration is the use of soil ECa, elevation and NDVI imagery to manage irrigation water. Previous work by Rud et al. (Reference Rud, Cohen, Alchanatis, Dar, Levi, Brikman, Shenderey, Heuer, Markovits and Mulla Dand Rosen2013) has shown potential for such management in potato production.
General rules for instigating SSCM in potato production
-
1. Pre-season survey for soil ECa and elevation. Early season aerial NDVI could be substituted for ECa to minimize cost. This step is most important if irrigation management is likely to be a target
-
2. Midseason aerial NDVI imagery used to detect areas of potential N and P deficiency and yield limitations.
-
3. Use midseason imagery or combine with ECa/early imagery and elevation to stratify fields into PMC and direct targeted sampling. Methods could range from simple distribution stratification to multivariate clustering.
-
4. Sample top soil in each PMC for crop and soil chemical properties to determine potential for variable-rate nutrient management options based on measured concentrations in each PMC. N, P, K and Mn are priorities to target and avoid deficiency. Toxicity issues to assess include B and Fe. If irrigation management is also a target, sampling topsoil and subsoil for particle size analysis and soil conductivity is recommended.
-
5. Rectify any easily managed issues. Collect yield data to build a dataset for the field to use in quantifying impact of in-season management changes on production and to refine any future changes to nutrient or water management.
Conclusions
Greater than 3-fold variation in potato yield within fields will translate into significant variation in gross margin within uniformly treated potato fields. However, accurate, easy to gather yield data will be essential for the development of site-specific management in potato production.
The use of mid-season aerial imagery using NDVI are promising for the early detection of within-field deficiencies in the major macronutrients (N,P,K). The use of early-season aerial imagery to detect build-up of soil-borne pathogen load should be further investigated. For both endeavours, reflectance measurements other than NDVI (e.g. red edge NDVI, thermal) should also be explored.
Variable-rate irrigation should be explored based on the changes in soil type identified using ECa surveys or early-season aerial imagery. At present in the industry, small volume, regular applications of water are doing a reasonable job of negating the impact of spatial variability in soil water holding capacity within fields but results here suggest there may still be a significant negative impact on yield from temporary waterlogging.
Acknowledgements
Funded by Horticulture innovation Australia (HIA) using the Potato Industry levy, voluntary contributions from Simplot Australia and matched funds from the Australian Government.