


1 Introduction
There have been considerable advancements in the design and fabrication of surface treatments that can passively reduce turbulent skin friction drag. Often this is accomplished with microscale features that are designed to interact with the smallest (viscous) scales of the turbulence and modify the near-wall flow. A particular example of this is the use of riblets, which rely on streamwise protrusions to reduce interactions between the overlying turbulence and solid surface (Dean & Bhushan Reference Dean and Bhushan2010; García-Mayoral & Jiménez Reference García-Mayoral and Jiménez2011). Tailoring the scales and topography of riblets allows them to exhibit behaviour distinct from that of conventional roughness in a particular range of flow conditions. However, outside of this operating regime, the beneficial effects of the surface configuration will be negated and likely generate increased drag.
Recently, there has been significant interest in superposing a second fluid onto the roughness to improve the drag reduction characteristics. In particular, super-hydrophobic surfaces (SHS) have garnered the bulk of this interest and are an extremely promising method of passive drag reduction. These surfaces are composed of hydrophobic surface textures which can locally stabilize pockets of air when submerged underwater, resulting in a heterogeneous surface of air–water and solid–water interfaces. The slip effect facilitated by the presence of these air–water interfaces has been demonstrated to reduce turbulent drag in wide array of experimental facilities (Daniello, Waterhouse & Rothstein Reference Daniello, Waterhouse and Rothstein2009; Srinivasan et al.
Reference Srinivasan, Kleingartner, Gilbert, Cohen, Milne and McKinley2015; Ling et al.
Reference Ling, Srinivasan, Golovin, Mckinley, Tuteja and Katz2016; Gose et al.
Reference Gose, Golovin, Boban, Mabry, Tuteja, Perlin and Ceccio2018) at magnitudes up to
 $75\,\%$
(Park, Sun & Kim Reference Park, Sun and Kim2014). Theoretical and computational studies of turbulent flow over SHS have demonstrated similarly impressive results (Min & Kim Reference Min and Kim2004; Fukagata, Kasagi & Koumoutsakos Reference Fukagata, Kasagi and Koumoutsakos2006; Martell, Rothstein & Perot Reference Martell, Rothstein and Perot2010; Jelly, Jung & Zaki Reference Jelly, Jung and Zaki2014; Türk et al.
Reference Türk, Daschiel, Stroh, Hasegawa and Frohnapfel2014; Rastegari & Akhavan Reference Rastegari and Akhavan2015; Seo, García-Mayoral & Mani Reference Seo, García-Mayoral and Mani2015; Seo & Mani Reference Seo and Mani2016), although the details of the flow within the air layer have often been neglected by modelling the surface boundary condition as a pattern of shear-free and no-slip boundaries. Such an assumption has been justified by the large dynamic viscosity ratio between air and water and only recently have studies (Jung, Choi & Kim Reference Jung, Choi and Kim2016; Li, Alame & Mahesh Reference Li, Alame and Mahesh2017) started to consider the influence of the flow within the air layer. Despite the improvements to our understanding of the interactions between SHS and turbulence, there are still many open questions regarding the influence of surface morphology on the overlying turbulence and drag reduction mechanism.
A surface treatment similar to SHS is liquid-infused surfaces (LIS). Inspired by the Nepenthes pitcher plant (Wong et al.
Reference Wong, Kang, Tang, Smythe, Hatton, Grinthal and Aizenberg2011), LIS are composed of functionalized surface textures wetted with an immiscible, chemically matched liquid lubricant. Like SHS, the resulting surface is heterogeneous, containing a mixture of fluid–liquid and fluid–solid interfaces. In addition to exhibiting a wide range of desirable properties including ice phobicity (Epstein et al.
Reference Epstein, Wong, Belisle, Boggs and Aizenberg2012), pressure stability, self-cleaning and omniphobicity (Wong et al.
Reference Wong, Kang, Tang, Smythe, Hatton, Grinthal and Aizenberg2011), it has been experimentally demonstrated that grooved LIS configurations can reduce turbulent drag up to
 $35\,\%$
(Rosenberg et al.
Reference Rosenberg, Van Buren, Fu and Smits2016; Van Buren & Smits Reference Van Buren and Smits2017). Furthermore, from direct numerical simulation (DNS) results, Fu et al. (Reference Fu, Arenas, Leonardi and Hultmark2017) found that the drag reduction mechanism exhibited by LIS is fundamentally the same as SHS. This was further corroborated by Rastegari & Akhavan (Reference Rastegari and Akhavan2019). They correlated the amount of drag reduction obtained with SHS and LIS with the shift (
 $B-B_{0}$
) in the intercept of the logarithmic law of the wall
 $B$
relative to the baseline smooth wall
 $B_{0}$
. The relation between drag reduction and
 $B-B_{0}$
was shown to be the same for SHS and LIS. However, in the case of LIS, the viscosity of the lubricating fluid is of the same order as the overlying fluid and plays an important role in determining whether a LIS will reduce or increase drag. This is distinct from the case of SHS, where it has typically been assumed that the drag reduction is inherently due to the negligible viscosity of the air layer compared to the external fluid. In contrast, recent results from several LIS studies (Rosenberg et al.
Reference Rosenberg, Van Buren, Fu and Smits2016; Fu et al.
Reference Fu, Arenas, Leonardi and Hultmark2017; Van Buren & Smits Reference Van Buren and Smits2017) have found that LIS can generate turbulent drag reduction even when the lubricant is more viscous than the external fluid. However, when the lubricant viscosity significantly exceeded that of the external fluid the surfaces were found to increase drag. While LIS can be analysed and considered within the same frame as SHS, many of the same questions regarding the influence of surface morphology, and lubricant properties, on the resulting drag reduction remain open.
Here, we study the drag behaviour of canonical, structured surfaces superposed with a second fluid. Specifically, we detail how the viscosity of the superposed fluid and surface morphology influence the overall drag budget, i.e. the relative contributions of form and friction drag, and the role of the fluid–fluid interface in suppressing turbulent transport between the lubricating layer and overlying flow. To quantify these contributions, we performed DNS of a turbulent channel flow with the lower wall consisting of either longitudinal, transversal square bars or staggered cubes wetted with a second fluid. The viscosity of the second fluid is varied over a wide range to simulate both idealized SHS and LIS and the results were compared to a smooth wall DNS with the same mass flux. To identify the role of the fluid–fluid interface, the results were compared to a series of simulations with the same surface features but only a single fluid (i.e. rough wall). Furthermore, by considering a wide array of surface configurations we attempt to identify some flow behaviours common to SHS, LIS and rough surfaces.
2 Flow configuration
Geometrical sketch of the textured surfaces: (a) longitudinal square bars (LSB) with
 $a=0.5$
, (b) transversal square bars (TSB) with
 $a=0.5$
, staggered cubes (SC) (c)
 $a=0.5$
and (d)
 $a=0.875$
. The interface between the two fluids is the horizontal surface at the crest plane coloured in turquoise. The dimension of the texture
 $k$
is not to scale with
 $h$
for presentation purposes.

The upper wall of the channel is smooth while the lower wall is made of either longitudinal, transversal square bars or staggered cubes (see figure 1). The interface between the two fluids is placed at the crest plane (turquoise surface in the figure), separating the main stream from the fluid in the cavities. To minimize the number of parameters, we focus our attention on the role of the lubricant viscosity, specifically the viscosity ratio
 $N$
, where
 $N=\unicode[STIX]{x1D707}_{2}/\unicode[STIX]{x1D707}_{1}$
(where the subscripts
 $1$
and
 $2$
indicate the fluid in and above the cavities, respectively). Several viscosity ratios between the two fluids have been considered, ranging from
 $N=0.1$
to
 $N=100$
. The density is assumed to be the same in both fluids and the buoyancy is neglected. High values of
 $N$
mimic the viscosity ratio of SHS while low values of
 $N$
represent LIS. The present paper does not attempt to reproduce a real SHS and LIS, but focuses on an idealized model in order to understand the mechanism leading to drag reduction. The deformation of the interface, the dynamics of the contact line, the fluid retention and the effect of the density gradient at the interface are not addressed in the present paper.
The origin in the vertical direction is at the centreline, so the upper wall is at
 $y/h=1$
and the interface at
 $y/h=-1$
(where
 $h$
is the half-height of the channel). The computational box is
 $6.4h\times 2.05h\times 3.2h$
in the
 $x_{1}$
(streamwise),
 $x_{2}$
(wall normal) and
 $x_{3}$
(spanwise) directions, respectively. The additional
 $k=0.05h$
increase in channel height corresponds to the cavity height of the textured surfaces.
When both walls are smooth the bulk Reynolds number is
 $Re=U_{b}h/\unicode[STIX]{x1D708}_{2}=2,800$
and the turbulent Reynolds number is
 $Re_{\unicode[STIX]{x1D70F}}=U_{\unicode[STIX]{x1D70F}}h/\unicode[STIX]{x1D708}_{2}\simeq 177$
(with
 $U_{b}$
the bulk velocity and
 $U_{\unicode[STIX]{x1D70F}}$
the friction velocity, and
 $\unicode[STIX]{x1D708}_{2}=\unicode[STIX]{x1D707}_{2}/\unicode[STIX]{x1D70C}$
). The height of the cavities in the substrate in wall units is approximately
 $k^{+}\simeq 9$
, ‘
 $+$
’ denotes normalization by
 $\unicode[STIX]{x1D708}/U_{\unicode[STIX]{x1D70F}}$
, where
 $U_{\unicode[STIX]{x1D70F}}=(\unicode[STIX]{x1D70F}/\unicode[STIX]{x1D70C})^{1/2}$
and
 $\unicode[STIX]{x1D70F}$
is the wall shear. Periodic boundary conditions were applied in the streamwise and spanwise directions while the no-slip conditions were imposed on both the smooth (upper) and textured (lower) walls.
Details of the grid, turbulent Reynolds number and a grid sensitivity study are discussed in the Appendix. For both transversal square bars and longitudinal square bars, the pitch to width ratio is
 $p/w=2$
, (
 $p=w+k$
), corresponding to fluid-area fraction,
 $a=w/p=0.5$
(i.e. the fraction of fluid–fluid area over the total interfacial area of the substrate). Two different configurations of staggered cubes were evaluated, one with the same fluid-area fraction (
 $a=0.5$
) and another with a larger fluid-area fraction (
 $a=0.875$
). The larger gas fraction is aimed at highlighting the role of the interface. In fact, it should be expected that the surface with large
 $a$
would generate high values of drag reduction for SHS/LIS (Fu et al.
Reference Fu, Arenas, Leonardi and Hultmark2017) but increase the drag when there is only one fluid in the channel, i.e. the case of a classical rough wall (Leonardi & Castro Reference Leonardi and Castro2010).
3 Numerical procedure
The flow in the domain was computed using the non-dimensional, incompressible Navier–Stokes and continuity equations given by
 $$\begin{eqnarray}\displaystyle & \displaystyle \frac{\unicode[STIX]{x2202}U_{i}}{\unicode[STIX]{x2202}t}+\frac{\unicode[STIX]{x2202}U_{i}U_{j}}{\unicode[STIX]{x2202}x_{j}}=-\frac{\unicode[STIX]{x2202}P}{\unicode[STIX]{x2202}x_{i}}+\frac{1}{Re}\frac{\unicode[STIX]{x2202}}{\unicode[STIX]{x2202}x_{j}}\left[\widetilde{\unicode[STIX]{x1D707}}(y/h)\left(\frac{\unicode[STIX]{x2202}U_{i}}{\unicode[STIX]{x2202}x_{j}}+\frac{\unicode[STIX]{x2202}U_{j}}{\unicode[STIX]{x2202}x_{i}}\right)\right]+\unicode[STIX]{x1D6F1}\unicode[STIX]{x1D6FF}_{i1}, & \displaystyle\end{eqnarray}$$
 $$\begin{eqnarray}\displaystyle & \displaystyle \frac{\unicode[STIX]{x2202}U_{i}}{\unicode[STIX]{x2202}x_{i}}=0, & \displaystyle\end{eqnarray}$$
where
 $U_{i}$
is the component of the velocity vector in the
 $i$
direction,
 $i=1$
is for the component
 $U$
in the streamwise direction (
 $x$
),
 $i=2$
is for the component
 $V$
in the wall-normal direction (
 $y$
) and
 $i=3$
is for the component
 $W$
in the spanwise direction (
 $z$
),
 $\unicode[STIX]{x1D6F1}$
is the pressure gradient required to maintain a constant flow rate and
 $P$
is the pressure. The bulk Reynolds number is defined using the viscosity of the fluid in the main channel,
 $Re=\unicode[STIX]{x1D70C}U_{b}h/\unicode[STIX]{x1D707}_{2}$
. The change of viscosity in the cavities is accounted for with the term
 $\widetilde{\unicode[STIX]{x1D707}}$
using the Heaviside function
 $H$
, defined as
 $$\begin{eqnarray}\displaystyle \widetilde{\unicode[STIX]{x1D707}}(y/h)=\frac{1}{N}+\left(1-\frac{1}{N}\right)H(y/h), & & \displaystyle\end{eqnarray}$$
where
 $N$
is the viscosity ratio. In the present paper, the position of the interface is fixed at
 $y/h=-1$
. For
 $y/h<-1$
, fluid in the cavities (fluid 1),
 $H=0$
, for
 $y/h>-1$
, fluid above the cavities (fluid 2),
 $H=1$
.
The wall-normal velocity at the interface is zero and the shear stress is continuous:
 $\unicode[STIX]{x1D707}\unicode[STIX]{x2202}U_{1}/\unicode[STIX]{x2202}y$
,
 $\unicode[STIX]{x1D707}\unicode[STIX]{x2202}U_{3}/\unicode[STIX]{x2202}y$
. This mimics a stable interface and flow in the Cassie state corresponding to an infinite surface tension. The interface is, therefore, slippery in the spanwise and streamwise directions but cannot be deformed in the vertical direction. The flow rate has been kept constant in all simulations.
Equations (3.1) and (3.2) were discretized in an orthogonal coordinate system using a staggered, central, second-order finite-difference approximation. Additional details of the numerical method can be found in Orlandi (Reference Orlandi2000). The discrete system is advanced in time using a fractional-step method with viscous terms treated implicitly and convective terms explicitly. The large sparse matrix resulting from the implicit terms is inverted by an approximate factorization technique. At each time step, the momentum equations are advanced with the pressure at the previous step, yielding an intermediate non-solenoidal velocity field. A scalar quantity
 $\unicode[STIX]{x1D6F7}$
projects the non-solenoidal field onto a solenoidal one. A hybrid low-storage third-order Runge–Kutta scheme is used to advance the equations in time. The shape of the substrate is treated by the efficient immersed boundary technique described in detail by Orlandi & Leonardi (Reference Orlandi and Leonardi2006). This approach allows the solution of flows over complex geometries without the need for computationally intensive body-fitted grids. It consists of imposing
 $U_{i}=0$
on the points occupied by the solid texture. The discretization needs to be modified on the boundary cells otherwise the texture would be described in a step-wise way. At the closest grid points to the boundary, the derivatives in the Navier–Stokes equations are discretized using the distance between the velocities and the boundary of the texture rather than using the mesh size.
Statistics are computed with approximately
 $300$
velocity fields,
 $2$
non-dimensional time units apart (time is normalized by
 $h/U_{b}$
). After the first
 $3000$
non-dimensional time units, which were discarded, convergence to a statistically steady state was achieved.
The instantaneous fields (e.g. velocity or pressure) can be expressed as the superposition of three components (Hussain & Reynolds Reference Hussain and Reynolds1970; Raupach & Shaw Reference Raupach and Shaw1982). Considering for example the generic velocity component in the
 $i$
direction,
 $U_{i}(x,y,z,t)$
, (the same notation applies to any other variable), the instantaneous quantity can be decomposed as follows
 $$\begin{eqnarray}\displaystyle U_{i}(x_{l},y_{m},z_{k},t_{n})=\overline{U_{i}}(y_{m})+\tilde{U_{i}}(x_{l},y_{m},z_{k})+u_{i}^{\prime }(x_{l},y_{m},z_{k},t_{n}), & & \displaystyle\end{eqnarray}$$
where
 $l,m,k$
are the indices of the grid in
 $x,y,z$
respectively and the index
 $n$
is for time. An overline indicates averaging with respect to time, spanwise and streamwise directions:
 $$\begin{eqnarray}\displaystyle \overline{U_{i}}(y_{m})=\frac{1}{N_{x}N_{z}N_{t}}\mathop{\sum }_{l=1}^{N_{x}}\mathop{\sum }_{k=1}^{N_{z}}\mathop{\sum }_{n=1}^{N_{t}}U_{i}(x_{l},y_{m},z_{k},t_{n}), & & \displaystyle\end{eqnarray}$$
where
 $N_{t}$
is the number of fields saved in time,
 $N_{z}$
the points in the spanwise direction and
 $N_{x}$
the points in the streamwise direction, the grid is uniform in
 $x$
and
 $z$
. Angular brackets indicate averages with respect to time:
 $$\begin{eqnarray}\displaystyle \langle U_{i}(x_{l},y_{m},z_{k})\rangle =\overline{U_{i}}(y_{m})+\tilde{U_{i}}(x_{l},y_{m},z_{k})=\frac{1}{N_{t}}\mathop{\sum }_{n=1}^{N_{t}}U_{i}(x_{l},y_{m},z_{k},t_{n}). & & \displaystyle\end{eqnarray}$$
The Reynolds stresses are
 $$\begin{eqnarray}\displaystyle \overline{u_{i}u_{j}}(y_{m})=\frac{1}{N_{x}N_{z}N_{t}}\mathop{\sum }_{l=1}^{N_{x}}\mathop{\sum }_{k=1}^{N_{z}}\mathop{\sum }_{n=1}^{N_{t}}(U_{i}(x_{l},y_{m},z_{k},t_{n})-\overline{U_{i}}(y_{m}))(U_{j}(x_{l},y_{m},z_{k},t_{n})-\overline{U_{j}}(y_{m})). & & \displaystyle \nonumber\\ \displaystyle & & \displaystyle\end{eqnarray}$$
They can be decomposed as the sum of a dispersive component and an incoherent component substituting
 $U(x_{l},y_{m},z_{k},t_{n})-\overline{U}(y_{m})=\tilde{U} (x_{l},y_{m},z_{k})+u^{\prime }(x_{l},y_{m},z_{k},t_{n})$
:
 $$\begin{eqnarray}\displaystyle \overline{u_{i}u_{j}}(y_{m}) & = & \displaystyle \frac{1}{N_{x}N_{z}N_{t}}\mathop{\sum }_{l=1}^{N_{x}}\mathop{\sum }_{k=1}^{N_{z}}\mathop{\sum }_{n=1}^{N_{t}}(\tilde{U} _{i}(x_{l},y_{m},z_{k})+u_{i}^{\prime }(x_{l},y_{m},z_{k},t_{n}))(\!\tilde{U_{j}}(x_{l},y_{m},z_{k})\nonumber\\ \displaystyle & & \displaystyle +\,u_{j}^{\prime }(x_{l},y_{m},z_{k},t_{n})\!),\end{eqnarray}$$
and then
 $$\begin{eqnarray}\displaystyle \underbrace{\overline{u_{i}u_{j}}(y_{m})}_{Reynolds\;stress} & = & \displaystyle \frac{1}{N_{x}N_{z}N_{t}}\mathop{\sum }_{l=1}^{N_{x}}\mathop{\sum }_{k=1}^{N_{z}}\mathop{\sum }_{n=1}^{N_{t}}\underbrace{\tilde{U} _{i}(x_{l},y_{m},z_{k})\tilde{U} _{j}(x_{l},y_{m},z_{k})}_{Dispersive\;component}\nonumber\\ \displaystyle & & \displaystyle +\,\underbrace{u_{i}^{\prime }(x_{l},y_{m},z_{k},t_{n})u_{j}^{\prime }(x_{l},y_{m},z_{k},t_{n})}_{Incoherent\;component}.\end{eqnarray}$$
The first term on the right-hand side is the dispersive stress which arises as a consequence of the spatial inhomogeneities in the mean flow and the second term is the incoherent component (the mixed product,
 $\tilde{U} _{i}(x_{l},y_{m},z_{k})u_{i}^{\prime }(x_{l},y_{m},z_{k},t_{n})$
, once averaged in time is zero). The relative contribution of the dispersive stresses to the total stress is discussed in § 6. Below the roughness crest, averages in space are carried out on the fluid portion only (the sum is divided by the area of the fluid and not by the total horizontal area which includes the solid).
4 Mean velocity
Time averaged streamwise velocity profiles over longitudinal (a,b) and transversal square bars (c,d) for
 $N=100$
(a,c) and
 $N=2.5$
(b,d): (- - - -) on the crest (
 $P_{1}$
); (- - - -) at a distance
 $0.0075h$
from the wall (
 $P_{2}$
) (the cavity width is
 $0.05h$
); (– ⋅ – ⋅ –, blue) at the centre of the cavity (
 $P_{3}$
); (——) velocity is also averaged in spanwise and streamwise directions. For transversal square bars, velocity profiles at the centre of a lid-driven cavity from Shankar & Deshpande (Reference Shankar and Deshpande2000) are included as reference (– ⋅ – ⋅ –, pink).

Time averaged streamwise velocity profiles (
 $\langle U\rangle$
) at three different positions within the cavities of longitudinal and transversal square bars are shown in figure 2 for
 $N=2.5$
and
 $100$
. Velocity profiles at the different positions within the cavity converge to the time and space averaged velocity profile
 $\overline{U}(y)$
(black line) for
 $y/h>-0.96$
for longitudinal grooves and for
 $y/h>-0.99$
for transversal square bars. This corresponds to approximately
 $k$
and
 $0.2k$
above the interface (
 $k$
is the height of the bars). Because the shear stress at the interface (
 $y/h=-1$
) is continuous, there is a discontinuity in the interfacial velocity gradient, with the ratio between the velocity gradient above and below the interface inversely proportional to
 $N$
. The velocity inside the cavities increases with larger values of
 $N$
(smaller viscosity) and in the case of longitudinal bars compared to transversal bars. For
 $N=100$
, the velocity profile inside the cavity exhibits a change of concavity compared to profiles where
 $N=2.5$
.
For transversal bars, the velocity profiles in the centre of the cavity compare well with those relative to a lid-driven cavity obtained by Shankar & Deshpande (Reference Shankar and Deshpande2000) (– ⋅ – ⋅ –, red, figure 2) at approximately the same cavity Reynolds numbers,
 $Re_{cav}=U_{c}k/\unicode[STIX]{x1D708}\simeq 20$
and
 $1285$
for
 $N=2.5$
and
 $100$
respectively, where
 $U_{c}$
is the velocity at the centre of the cavity (
 $P_{3}$
) for
 $y/h=-1$
.
The velocity at the interface averaged in time and space gives the apparent slip velocity
 $U_{S}=\overline{U}|_{y/h=-1}$
as in Lauga & Stone (Reference Lauga and Stone2003). The slip length
 $\unicode[STIX]{x1D706}=U_{S}/(\text{d}\overline{U}/\text{d}y)|_{i}$
is the distance at which the velocity would be zero when extrapolating the interfacial velocity gradient of the overlying fluid into the surface. The apparent slip lengths and slip velocities of the different surface configurations are shown as function of the viscosity ratio in figure 3. The slip velocity and slip length decrease with
 $N$
, i.e. increasing the viscosity of the fluid in the substrate. Present results agree well with the model of Schönecker, Baier & Hardt (Reference Schönecker, Baier and Hardt2014) for longitudinal bars as discussed in Fu et al. (Reference Fu, Arenas, Leonardi and Hultmark2017). The slip length for the staggered cubes with
 $a=0.5$
is very similar to that of transversal square bars. For larger fluid-area fraction,
 $a=0.875$
,
 $\unicode[STIX]{x1D706}$
becomes much larger than that relative to longitudinal bars. An equivalent pitch can be defined to account for the larger fluid-area fraction of the cubes as
 $p_{c}=k/(1-a)$
. This would be the pitch of two-dimensional bars with the same fluid-area fraction of the cubes. Scaling the slip length with the equivalent pitch (
 $p_{c}=4p$
for
 $a=0.875$
),
 $\unicode[STIX]{x1D706}/p_{c}$
lies between the longitudinal and transversal bars, consistently with the geometrical layout which presents longitudinal alleys as in longitudinal bars, and obstacles perpendicular to the flow direction as in transversal bars.
Dependence of the slip length (a) and slip velocity (b) on the viscosity ratio. Lines, analytical models from Schönecker et al. (Reference Schönecker, Baier and Hardt2014) (solid) and Philip (Reference Philip1972) (dashed), symbols DNS results: ——, - - - -, (red), ▪ longitudinal bars; ——, - - - -, (green), ● transversal square bars; ▾ staggered cubes
 $a=0.5$
, ▴
 $a=0.875$
. Filled symbols are relative to two superposed fluids, empty symbols are for a single phase only. The slip length relative to arrays of cubes has been normalized by
 $p_{c}=k/(1-a)$
i.e. the equivalent pitch of two-dimensional bars with the same fluid-area fraction of the cubes.

An additional set of simulations has been performed with the same textured surface as in figure 1(a,b,d) but with one fluid corresponding to classical longitudinal square bars or rough walls made of staggered cubes or transversal square bars. For the flow with a single phase only, the equivalent slip length and slip velocity agree well with those obtained with two fluids of same viscosity separated by a slippery interface (
 $N=1$
). This indicates that the slip length and the reduction of the velocity gradient at the wall are not sufficient to explain the reduction of drag, because this same mechanism is present in rough walls too, which on the contrary increase the drag as it is shown in the next sections.
For longitudinal bars, the slip lengths for largest values of
 $N$
correspond to idealized SHS and are in good agreement with the analytic model of Philip (Reference Philip1972) and DNS results of Park et al. (Reference Park, Kim, Lee, Kim and Hwang2013) (not shown in the figure) which modelled SHS as streaks of free-slip and no-slip boundary conditions. In figure 4(a), the time averaged velocity at the interface between the two fluids, (local slip velocity
 $\langle U_{s}\rangle$
), for
 $N=100$
is compared to that obtained with free-slip boundary conditions. The distribution is quite similar, with the local slip velocity being slightly smaller in the case of
 $N=100$
. Since the velocity gradient is smaller too, the resulting slip length is similar to that obtained by Park et al. (Reference Park, Kim, Lee, Kim and Hwang2013). Therefore, for these larger viscosity ratios, the contribution of the underlying wall geometry is not relevant to determine the slip length and slip velocity.
On the other hand, for transversal square bars, larger differences are observed at large
 $N$
with respect to the model by Schönecker et al. (Reference Schönecker, Baier and Hardt2014). This may be because as
 $N$
increases, the Reynolds number in the cavity increases and the Stokes approximation is no longer valid. In figure 4(b) the velocity at the interface of transversal square bars obtained solving the Stokes flow equations over the same geometrical set-up is included as reference. While the Stokes’ flow velocity distribution on the cavity is symmetric, the same is not true in general for the turbulent DNS case. The inclusion of convective terms at finite Reynolds numbers results in a velocity distribution skewed towards the windward edge of the cavity.
Local slip velocity above longitudinal bars (a) and transversal bars (b): (- - - -) free-slip boundary conditions at the interface; (——)
 $N=100$
; (— ⋅ —)
 $N=2.5$
; (- - - -) Stokes flow.

Form drag (——, ▴), frictional drag on the crest plane (——, ▪) and inside the cavities (——, ●) normalized by the total drag as a function of the viscosity ratio
 $N$
. (a) Longitudinal square bars, (b) transversal square bar and (c) staggered cubes. Solid lines refer to
 $a=0.5$
, dashed to
 $a=0.875$
. Empty symbols indicate a single fluid (plotted in correspondence of
 $N=1$
for analogy), solid symbols two fluids (
 $N$
varies).

5 Drag budget
By integrating the time averaged Navier–Stokes equations for
 $U$
(
 $i=1$
in (3.1)) over the fluid volume in the channel it is obtained:
 $$\begin{eqnarray}\displaystyle \int _{V}\left(\frac{\unicode[STIX]{x2202}\langle U\rangle }{\unicode[STIX]{x2202}t}+\frac{\unicode[STIX]{x2202}\langle UU_{j}\rangle }{\unicode[STIX]{x2202}x_{j}}\right)\,\text{d}v=\int _{V}\left(-\frac{\unicode[STIX]{x2202}\langle P\rangle }{\unicode[STIX]{x2202}x}+\frac{1}{Re}\frac{\unicode[STIX]{x2202}^{2}\langle U\rangle }{\unicode[STIX]{x2202}x_{j}^{2}}+\langle \unicode[STIX]{x1D6F1}\rangle \right)\,\text{d}v, & & \displaystyle\end{eqnarray}$$
where
 $V$
is the volume of fluid in the channel including the volume of the fluid in the texture. Since the flow rate is constant (
 $\int _{V}\unicode[STIX]{x2202}\langle U\rangle /\unicode[STIX]{x2202}t=0$
), for periodicity in
 $x$
and
 $z$
and there is a no-slip condition at the walls, equation (5.1) reduces to
 $$\begin{eqnarray}\displaystyle \underbrace{\langle \unicode[STIX]{x1D6F1}\rangle V}_{Forcing} & = & \displaystyle \underbrace{\int _{S_{b}}\langle P\rangle \boldsymbol{n}\boldsymbol{\cdot }\boldsymbol{x}\,\text{d}s}_{Pressure\;\,drag}-\underbrace{\int _{S}\frac{1}{Re}\left.\frac{\text{d}\langle U\rangle }{\text{d}y}\right|_{y_{up}}\,\text{d}s}_{Friction\;upper\;wall}\nonumber\\ \displaystyle & & \displaystyle +\,\underbrace{\int _{S_{cr}}\frac{1}{Re}\left.\frac{\text{d}\langle U\rangle }{\text{d}y}\right|_{y_{cr}}\,\text{d}s}_{Friction\;crests}+\underbrace{\int _{S_{cav}}\frac{1}{Re_{1}}\left.\frac{\text{d}\langle U\rangle }{\text{d}n}\right|_{cav}\boldsymbol{x}\boldsymbol{\cdot }\boldsymbol{d}s}_{Friction\;cavity},\end{eqnarray}$$
where
 $y_{up}$
corresponds to the upper wall,
 $y_{cr}$
is the crest plane,
 $S_{cr}$
is the solid surface at the crest plane of the texture (red in figure 5),
 $S$
is the area of the upper wall (smooth),
 $S_{cav}$
indicates the walls of the cavities aligned to the flow (green in figure 5),
 $S_{b}$
are the walls of the cavity perpendicular to the flow direction (blue in figure 5),
 $\boldsymbol{n}$
is the normal to the walls in the cavity,
 $\boldsymbol{x}$
is the unit vector in the
 $x$
direction,
 $\boldsymbol{d}s$
is the vector tangential to the walls of the cavity and
 $Re_{1}=NRe$
is the Reynolds number of the fluid in the cavities. Dividing (5.2) by
 $S$
, we obtain that the forcing required to keep the flow rate constant (
 $\langle \unicode[STIX]{x1D6F1}\rangle V/S$
) is equal to the sum of the form drag of the texture (
 $P_{d}$
), friction on the upper wall,
 $C_{f,up}$
, friction on the crest plane
 $C_{f,c}$
and friction on the bottom wall
 $C_{f,b}$
.
 $$\begin{eqnarray}\displaystyle & \displaystyle P_{d}=S^{-1}\int _{S_{b}}\langle P\rangle \boldsymbol{n}\boldsymbol{\cdot }\boldsymbol{x}\,\text{d}s, & \displaystyle\end{eqnarray}$$
 $$\begin{eqnarray}\displaystyle & \displaystyle C_{f,up}=-S^{-1}\int _{S}\frac{1}{Re}\left.\frac{\text{d}\langle U\rangle }{\text{d}y}\right|_{y_{up}}\,\text{d}s, & \displaystyle\end{eqnarray}$$
 $$\begin{eqnarray}\displaystyle & \displaystyle C_{f,c}=S^{-1}\int _{S_{cr}}\frac{1}{Re}\left.\frac{\text{d}\langle U\rangle }{\text{d}y}\right|_{y_{cr}}\,\text{d}s, & \displaystyle\end{eqnarray}$$
 $$\begin{eqnarray}\displaystyle & \displaystyle C_{f,b}=S^{-1}\int _{S_{cav}}\frac{1}{Re_{1}}\left.\frac{\text{d}\langle U\rangle }{\text{d}n}\right|_{cav}\boldsymbol{x}\boldsymbol{\cdot }\boldsymbol{d}s, & \displaystyle\end{eqnarray}$$
(note all the quantities are non-dimensional since derived from equation (3.1), therefore lengths are normalised by
 $h$
, velocities by
 $U_{b}$
and pressure by
 $\unicode[STIX]{x1D70C}U_{b}^{2}$
).
The friction on the crest plane, in the cavities and the form drag, normalized by the total drag are shown in figure 5. For
 $N>50$
, the contribution of the friction below the crest plane and the form drag is, to a good approximation, negligible for transversal square bars. For the case of longitudinal square bars, the form drag is identically zero since there are no walls perpendicular to the flow direction. The friction on the side walls and bottom walls is approximately 3–4 % of the total drag. This may indicate that the assumption of free-slip boundary conditions on the crest plane may overestimate the amount of drag reduction of such quantity.
While previous studies have focused mostly on
 $N=\infty$
, here we extend the analysis to lower values of
 $N$
which represents lubricants with higher viscosity. As
 $N$
decreases, the value of the friction and form drag in the texture increases. This is because there is a larger momentum transfer inside the cavities balanced by an increase of frictional and pressure drag.
For large values of
 $N$
,
 $Re^{-1}\text{d}\langle \overline{U}\rangle /\text{d}y$
and then
 $P_{d}+C_{f,b}$
are very small. Reducing
 $N$
decreases the slip velocity (see figure 3) and increases the velocity gradient and momentum transfer at the interface. Consequently, the form drag and friction inside the substrate increase as well. The relative contributions to the total drag of
 $P_{d}$
and
 $C_{f,b}$
are highly dependent on the particular layout of the substrate. For example, in the case of transversal bars, the value of the friction inside the cavities remains close to zero for all values of
 $N$
. This is because of the recirculation and reverse flow on the bottom of the cavity. On the other hand, for longitudinal bars, a decrease of
 $N$
corresponds to a significant increase of the friction below the crest plane. For very small values of
 $N$
,
 $C_{f,c}$
and
 $C_{f,b}$
are almost equal. Staggered cubes with
 $a=0.5$
present a drag breakdown similar to transversal bars. The recirculation between two cubes is quite weak as between two consecutive transversal bars and may explain the similarities between the two surfaces in terms of slip length, slip velocity and drag breakdown. The cubes with gas fraction
 $a=0.875$
, on the other hand, have a larger form drag, due to the larger momentum transferred inside the substrate because of the larger area of the interface compared to
 $a=0.5$
. Even for
 $N=100$
, the contribution of the form drag is approximately
 $15\,\%$
of the total drag, therefore, modelling the surface with free-slip boundary conditions, neglecting the drag in the substrate does not seem to be appropriate for this layout.
The values of
 $C_{f,c},C_{f,b},P_{d}$
relative to one fluid only are also shown in figure 5 (empty symbols) in correspondence to
 $N=1$
(since there is only one value of viscosity inside and outside the substrate). The drag breakdown is approximately the same as that of two fluids with same viscosity and a slippery interface (no wall-normal velocity, only slip velocity) for both transversal and longitudinal bars and only slightly different for staggered cubes. In addition, the dependence of
 $C_{f,c},C_{f,b},P_{d}$
with
 $N$
is continuous, implying that changes to the amount of drag reduction do not reflect a different mechanism, but are due to the amount of momentum transferred from the bulk flow to the cavity.
Dependence of the drag reduction on the viscosity ratio (
 $N$
): ▪ longitudinal bars, ● transversal square bars, staggered cubes, ▾
 $a=0.5$
, ▴
 $a=0.875$
.

To quantify the amount of drag reduction, simulations of a smooth channel at the same Reynolds number (based on the viscosity of the main stream) and same flow rate were carried out. The amount of drag reduction
 $DR=(\unicode[STIX]{x1D70F}_{0}-\unicode[STIX]{x1D70F})/\unicode[STIX]{x1D70F}_{0}$
(
 $\unicode[STIX]{x1D70F}_{0}$
indicates the drag of the smooth channel) as a function of
 $N$
, is shown in figure 6, a negative value implying drag increase. The value of
 $\unicode[STIX]{x1D70F}$
, calculated as
 $\unicode[STIX]{x1D70F}=C_{f,c}+C_{f,b}+P_{d}$
is further validated by subtracting the friction on the upper smooth wall to the total pressure drop of the channel and by extrapolating the total shear stress (
 $\overline{uv}+\unicode[STIX]{x1D707}\text{d}\overline{U}/\text{d}y$
) at the wall (
 $\overline{uv}$
is the Reynolds stress as defined in (3.9) including both the dispersive and incoherent component). The differences in the 3 values of
 $\unicode[STIX]{x1D70F}$
obtained are smaller than
 $0.5\,\%$
. Because our parameterization covers several orders of magnitude in
 $N$
, this small uncertainty in
 $\unicode[STIX]{x1D70F}$
does not affect the general conclusions. For a fluid-area fraction
 $a=0.5$
, only longitudinal square bars were found to reduce the drag with respect to a smooth channel. Both staggered cubes and transversal bars increase the drag by
 $2\,\%$
and
 $5\,\%$
respectively. The drag for these two geometries does not depend significantly on the viscosity ratio. As
 $N$
increases, the friction and form drag (for the cubes) in the cavities decrease. This, however, is offset by an increase in friction on the crest plane as a consequence of the increased slip velocity. On the other hand, the drag reduction increases significantly by increasing
 $N$
for both longitudinal bars and staggered cubes with
 $a=0.875$
, the latter being the most effective in terms of reducing the drag given the larger fluid-area fraction. For these two geometries, the drag reduces with
 $N$
because the reduction of the friction on the bottom wall dominates and each can support a substantial streamwise flow within the lubricating layer.
It is perhaps surprising that drag reduction can be obtained not only with a significantly less viscous superposed fluid (i.e.
 $N\gg 1$
) inside the textured surface, but even with
 $N\simeq 1$
. For example, for
 $N\simeq 2.5$
, corresponding to the viscosity ratio of water over heptane, the drag over a substrate made of longitudinal bars or staggered cubes is reduced by approximately
 $5\,\%$
and
 $12\,\%$
respectively. Even for
 $N=1$
, which indicates two fluids with the same viscosity separated by a slippery flat interface, the drag is reduced. This is perhaps counter-intuitive because the flow configuration is very similar to a rough surface made of staggered cubes or longitudinal square bars which normally increase the drag, (see for example Leonardi & Castro Reference Leonardi and Castro2010). In fact, we performed DNS over the same texture with a single fluid without interface and found a higher drag with respect to that obtained with two fluids separated by an interface and
 $N=1$
(table 1). For longitudinal square bars the drag is approximately the same as that of a smooth wall, while for transversal bars and staggered cubes the drag increases by
 $18\,\%$
and
 $64\,\%$
respectively.
Comparison of the amount of drag reduction obtained by two superposed fluids with the same viscosity and a slippery interface (
 $N=1$
) with that of a single fluid over the same textured surface.

This inconsistency between the results with
 $N=1$
and a single fluid is also observed in the dependence of the drag on the slip velocity and slip length. Rastegari & Akhavan (Reference Rastegari and Akhavan2015) derived an analytical expression correlating the amount of drag reduction with either the slip velocity or the slip length:
 $$\begin{eqnarray}\displaystyle & \displaystyle DR=\frac{U_{s}}{U_{b}}+O(\unicode[STIX]{x1D716}), & \displaystyle\end{eqnarray}$$
 $$\begin{eqnarray}\displaystyle & \displaystyle DR=\frac{\unicode[STIX]{x1D706}^{+}}{\unicode[STIX]{x1D706}^{+}+Re/Re_{\unicode[STIX]{x1D70F}}}+O(\unicode[STIX]{x1D716}), & \displaystyle\end{eqnarray}$$
where
 $U_{s}/U_{b}$
and
 $\unicode[STIX]{x1D706}^{+}/(\unicode[STIX]{x1D706}^{+}+Re/Re_{\unicode[STIX]{x1D70F}})$
represents the contribution of either the slip velocity or length to the drag reduction and the term
 $O(\unicode[STIX]{x1D716})$
the modification of the turbulence structure and secondary flow. Present results for both SHS, LIS and rough surfaces (one fluid only) are shown in figure 7. For both idealized SHS and LIS, numerical results agree well with equations (5.7) and (5.8) when the texture is made of longitudinal bars and staggered cubes. For the latter, data are shifted approximately
 $5\,\%$
below the analytical correlation but the trend is very similar. On the other hand, the drag obtained for transversal bars does not correlate well with slip velocity and slip length because the term
 $O(\unicode[STIX]{x1D716})$
overcomes the modest reduction of drag due to the reduced shear on the cavity. In case of a single fluid, the amount of drag reduction for cubes and transversal bars is inversely correlated to the slip length and velocity, i.e. an increase in slip length and velocity corresponds to a larger drag (instead of reduction as in the cases with 2 fluids and the interface). This is because the changes to the turbulence structure and secondary motion,
 $O(\unicode[STIX]{x1D716})$
, overcome the contribution due to the slip length or velocity. In fact, following Rastegari & Akhavan (Reference Rastegari and Akhavan2015),
 $O(\unicode[STIX]{x1D716})$
is dominated by the Reynolds stress. In the case of staggered cubes with no interface, the Reynolds stress is much larger than in the case with the interface (figure 8
a) thus explaining the difference with respect to the model based on the slip length. On the other hand, longitudinal bars with a single phase agree better with the model because the Reynolds stress is very close to that obtained with two superposed fluids with an interface (figure 8
b). In case of a single fluid,
 $\overline{uv}$
increases significantly near the leading edge of obstacles perpendicular to the flow direction. Longitudinal square riblets do not present walls orthogonal to the flow direction and therefore
 $\overline{uv}$
on the crest plane is much smaller than that over staggered cubes. In fact, as shown in table 1, this is the case where the interface has the weakest effect in terms of drag, i.e. the difference of the drag relative to the cases with and without interface is only
 $3\,\%$
while for staggered cubes it is approximately
 $70\,\%$
.
Drag reduction as a function of the slip velocity (a) and slip length in wall units (b): ▪ longitudinal bars; ● transversal square bars; ▾ staggered cubes
 $a=0.5$
, ▴
 $a=0.875$
. Filled symbols are relative to two superposed fluids, empty symbols are for a single phase only. Solid lines are equations (5.7) and (5.8) respectively.

Shear stress (lines) and Reynolds stress (symbols) near the interface (
 $y/h=-1$
) for staggered cubes (a) and longitudinal bars (b): (▪, ——) one fluid only and (●, - - - -) LIS with
 $N=1$
. Points are plotted every 4 for clarity.

To clarify why the interface contributes to reduce the drag, we integrated the time averaged Navier–Stokes equations for
 $U$
in the texture (the volume
 $V_{t}$
between the interface, bottom wall and side walls of the cavities):
 $$\begin{eqnarray}\displaystyle \int _{V_{t}}\left(\frac{\unicode[STIX]{x2202}\langle U\rangle }{\unicode[STIX]{x2202}t}+\frac{\unicode[STIX]{x2202}\langle UU_{j}\rangle }{\unicode[STIX]{x2202}x_{j}}\right)\text{d}v=\int _{V_{t}}\left(-\frac{\unicode[STIX]{x2202}\langle P\rangle }{\unicode[STIX]{x2202}x}+\frac{1}{Re_{1}}\frac{\unicode[STIX]{x2202}^{2}\langle U\rangle }{\unicode[STIX]{x2202}x_{j}^{2}}+\langle \unicode[STIX]{x1D6F1}\rangle \right)\text{d}v. & & \displaystyle\end{eqnarray}$$
Similarly to the previous derivation, the flow rate is constant (
 $\int _{V_{t}}\unicode[STIX]{x2202}\langle U\rangle /\unicode[STIX]{x2202}t=0$
) and because of the periodicity in
 $x$
and
 $z$
and no-slip condition at the walls, equation (5.9) can be simplified to
 $$\begin{eqnarray}\displaystyle \int _{S_{int}}\frac{1}{Re}\left.\frac{\text{d}\langle U\rangle }{\text{d}y}\right|_{y_{int}}-\langle uv\rangle |_{y_{int}}\,\text{d}s+\langle \unicode[STIX]{x1D6F1}\rangle V_{t}=\int _{S_{b}}\langle P\rangle \boldsymbol{n}\boldsymbol{\cdot }\boldsymbol{x}\,\text{d}s+\int _{S_{cav}}\frac{1}{Re_{1}}\left.\frac{\text{d}\langle U\rangle }{\text{d}n}\right|_{cav}\boldsymbol{x}\boldsymbol{\cdot }\boldsymbol{d}s, & & \displaystyle \nonumber\\ \displaystyle & & \displaystyle\end{eqnarray}$$
where
 $y_{int}$
is the location of the interface,
 $S_{int}$
is the area between the two fluids. Equation (5.10) is a balance between the sum of shear stress and Reynolds stress at the interface (total stress) and the form and frictional drag inside the cavity.
SHS and LIS reduce the velocity gradient at the crest plane of the texture. However, to some approximation this also occurs in the case of one fluid only (i.e. rough wall). The shear stress relative to staggered cubes, with and without interface is only slightly different (figure 8 solid lines). On the other hand, the Reynolds stress is much larger in the case without interface (figure 8 symbols). Consistent with previous studies on rough walls (Leonardi et al.
Reference Leonardi, Orlandi, Smalley, Djenidi and Antonia2003, Reference Leonardi, Orlandi, Djenidi and Antonia2015), the textures with one fluid only (and no interface) have a very large Reynolds stress at the crest plane due mostly to its dispersive component
 $\overline{\tilde{U} \tilde{V}}$
as discussed in Jelly & Busse (Reference Jelly and Busse2018). Therefore, the major difference between rough walls and either LIS or SHS is the magnitude of
 $\langle uv\rangle |_{y_{int}}$
at the interface. The drag breakdown is approximately the same, as was observed in figure 5, implying that the fraction of the total drag due to the cavities is the same in both cases. Since
 $\langle uv\rangle |_{y_{int}}$
is smaller over SHS/LIS (zero in the ideal case of flat and slippery interface considered here) the drag contribution due to the cavities and then the overall drag is smaller too.
This explains why the same texture can decrease the drag with a fluid–fluid interface but increases the drag without an interface. The cavities in both rough walls, SHS and LIS, reduce the shear at the wall because of the slip velocity. However, one must consider the extra contribution to the drag given by the texture. Over rough walls, it overcomes the reduction of the drag due to the slip velocity and the total drag increases. Because SHS and LIS present an interface which reduces the wall-normal fluctuations and the momentum transport in the cavities, the contribution of the texture to the drag is much smaller and, as a consequence, the total drag decreases. It is a combination of the slip velocity and the reduced turbulent transport due to the interface to decrease the drag.
Streamlines of the time averaged secondary motion in the
 $z$
–
 $y$
plane (solid clockwise and dotted counter-clockwise) superposed on colour contours of time averaged streamwise velocity: (a)
 $N=100$
, (b)
 $N=2.5$
, (c) one fluid without interface.

The beneficial effect of the interface in reducing the drag can be also assessed by looking at the secondary streamwise vortices over longitudinal bars. A weak pair of streamwise vortices near the riblet tip has been observed by Goldstein & Tuan (Reference Goldstein and Tuan1998), Choi, Moin & Kim (Reference Choi, Moin and Kim1993), Suzuki & Kasagi (Reference Suzuki and Kasagi1994) and Crawford & Karniadakis (Reference Crawford and Karniadakis1996). Such vortices cause a weak mean flow upward from the riblet crest and downward in the middle of the cavities. They are the result of the vortex tilting
 $\unicode[STIX]{x1D714}_{y}\,\text{d}\overline{U}/\text{d}y$
which, in the case of longitudinal bars, has a peak at the side walls. In figure 9 the secondary motions for
 $N=100$
,
 $N=2.5$
and for the case with a single fluid without an interface are compared. The interface keeps the streamwise vortices above the cavity while, for the case of single fluid, they penetrate below the crest plane. As a consequence, and consistently with the discussion of equation (5.10), the Reynolds stress
 $\langle uv\rangle |_{y_{int}}=0$
at the interface for
 $N=100$
and
 $2.5$
while
 $\langle uv\rangle |_{y_{int}}\neq 0$
for the configuration without an interface. In fact, the cases with
 $N=100$
and
 $2.5$
reduce the drag while the case without interface does not. The interface tends to damp the wall-normal fluctuations and to keep the streamwise secondary vortices above the cavities. This reduces the momentum transfer inside the cavities and, therefore, the frictional and form drag of the texture. Classical studies of triangular riblets (one fluid without interface) showed that the cavity width had to be smaller than the size of the vortices to have drag reduction (Choi et al.
Reference Choi, Moin and Kim1993; García-Mayoral & Jiménez Reference García-Mayoral and Jiménez2011). For SHS–LIS it is the interface keeping the vortices above the cavities thus reducing the Reynolds stress and then the drag. To some extent, SHS–LIS do not suffer from the geometrical limit of classical riblets, and can achieve a very large theoretical drag reduction when the cavities are very large. In reality the interface is deformable and not slippery as assumed in the present model. García-Cartagena et al. (Reference García-Cartagena, Arenas, Bernardini and Leonardi2018) and Seo, García-Mayoral & Mani (Reference Seo, García-Mayoral and Mani2018) showed that when the interface deforms the amount of drag reduction is drastically reduced. Although exploring the role of interfacial deflections will be important to understanding many of these slippery surfaces, such an exploration is beyond the scope of this manuscript. However, the momentum transport associated with interfacial deflections will be captured by (5.10). In fact, a deformation of the interface induces a Reynolds stress (
 $\langle uv\rangle |_{y,int}\neq 0$
), an increased momentum transfer in the cavities and then a larger form and frictional drag of the texture. Consequently, one might expect that decreasing the interfacial tension will lead to larger deformations of the interface, reducing the amount of drag reduction.
6 Turbulent intensities
Root mean square of streamwise velocity (left)
 $\sqrt{uu}$
, and wall-normal velocity (right)
 $\sqrt{vv}$
: (a,b) Longitudinal square bars, (c,d) transversal square bars and (e,f) staggered cubes
 $a=0.875$
. Dashed lines one fluid configuration, solid lines for two superposed fluids, ——, (red)
 $N=1$
, ——, (green)
 $N=2.5$
. For
 $N=100$
both the total stress ——, (blue), and its dispersive component — ⋅ —
 $\sqrt{\overline{\tilde{U_{i}}\tilde{U_{j}}}}$
are shown. A zoom near the texture is shown in the inset. The velocity fluctuations are normalized with the bulk velocity.

The root mean square (r.m.s.) of streamwise and wall-normal velocity fluctuations for longitudinal and transversal square bars and for staggered cubes with
 $a=0.875$
are shown in figure 10 for
 $N=1,2.5,100$
and the case of one fluid only. The upper smooth wall can be used as reference to assess the increase or reduction of the turbulent intensities. The peak on the upper wall does not change much with
 $N$
indicating a weak correlation between the two walls. On the lower wall, for the drag reducing configurations, such as longitudinal bars and staggered cubes with
 $a=0.875$
, the wall-normal and streamwise velocity fluctuations are reduced. The more the drag is reduced (the larger is
 $N$
) the more the r.m.s. decreases with respect to a smooth wall. In this cases, the minimum of the velocity r.m.s. is shifted towards the textured wall. As shown by Leonardi, Orlandi & Antonia (Reference Leonardi, Orlandi and Antonia2005), the position with respect to the centreline of the minimum of the turbulent intensities is a measure of the relative contribution of the two walls to the total drag of the channel.
The peak of
 $\sqrt{\overline{uu}}$
inside the substrate (inset of figure 10) is due to the dispersive component of the r.m.s. due to inhomogeneities of the time averaged velocity in spanwise and streamwise directions. In fact, the time averaged streamwise velocity is very large above the cavities, zero on the crests of the cavities, and very low near the side walls thus inducing a dispersive component that dominates near the interface between the two fluids (this component is also present over regular rough walls). The dispersive component of the stress is significant in the region of the texture only, slightly above the crest plane it becomes very small (see — ⋅ — in the inset of figure 10). Similar trend of the dispersive stress was observed over rough walls in Leonardi et al. (Reference Leonardi, Orlandi, Djenidi and Antonia2015), and Leonardi & Castro (Reference Leonardi and Castro2010). It was also shown that dispersive stresses increase significantly when averages in time are done with a small number of data fields and the secondary vortices are locked in a position within the texture.
An increase of the velocity fluctuations is observed for the transversal square bars and the staggered cubes with one fluid. This is consistent with results of the flow over rough surfaces. In this case, the minimum of the standard deviation is shifted towards the upper wall which is the wall with lowest drag.
Maximum wall-normal (a) and streamwise (b) velocity fluctuations as function of
 $Re_{\unicode[STIX]{x1D70F}}$
, ▪ longitudinal bars; ● transversal square bars; ▾ staggered cubes with
 $a=0.5$
; ▴ staggered cubes with
 $a=0.875$
. Empty symbols indicate simulations with only one fluid without interface, solid symbols simulations with two fluids and a slippery interface, solid line (6.1), dashed line and black diamonds smooth wall data from (Lee & Moser Reference Lee and Moser2015).
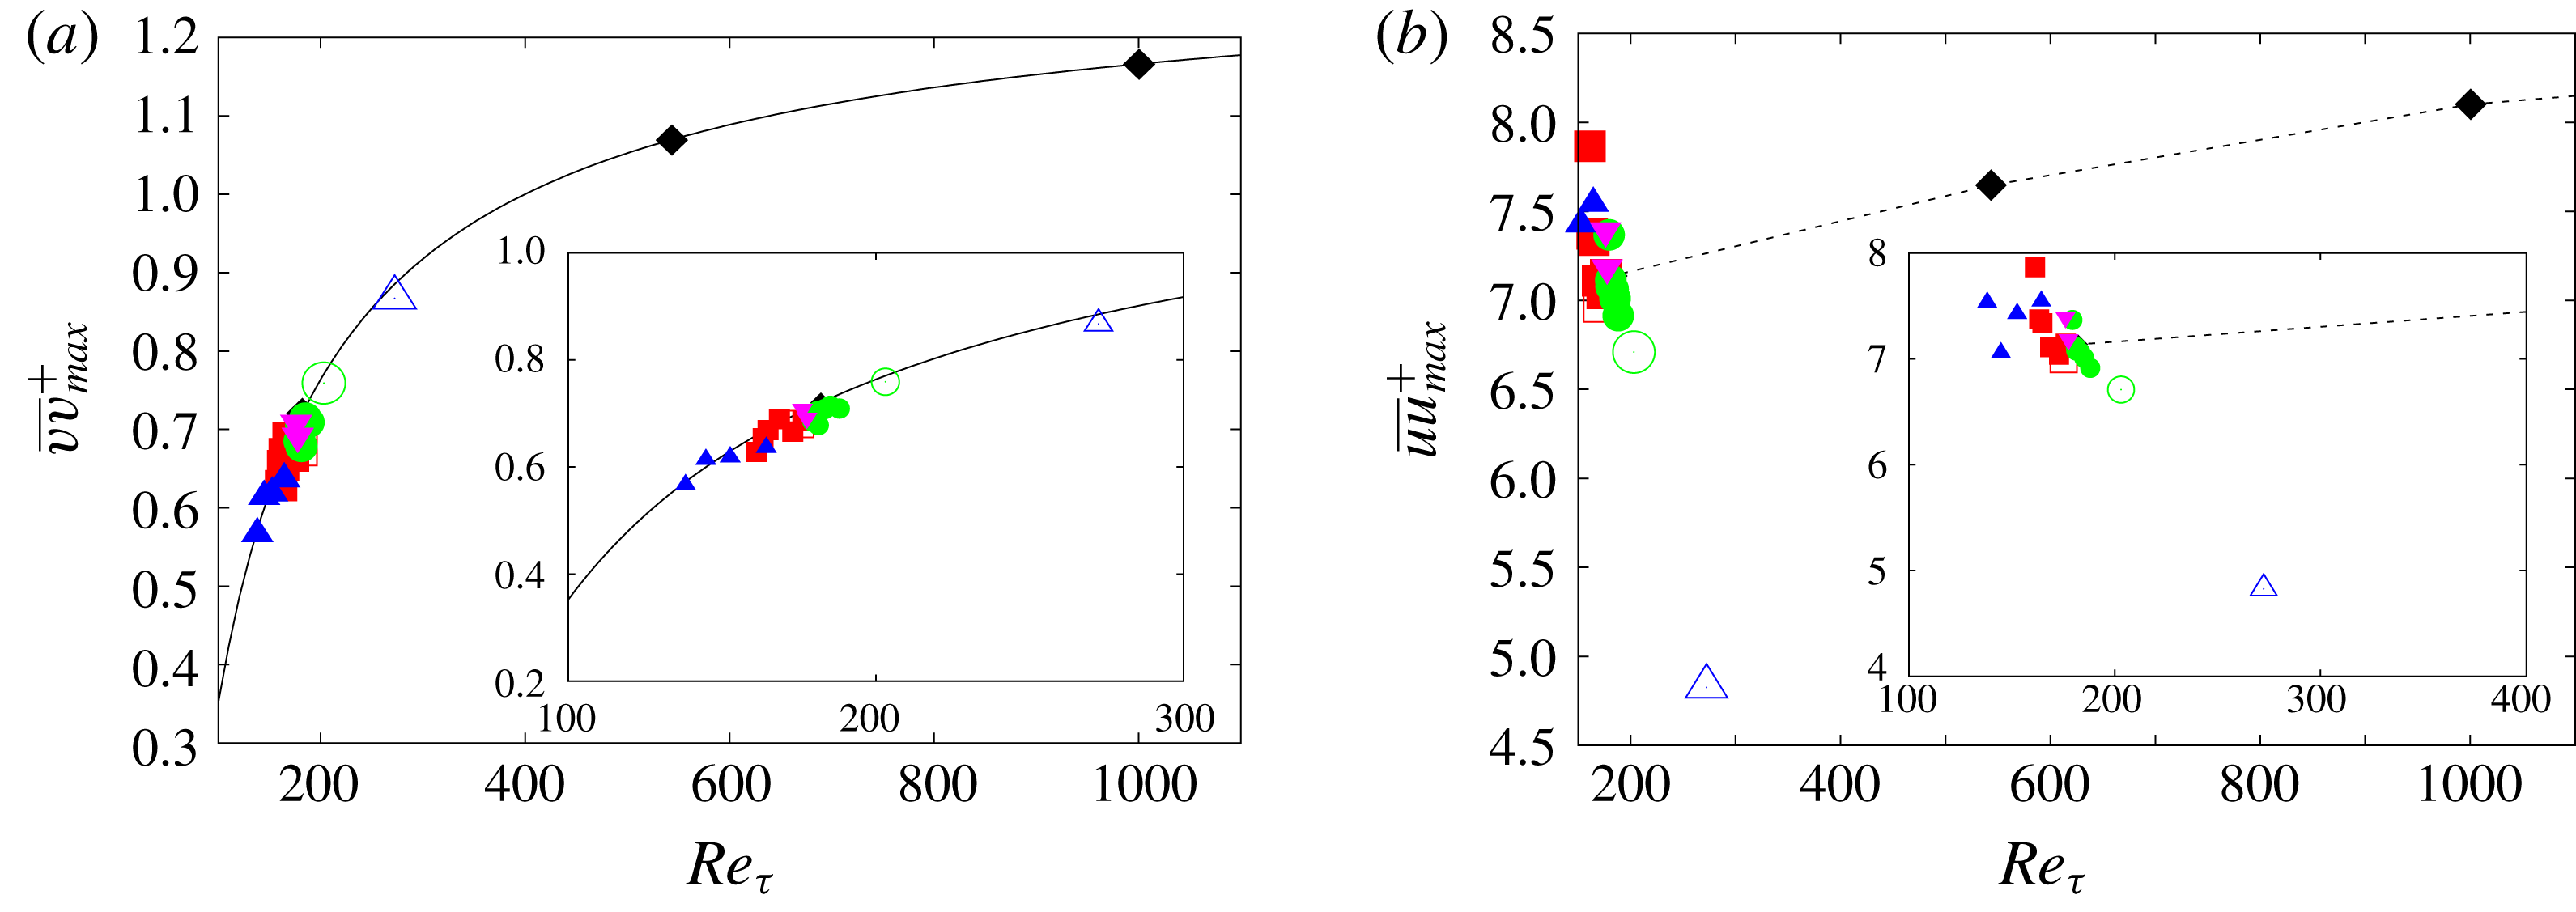
The correlation between velocity fluctuations and wall shear stress is further corroborated by plotting the maximum of the wall-normal velocity fluctuation, scaled in wall units, as a function of the turbulent Reynolds number
 $Re_{\unicode[STIX]{x1D70F}}$
(figure 11
a). For each case here considered, the turbulent Reynolds number has been calculated as
 $Re_{\unicode[STIX]{x1D70F}}=U_{\unicode[STIX]{x1D70F}}y_{uv}/\unicode[STIX]{x1D708}$
where
 $U_{\unicode[STIX]{x1D70F}}$
is the friction velocity on the lower wall (the one with the texture) and
 $y_{uv}$
is the distance from the texture to the zero crossing of
 $\overline{uv}$
as suggested in Burattini et al. (Reference Burattini, Leonardi, Orlandi and Antonia2008). When the drag on the two walls is approximately the same,
 $y_{uv}$
is very close to the half-height of the channel. However, in the cases with higher drag reduction or drag increase, the shift of
 $y_{uv}$
with respect to the centreline is significant and affects the value of
 $Re_{\unicode[STIX]{x1D70F}}$
. Numerical results are compared with a best fitting of smooth wall data from (Lee & Moser Reference Lee and Moser2015),
 $$\begin{eqnarray}\displaystyle (vv)_{max}^{+}=ARe_{\unicode[STIX]{x1D70F}}^{C}+B, & & \displaystyle\end{eqnarray}$$
with
 $A=-38.27$
,
 $B=1.32$
and
 $C=-0.7986$
. Results from SHS–LIS and rough surfaces follow, to a close approximation, the trend of the smooth wall. A change in the peak of
 $\overline{vv}^{+}$
with respect to the baseline smooth wall at
 $Re_{\unicode[STIX]{x1D70F}}=180$
is, therefore, primarily due to the overall change of shear and can consequently be expressed as a function of
 $Re_{\unicode[STIX]{x1D70F}}$
for that particular surface. While the wall-normal velocity fluctuations depend primarily on the overall shear, the streamwise velocity fluctuations vary significantly with respect to the smooth wall and a clear trend could not be determined (figure 11
b). Previous studies on rough surfaces highlighted an increase of isotropy with respect to the smooth wall. Here we add that
 $\overline{vv}$
increases proportionally to the shear and the turbulent Reynolds number, while
 $\overline{uu}$
does not increase with the same rate. When scaled in wall units,
 $\overline{vv}_{max}^{+}$
is approximately the same as that of a smooth wall at the same turbulent Reynolds number, while
 $\overline{uu}_{max}^{+}$
becomes much lower as in the case of roughness made of staggered cubes (

Dependence of the amount of drag reduction with the maximum of the wall-normal velocity r.m.s.: ▪ longitudinal bars; ● transversal square bars; ▾ staggered cubes with
 $a=0.5$
; ▴ staggered cubes with
 $a=0.875$
; solid line, equation (6.8). Empty symbols indicate simulations with only one fluid without interface, solid symbols simulations with two fluids and a slippery interface.

Similarly, we can derive a correlation between the amount of drag reduction (
 $DR=1-\unicode[STIX]{x1D70F}/\unicode[STIX]{x1D70F}_{0}$
) and the maximum of the wall-normal velocity fluctuations (normalized with that of the smooth channel),
 $\overline{vv}_{max}/\overline{vv}_{max,0}$
. As shown in figure 12, regardless of the layout of the substrate (cubes, longitudinal or transversal square bars), viscosity ratio and whether we have one or two fluids separated by an interface, there is a strong correlation between the wall shear stress and
 $\overline{vv}_{max}/\overline{vv}_{max,0}$
. A larger maximum of wall-normal velocity fluctuations corresponds to larger drag. To our best knowledge, this is the first time super-hydrophobic, liquid-infused surface and rough surfaces are reconciled under the same scaling (while correlations between the drag and the slip length or velocity work well only for SHS and LIS with weak secondary motion and Reynolds stresses). This confirms that wall shear stress and wall-normal velocity fluctuations are strongly tied, despite the different boundary condition at the wall (smooth, made of cavities filled with the same or another fluid, with or without an interface).
The correlation can be derived from (6.1), which can be expressed as:
 $$\begin{eqnarray}\displaystyle \frac{vv_{max}}{U_{\unicode[STIX]{x1D70F}}^{2}}=ARe_{\unicode[STIX]{x1D70F}}^{C}+B. & & \displaystyle\end{eqnarray}$$
Similarly for the baseline smooth wall case at
 $Re_{\unicode[STIX]{x1D70F},0}=180$
:
 $$\begin{eqnarray}\displaystyle \frac{vv_{0,max}}{U_{\unicode[STIX]{x1D70F},0}^{2}}=ARe_{\unicode[STIX]{x1D70F},0}^{C}+B. & & \displaystyle\end{eqnarray}$$
Dividing equation (6.2) by (6.3), we obtain
 $$\begin{eqnarray}\displaystyle \frac{vv_{max}}{vv_{0,max}}=\frac{U_{\unicode[STIX]{x1D70F}}^{2}}{U_{\unicode[STIX]{x1D70F},0}^{2}}\frac{ARe_{\unicode[STIX]{x1D70F}}^{C}+B}{ARe_{\unicode[STIX]{x1D70F},0}^{C}+B} & & \displaystyle\end{eqnarray}$$
 $Re_{\unicode[STIX]{x1D70F}}$
can be expressed as
 $$\begin{eqnarray}\displaystyle Re_{\unicode[STIX]{x1D70F}}=Re_{\unicode[STIX]{x1D70F},0}\frac{y_{uv}}{h}\frac{U_{\unicode[STIX]{x1D70F}}}{U_{\unicode[STIX]{x1D70F},0}}. & & \displaystyle\end{eqnarray}$$
The value of
 $y_{uv}/h$
can be derived from Leonardi et al. (Reference Leonardi, Orlandi and Antonia2005) neglecting the volume of the texture with respect to the volume of the channel:
 $$\begin{eqnarray}\displaystyle \frac{y_{uv}}{h}\simeq \frac{2}{1+(U_{\unicode[STIX]{x1D70F},0}/U_{\unicode[STIX]{x1D70F}})^{2}}, & & \displaystyle\end{eqnarray}$$
therefore
 $$\begin{eqnarray}\displaystyle \frac{vv_{max}}{vv_{0,max}}=\frac{U_{\unicode[STIX]{x1D70F}}^{2}}{U_{\unicode[STIX]{x1D70F},0}^{2}}\frac{A\left(\displaystyle \frac{U_{\unicode[STIX]{x1D70F}}}{U_{\unicode[STIX]{x1D70F},0}}\frac{2}{1+(U_{\unicode[STIX]{x1D70F},0}/U_{\unicode[STIX]{x1D70F}})^{2}}\right)^{C}Re_{\unicode[STIX]{x1D70F},0}^{C}+B}{ARe_{\unicode[STIX]{x1D70F},0}^{C}+B}. & & \displaystyle\end{eqnarray}$$
Substituting
 $U_{\unicode[STIX]{x1D70F}}=\sqrt{\unicode[STIX]{x1D70F}/\unicode[STIX]{x1D70C}}$
,
 $$\begin{eqnarray}\displaystyle \frac{vv_{max}}{vv_{0,max}}=\frac{\unicode[STIX]{x1D70F}}{\unicode[STIX]{x1D70F}_{0}}\frac{A\left(\displaystyle \frac{\unicode[STIX]{x1D70F}}{\unicode[STIX]{x1D70F}_{0}}\right)^{C/2}\left(\displaystyle \frac{2}{1+(\unicode[STIX]{x1D70F}_{0}/\unicode[STIX]{x1D70F})}\right)^{C}Re_{\unicode[STIX]{x1D70F},0}^{C}+B}{ARe_{\unicode[STIX]{x1D70F},0}^{C}+B}. & & \displaystyle\end{eqnarray}$$
Equation (6.8) has been developed assuming only that the wall-normal fluctuations over any texture change as an effect of the change of
 $Re_{\unicode[STIX]{x1D70F}}$
using a correlation developed for smooth walls (6.1). Equation (6.8) agrees well with numerical results for SHS–LIS and rough walls as shown in figure 12. This implies that the overall shear is the main mechanism producing and sustaining turbulence, regardless of whether it is produced in a particular texture, with or without an interface. Sufficiently above the texture, where the variability of the flow due to spatial inhomogeneities is negligible, the flow over different surfaces is the same as that over a flat wall at the same
 $Re_{\unicode[STIX]{x1D70F}}$
. Equation (6.8) and figure 12 emphasize further that the role of the interface in damping the turbulent transport and the wall-normal velocity fluctuations near the wall is critical to achieve drag reduction.
7 Conclusions
Direct numerical simulations of two superposed (immiscible) fluids in a turbulent channel have been performed where one of the fluids is fully wetted within periodic substrate textures. Various viscosity ratios were evaluated for two-dimensional (longitudinal and transverse bars) and three-dimensional (cubic pillar) substrate patterns.
Staggered cubes with a large fluid-area fraction (
 $a=0.875$
) and longitudinal square bars present the highest drag reduction which increases by decreasing the viscosity of the fluid inside the substrate. Transverse square bars and staggered cubes with
 $a=0.5$
, for this particular pitch to height ratio, increase drag overall as the form drag negates the positive effects of a reduced shear stress above the cavities.
DNS results showed that slip length, slip velocity, frictional and form drag and amount of drag reduction vary smoothly with
 $N$
indicating that SHS and LIS reduce the drag with a similar mechanism: the flow inside the substrate reduces the shear of the main stream above the cavities through a slip velocity.
Perhaps surprising in the case of the LIS, drag reduction can be achieved with fluid of a viscosity similar to that of the bulk flow
 $N\simeq 1$
. To better understand this result, an additional set of simulations with the same surface structures with a single fluid only has been carried out. By comparing the results for a single fluid and two fluids separated by an interface, with the same substrate, it was shown that the interface plays a key role in reducing the drag. The interface damps wall-normal velocity fluctuations and then limits the flux of momentum inside the cavities. The slip velocity, slip length and the viscous shear above a rough wall and a LIS with
 $N=1$
made with the same texture are very similar. However, the amount of momentum dissipated in the cavities is significantly lower for the LIS because of the reduced Reynolds stress (zero in case of ideal slippery interface) at the interface. This explains why a LIS, despite being very similar to a classical rough wall, reduces the drag. It is not a particular shape of the textured surface which makes LIS different from rough surfaces, but it is the interface between the two fluids preventing a momentum flux in the cavities.
The standard deviation of the velocity fluctuations is closely connected to the wall shear stress with a strong correlation between the amount of drag reduction and the maximum of the wall-normal velocity fluctuations. This was shown for rough, super-hydrophobic and liquid-infused surfaces, regardless of the viscosity ratio, shape of the substrate and presence of the interface (recall that for rough walls the drag increases).
Although it is beyond the scope of this paper, while in this study we considered the interface slippery but not deformable in the vertical direction, in reality the interface can deform. In this case, depending on the Weber number, and how the deformation of the interface is correlated with streamwise velocity fluctuations, the momentum transfer inside the texture may be only partially reduced with a consequent detrimental effect on the drag. The amount of drag reduction is less than that obtained with a flat and slippery interface as shown by García-Cartagena et al. (Reference García-Cartagena, Arenas, Bernardini and Leonardi2018). In addition, more studies are needed to optimize the morphology of the texture and size of the cavities to avoid the depletion of the fluid and increase durability.
Acknowledgements
This research was supported by ONR MURI grants N00014-12-01-0875 and N00014-12-01-0962, program manager Dr K.-H. Kim. M. K. Fu was supported by the Department of Defense (DoD) through the National Defense Science & Engineering Graduate Fellowship (NDSEG) Program. Numerical simulations were performed on TACC. Professor Akhavan is acknowledged for useful discussions.
Appendix
Turbulent Reynolds number
 $Re_{\unicode[STIX]{x1D70F}}$
and grid resolution for the different cases considered in the paper: LSB, longitudinal bars; TSB, transversal bars; SC, staggered cubes; NST indicates a single fluid,
 $a$
the gas fraction and
 $N$
the viscosity ratio. A grid sensitivity analysis of the drag on the textured wall is also reported for longitudinal and transversal bars with
 $N=2.5$
and
 $100$
.

(a,c) Streamwise velocity profile and (b,d) r.m.s. of velocity fluctuations for longitudinal bars with viscosity ratio
 $N=100$
(a,b) and
 $2.5$
(c,d):
 $512\times 384\times 640$
(——);
 $512\times 384\times 1280$
(- - - -);
 $256\times 384\times 640$
(– ⋅ – ⋅ –). Velocities are normalized by the bulk velocity.

The computational box is
 $6.4h\times 2.05h\times 3.2h$
in the streamwise, wall-normal and spanwise directions as mentioned in § 2. The grid used for transversal square bars is
 $1280\times 384\times 512$
in the streamwise, wall-normal and spanwise directions, with a resolution of approximately
 $1$
wall units in both homogeneous directions. For staggered cubes, the number of points in the spanwise direction was increased to
 $640$
in order to have at least
 $10$
points within the spanwise side of the cube. On the other hand, for longitudinal bars the grid is
 $512\times 384\times 1280$
in the streamwise, wall-normal and spanwise directions, respectively. The increased resolution in spanwise direction is aimed at resolving the high velocity gradient at the edge of the longitudinal bars, as suggested by Jelly et al. (Reference Jelly, Jung and Zaki2014). A non-uniform grid is used in the wall-normal direction with
 $40$
points clustered within the textured substrate. The vertical grid is the same for all textures. The present grid is finer than that used in our previous work on roughness (Leonardi et al.
Reference Leonardi, Orlandi, Smalley, Djenidi and Antonia2003; Leonardi & Castro Reference Leonardi and Castro2010; Leonardi et al.
Reference Leonardi, Orlandi, Smalley, Djenidi and Antonia2003; Burattini et al.
Reference Burattini, Leonardi, Orlandi and Antonia2008). A grid sensitivity analysis has been performed to assess the dependence of the results on the resolution. Details are in table 2. For longitudinal bars by halving the number of points in streamwise direction, the error in the friction coefficient is approximately
 $0.37\,\%$
and
 $0.48\,\%$
for
 $N=100$
and
 $2.5$
respectively. By halving the number of points also in spanwise direction the error increases to
 $3.9\,\%$
and
 $1.77\,\%$
for
 $N=100$
and
 $2.5$
respectively. The resolution is less critical for smaller values of
 $N$
because the velocity gradient at the interface and at the side walls is smaller. A similar trend is observed for transversal square bars.
Mean velocity profiles and turbulent intensities are shown in figure 13 for
 $N=2.5$
and
 $100$
. Results depend very weakly on the grid used and are hardly discernible. A larger sensitivity to the grid is observed in the region inside the cavities (
 $-1.05<y/h<-1$
) for the case
 $N=100$
where the velocity gradients at the interface and side walls are steeper. The grid sensitivity study shows that our grid resolution is sufficient to support the main conclusions in the paper.



