





Drinking culture is a staple in modern society. Over 90 % of people in the USA have consumed alcohol at some point in their life, and international estimates put it at 80 % across multiple countries(Reference Glantz, Bharat and Degenhardt1). Alcohol dependence and abuse are of particular concern, especially when considering cardiovascular health. The literature on alcohol consumption and cardiovascular health is extensive, yet mixed, with some studies showing a beneficial effect(Reference Ronksley, Brien and Turner2), while others suggest a causal role in heart disease(Reference Bell, Daskalopoulou and Rapsomaniki3). In the context of atrial fibrillation (AF), alcohol consumption is a recognised trigger of arrhythmic episodes(Reference Groh, Faulkner and Getabecha4) and has been associated with both incident AF and AF burden(Reference Voskoboinik, Kalman and De Silva5). However, the biological mechanisms underlying these associations remain incompletely understood.
Inflammation of the myocardium(Reference Zagrosek, Messroghli and Schulz6), atrial remodelling(Reference Voskoboinik, Wong and Lee7) and impaired strain function(Reference Voskoboinik, Costello and Kalman8) have all been associated with drinking. These changes in cardiac structure and function contrast with other observations suggesting a beneficial effect of low-to-moderate alcohol consumption on CHD and other CVD(Reference Bell, Daskalopoulou and Rapsomaniki3,Reference Di Castelnuovo, Costanzo and Bagnardi9,Reference Di Castelnuovo, Costanzo and Bonaccio10) . Circulating biomarkers reflecting these processes provide an opportunity to evaluate these mechanisms in vivo.
In addition, alcohol consumption is often characterised using average intake (e.g. drinks per day), which captures overall exposure but does not distinguish between different drinking patterns. Despite this limitation, examining associations between average alcohol intake and biomarker trajectories can provide insight into how cumulative exposure relates to intermediate biological processes relevant to AF.
The PREDIMED-Plus trial offers a unique opportunity to investigate these associations in a population at high cardiometabolic risk undergoing a lifestyle intervention, with repeated measures of both alcohol consumption and circulating biomarkers over time(Reference Alam, Toledo-Atucha and Romaguera11,Reference Li, Alonso and Romaguera12) . Therefore, the objective of this study was to evaluate cross-sectional and longitudinal associations between average alcohol consumption and biomarkers reflecting AF-related pathways, including inflammation, atrial stretch, myocardial injury, fibrosis and oxidative stress.
Methods
Study population
The PREDIMED-Plus is an ongoing, multicenter, randomised control trial with the primary objective of assessing the effect of an intensive weight-loss intervention alongside an energy-reduced Mediterranean diet and behavioural intervention on the primary prevention of CVD in 6874 persons with metabolic syndrome(Reference Martinez-Gonzalez, Buil-Cosiales and Corella13). Those assigned to the control group were guided to follow the Mediterranean diet without mention of energy reduction or physical activity. The dietary intervention included a recommendation to consume one or two glasses of wine per day for women and two or three glasses of wine per day for men. The consumption of other sources of alcohol other than wine was discouraged. Red wine was preferred over other types, and it was recommended that the wine be consumed at mealtimes.
Ethical approval
All Institutional Review Boards at participating institutions reviewed and approved this study’s protocol, and all participants have provided written informed consent to be part of the study.
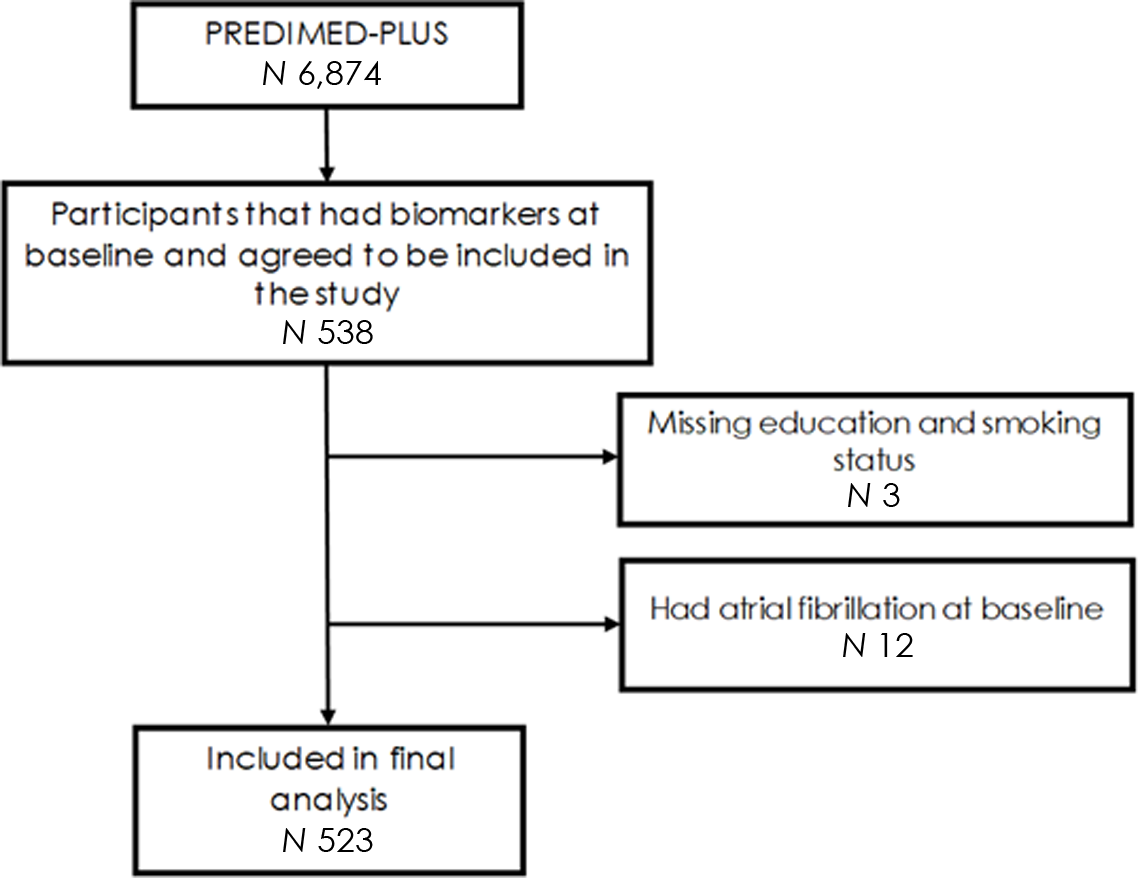
This analysis was restricted to 538 participants from three study sites with available biomarker data. Figure 1 provides a flowchart of selection into the current analysis. After excluding those who had AF at baseline (n 12) and were missing other important demographic information (n 3), 523 participants were included. Of these, 495 (95 %) and 478 (91 %) had biomarker data available at the year three and year five visits, respectively.
Flow chart of selection into the study.

Cardiovascular biomarkers
Biomarkers of interest for this analysis are purported to be involved in AF and AF-related pathways. These biomarkers include N-terminal pro-B-type natriuretic protein and high-sensitivity troponin-T (hsTnT), markers of myocardial stress and damage; high-sensitivity C-reactive protein (hsCRP), an indicator of inflammation; 3-nitrotyrosine (3-NT), a by-product of nitrative stress and biomarker of oxidative stress; and procollagen type 1 carboxy-terminal propeptide (PICP), a marker of cardiac fibrosis. Biomarkers were measured in blood samples from fasting participants at baseline, year 3, and year 5. N-terminal pro-B-type natriuretic protein and hsTnT were measured by way of electrochemiluminescence immunoassay, while hsCRP was measured through immunoturbidimetry and was run on a Cobas 8000 autoanalyzer (Roche Diagnostics). Enzyme-linked immunosorbent assay technique (ELISA) was utilised to measure 3-NT (Human Nitrotyrosin ELISA kit; Abcam, Cambridge, UK) and PICP (MicroVue PICP EIA; Quidel, San Diego, CA, USA). The intra- and inter-assay variability for biomarkers is as follows: 3·8 % and 6·9 % for N-terminal pro-B-type natriuretic protein; 2·0 % and 3·7 % for hsTnT; 3·2 % and 3·9 % for hsCRP; 5·5 % and 7·2 % for PICP; and 10 % and 15 % for 3-NT.
Alcohol consumption
A validated 143-item FFQ administered at every visit during the course of the trial was used to calculate usual alcohol consumption(Reference Fernandez-Ballart, Pinol and Zazpe14). One standard drink was defined as 14 grams of pure alcohol. As pure alcohol content is dependent on the type of alcohol, standard sizes for each type of beverage were defined as the following: 1 glass of wine (100 cc), save for muscatel (50 cc); 1 bottle of beer (330 cc); 1 shot of liquor or whiskey (50 cc). The intra-class correlation between FFQ and four 3-day dietary data was 0·82 for alcohol intake(Reference Fernandez-Ballart, Pinol and Zazpe14).
Covariates
Education, marital status and smoking status were self-reported. Metabolic equivalents of task in minutes per day served as measurement of physical activity(Reference Schroder, Cardenas-Fuentes and Martinez-Gonzalez15). BMI was calculated from height and weight measured at baseline. Systolic and diastolic blood pressure were measured three times at each visit and then averaged. Diabetes status was determined through self-report, the use of antidiabetic medication and measurements of fasting blood glucose and glycated Hb. The 21-question Beck Depression Inventory detected the presence of depressive symptoms. Finally, adherence to the Mediterranean diet was assessed through a 16-item questionnaire; the original 17-item version of the questionnaire was edited to remove alcohol intake in order to avoid redundancy(Reference Schroder, Zomeno and Martinez-Gonzalez16). Age, sex, education, weight, height, marital status and diabetes status are from baseline only. To account for fluctuating anthropomorphic, lifestyle and medication usage, we treated the following covariates as time-varying (measured at baseline, year 3 and year 5): BMI, systolic and diastolic blood pressure, smoking status, physical activity, depression status, diet adherence, cholesterol medication use and antihypertensive medication use. We also added weight change as a covariate in our analysis, measured as the difference between each year of participation.
Statistical analysis
We used multivariable linear regression models to estimate cross-sectional associations between alcohol consumption and cardiac biomarkers at baseline. We used mixed models to estimate longitudinal associations of baseline alcohol consumption with change in cardiac biomarkers from baseline to year 3 to year 5. All biomarkers were log-transformed, and time was modelled in 5-year increments in longitudinal analyses. Alcohol consumption was categorised as no drinking (0 drinks/d, reference group), 1, 2–3, or ≥ 4 drinks/d. Additional analyses were conducted with alcohol modelled as a continuous variable and with visit considered as a categorical variable (baseline, year 3, year 5). To assess the impact of change in drinking behaviour over time, we used the difference in alcohol consumption from baseline to year 5 as the predictor of change in biomarkers over the course of the study. The difference in alcohol consumption was categorised into decreased consumption (≥ 1 drinks/d), no change (< 1 drinks/d) and increased consumption (≥ 1 drinks/d).
Models were first adjusted for age, sex, education and assignment to the intervention group. They were later also adjusted for marital status, smoking, physical activity, height, BMI, systolic and diastolic blood pressure, diabetes, antihypertensive medication use, cholesterol medication, use, depression and adherence to the erMediterranean diet. Longitudinal analyses further accounted for interaction of all covariates with time. Change in consumption analysis took an additional step in adjusting for baseline alcohol consumption when examining trajectories over the course of the study. We performed additional analyses stratified by sex and tested for interaction including alcohol * sex terms in the models.
All analyses were performed using SAS 9.4 (SAS Institute Inc.), while splines were generated using STATA, version 17 (StataCorp LP).
Results
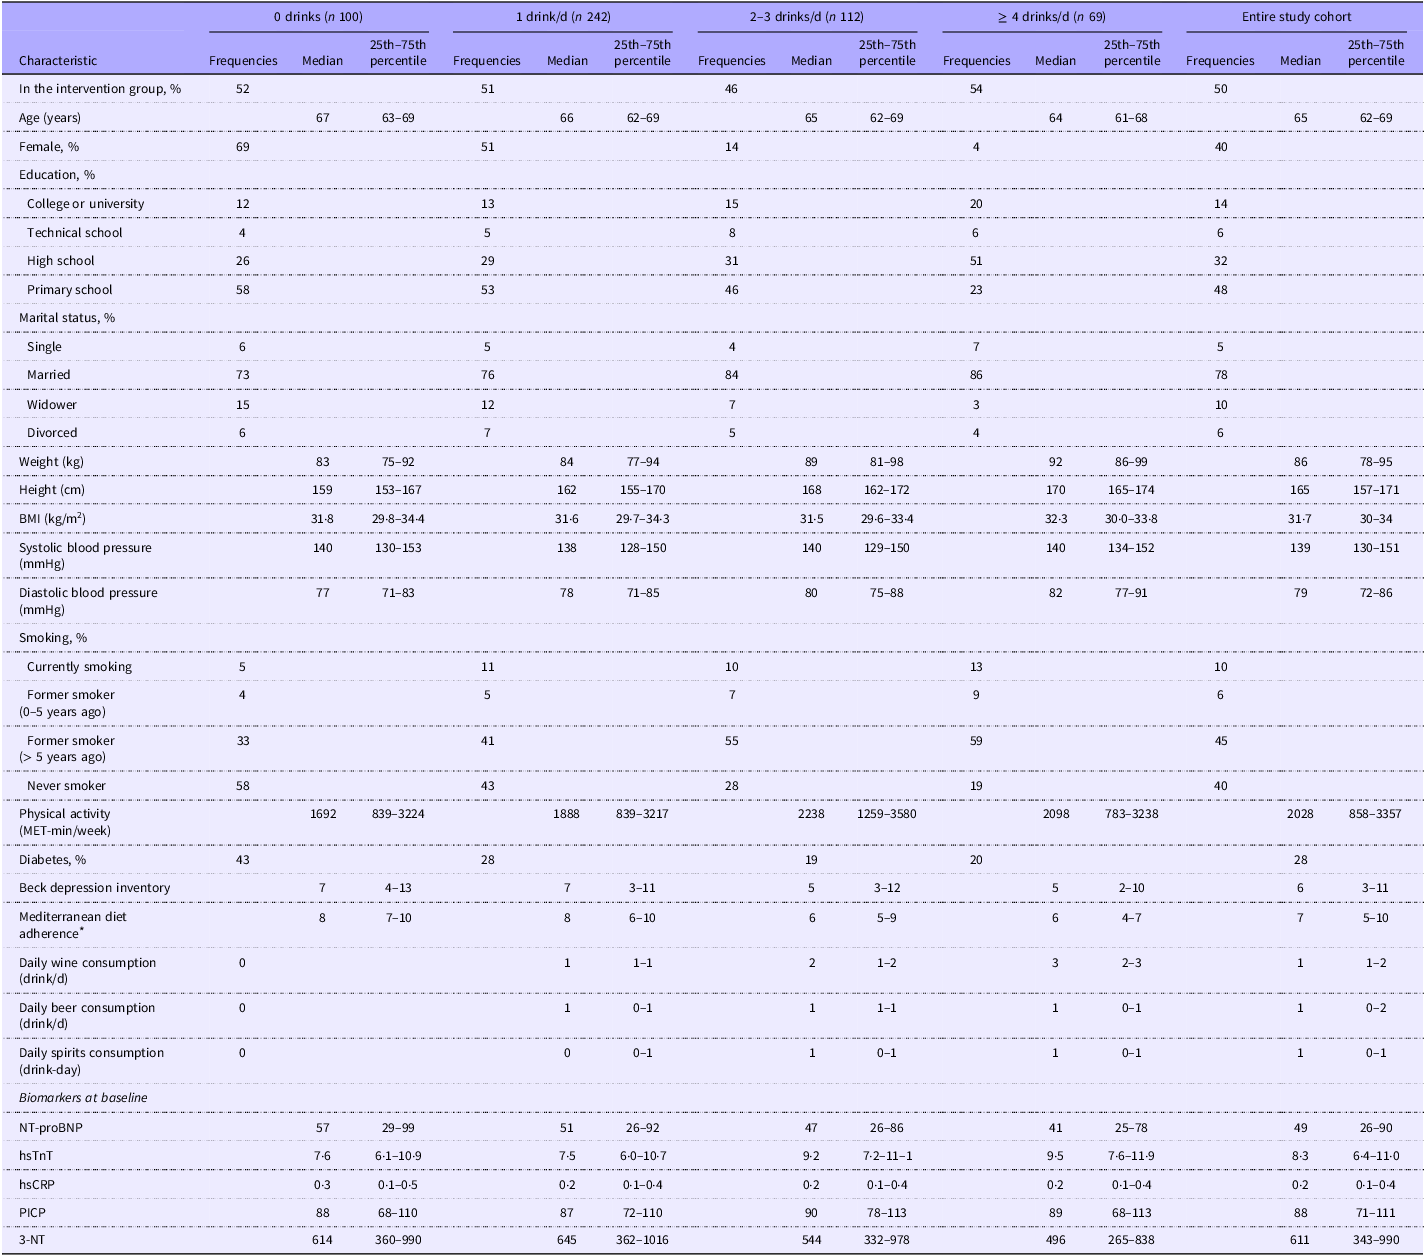
Of the 523 participants included in this study, 40 % were female and the mean age (sd) was 65 (5) years. Heavy drinkers were more likely to be male, more educated and also more likely to have previously smoked or be currently smoking (Table 1). Red wine was the preferred drink of choice.
Baseline characteristics of study participants by baseline daily alcohol consumption (1 drink = 14 grams of pure alcohol), PREDIMED-Plus study

Table 1. Long description
The table compares baseline characteristics of study participants by their daily alcohol consumption, divided into four groups: 0 drinks, 1 drink, 2-3 drinks, and 4 or more drinks. The table has 23 rows and 11 columns. Column headers include characteristics, 0 drinks (n 100), 1 drink (n 242), 2-3 drinks (n 112), 4 or more drinks (n 69), and entire study cohort. Row labels include age, female, education, marital status, weight, height, BMI, systolic blood pressure, diastolic blood pressure, smoking, physical activity, diabetes, Beck depression inventory, Mediterranean diet adherence, daily wine consumption, daily beer consumption, daily spirits consumption, and biomarkers at baseline. Each row provides frequencies, median, and 25th-75th percentile values for each group. Notable trends include higher percentages of males and more educated individuals in the heavier drinking groups, as well as higher rates of smoking. The table also shows variations in physical activity, diabetes prevalence, and biomarker levels across different drinking groups.
MET, metabolic equivalents of task, NT-proBNP, N-terminal pro-B-type natriuretic protein, hsTnT, high-sensitivity troponin-T, hsCRP, high-sensitivity C-reactive protein, 3-NT, 3-nitrotyrosine, PICP, procollagen type 1 carboxy-terminal propeptide.
* Sum of 16 questions concerning adherence to the energy-reduced Mediterranean diet. Does not include alcohol intake.
Presented as either median (25th percentile–75th percentile) for continuous measures or as frequencies for categorical variables.
1 drink: 1–14 grams.
2–3 drinks: 15–42 grams.
4 or more drinks: 43 grams and more.
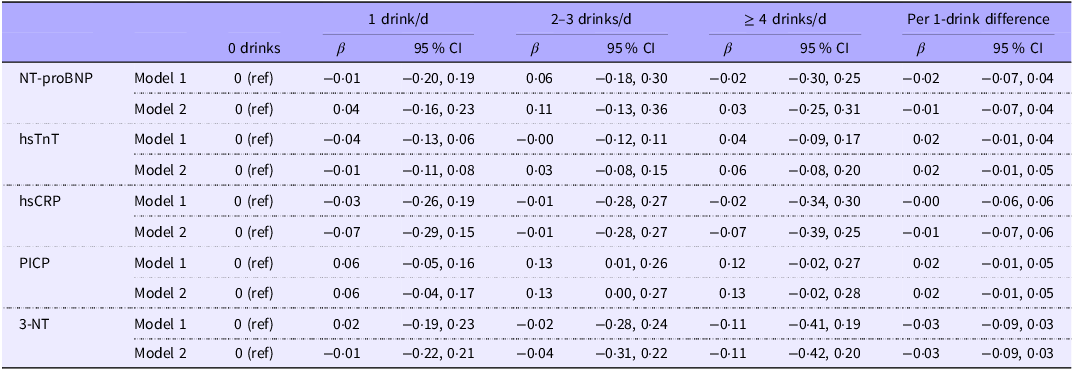
Examination of cross-sectional associations of alcohol consumption with log-transformed biomarkers showed higher, but non-significant concentrations of PICP in those with higher alcohol consumption (β: 0·13, 95 % CI: −0·02, 0·28) (Table 2). Overall, there were no associations present between baseline alcohol consumption and other baseline biomarkers.
Association of baseline alcohol consumption with concentrations of log-transformed biomarkers at baseline, PREDIMED-Plus study

Table 2. Long description
The table presents the association of baseline alcohol consumption with concentrations of log-transformed biomarkers at baseline in the PREDIMED-Plus study. It includes data for different biomarkers such as NT-proBNP, hsTnT, hsCRP, PICP, and 3-NT across various levels of alcohol consumption (0 drinks, 1 drink per day, 2-3 drinks per day, and 4 or more drinks per day). The table also provides per 1-drink difference values. Each biomarker is analyzed using two models. Row 1: NT-proBNP Model 1 0 (ref), -0.01, -0.20 to 0.19, 0.06, -0.18 to 0.30, -0.02, -0.30 to 0.25, -0.02, -0.07 to 0.04. Row 2: NT-proBNP Model 2 0 (ref), 0.04, -0.16 to 0.23, 0.11, -0.13 to 0.36, 0.03, -0.25 to 0.31, -0.01, -0.07 to 0.04. Row 3: hsTnT Model 1 0 (ref), -0.04, -0.13 to 0.06, -0.00, -0.12 to 0.11, 0.04, -0.09 to 0.17, 0.02, -0.01 to 0.04. Row 4: hsTnT Model 2 0 (ref), -0.01, -0.11 to 0.08, 0.03, -0.08 to 0.15, 0.06, -0.08 to 0.20, 0.02, -0.01 to 0.05. Row 5: hsCRP Model 1 0 (ref), -0.03, -0.26 to 0.19, -0.01, -0.28 to 0.27, -0.02, -0.34 to 0.30, -0.00, -0.06 to 0.06. Row 6: hsCRP Model 2 0 (ref), -0.07, -0.29 to 0.15, -0.01, -0.28 to 0.27, -0.07, -0.39 to 0.25, -0.01, -0.07 to 0.06. Row 7: PICP Model 1 0 (ref), 0.06, -0.05 to 0.16, 0.13, 0.01 to 0.26, 0.12, -0.02 to 0.27, 0.02, -0.01 to 0.05. Row 8: PICP Model 2 0 (ref), 0.06, -0.04 to 0.17, 0.13, 0.00 to 0.27, 0.13, -0.02 to 0.28, 0.02, -0.01 to 0.05. Row 9: 3-NT Model 1 0 (ref), 0.02, -0.19 to 0.23, -0.02, -0.28 to 0.24, -0.11, -0.41 to 0.19, -0.03, -0.09 to 0.03. Row 10: 3-NT Model 2 0 (ref), -0.01, -0.22 to 0.21, -0.04, -0.31 to 0.22, -0.11, -0.42 to 0.20, -0.03, -0.09 to 0.03.
NT-proBNP, N-terminal pro-B-type natriuretic protein, hsTnT, high-sensitivity troponin-T, hsCRP, high-sensitivity C-reactive protein, PICP, procollagen type 1 carboxy-terminal propeptide, 3-NT, 3-nitrotyrosine.
Model 1: multiple linear regression adjusted for age, sex and education.
Model 2: multiple linear regression adjusted for age, sex, education, marital status, smoking, physical activity, height, BMI, systolic and diastolic blood pressure, diabetes, depressive symptoms, diet adherence, cholesterol medication and antihypertensive medication.
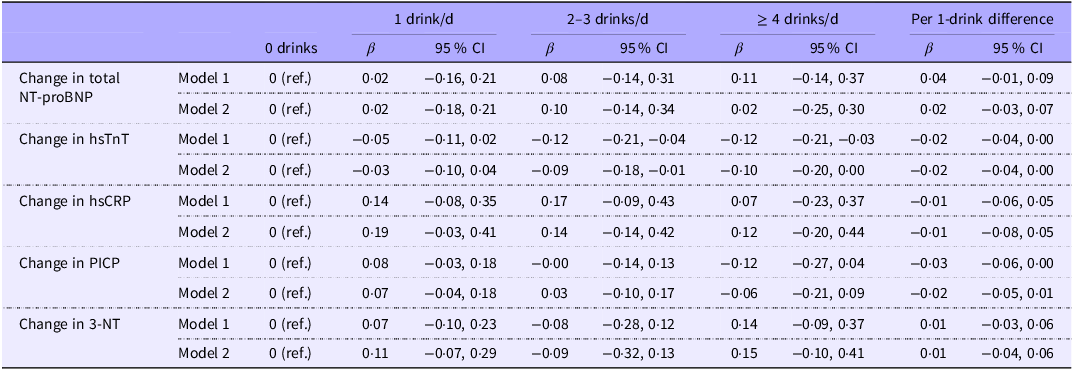
Longitudinally, higher baseline alcohol consumption was associated with smaller increases in hsTnT concentration (β for 5-year change: −0·10, 95 % CI: −0·20, 0·00 comparing ≥ 4 drinks/d to non-drinkers) (Table 3 and online Supplemental Figure 1). Associations showed similar patterns when visit was modelled as a categorical variable in the mixed models (online Supplemental Table 2).
Association of baseline alcohol consumption with 5-year change in log-transformed biomarkers from baseline to year 5, PREDIMED-Plus study

Table 3. Long description
The table presents the association of baseline alcohol consumption with 5-year changes in log-transformed biomarkers. It includes data for different levels of alcohol consumption: 0 drinks, 1 drink per day, 2-3 drinks per day, and 4 or more drinks per day. The table is divided into rows for different biomarkers: Change in total NT-proBNP, Change in hsTnT, Change in hsCRP, Change in PICP, and Change in 3-NT. Each biomarker row is further divided into Model 1 and Model 2. The columns show the beta values and 95% confidence intervals for each level of alcohol consumption, as well as the per 1-drink difference. For example, in the row for Change in total NT-proBNP under Model 1, the beta value for 0 drinks is the reference, while for 1 drink per day it is 0.02 with a 95% CI of -0.16 to 0.21. Similar data is presented for other biomarkers and models.
NT-proBNP, N-terminal pro-B-type natriuretic protein, hsTnT, high-sensitivity troponin-T, hsCRP, high-sensitivity C-reactive protein, 3-NT, 3-nitrotyrosine, PICP, procollagen type 1 carboxy-terminal propeptide.
Model 1: mixed linear model adjusted for age, sex, education, intervention group and interaction of all covariates with time. Time is modelled in 5-year increments.
Model 2: mixed linear model adjusted for age, sex, education, intervention group, marital status, smoking, physical activity, height, BMI, systolic and diastolic blood pressure, diabetes, depression, diet adherence, cholesterol medication use, antihypertensive medication use and interaction of all covariates with time. Time is modelled in 5-year increments.
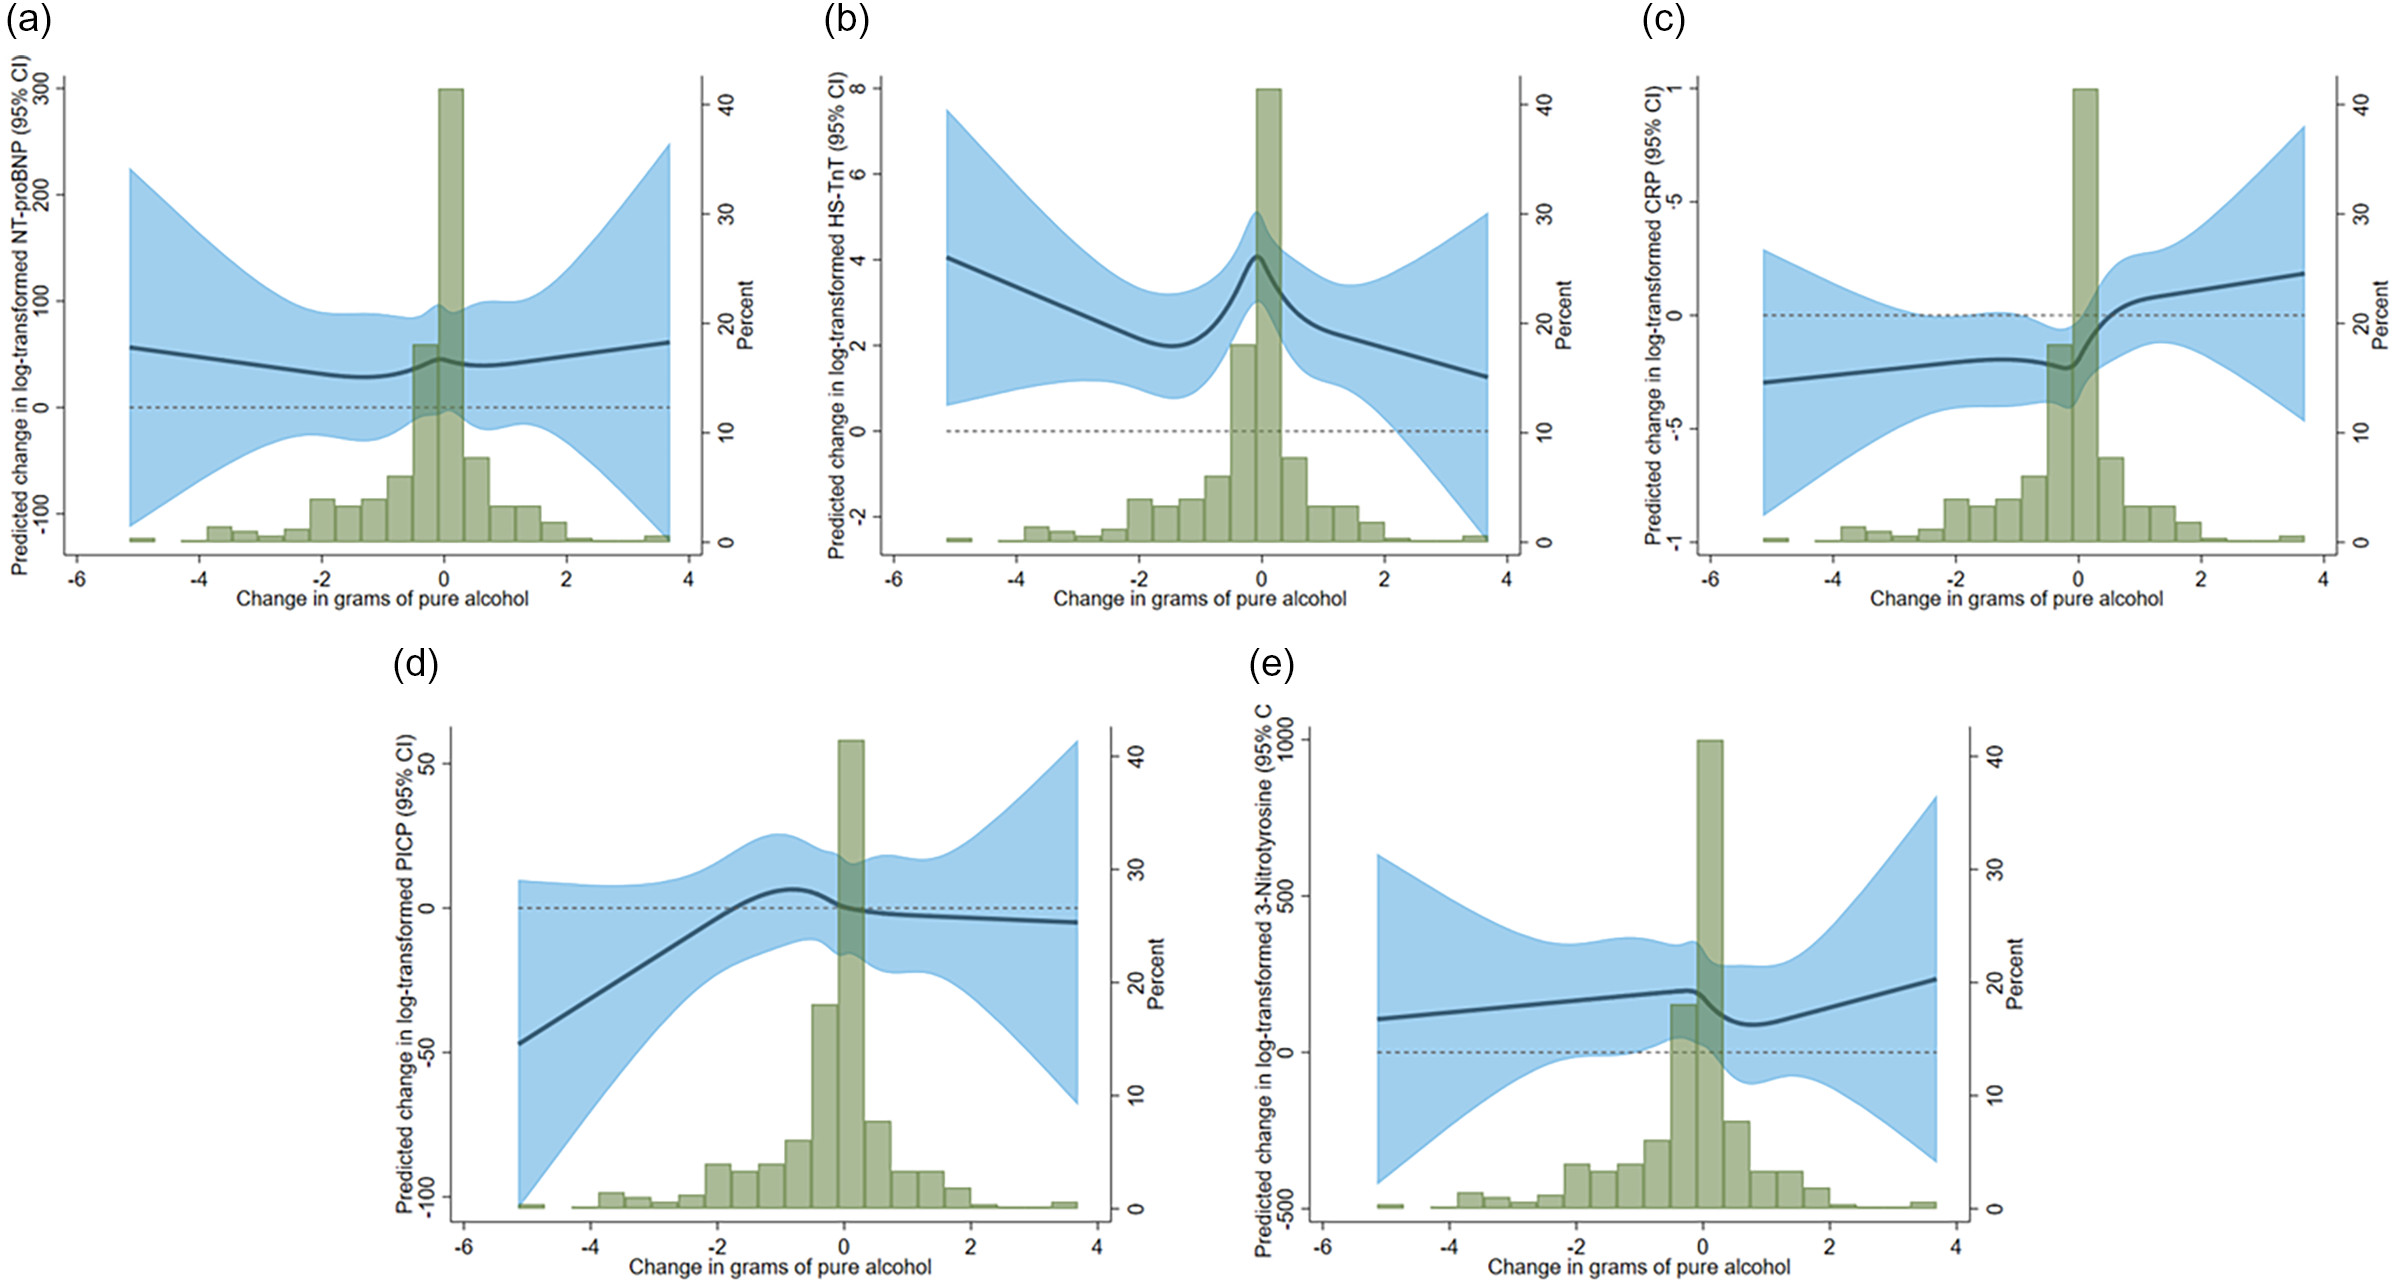
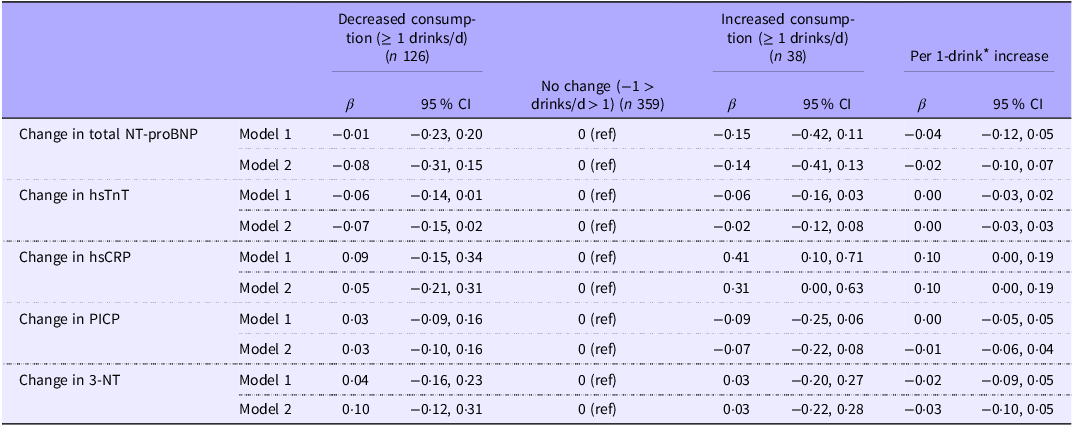
In an analysis comparing those who increased their drinking amount to those who stayed the same over time, increasing alcohol consumption was associated with increases in hsCRP (β: 0·31, 95 % CI: 0·00, 0·63), but not with other biomarkers (Figure 2 and Table 4).
Associations of change in alcohol over 5 years modelled as restricted cubic splines with change in biomarkers, using the median change in alcohol consumption as the reference point. (a) NT-proBNP, (b) Hs-TnT, (c) CRP, (d) PICP, (e) 3-NT. Multiple linear regression models adjusted for age, sex, education and intervention group.

Association of changes in alcohol consumption with change in circulating log-transformed biomarkers from baseline to year 5, PREDIMED-Plus study

Table 4. Long description
The table presents data on the association of changes in alcohol consumption with changes in circulating log-transformed biomarkers from baseline to year 5 in the PREDIMED-Plus study. The table has 5 rows and 10 columns. Column headers are: Decreased consumption (>= 1 drinks/d) (n 126), 95% CI, No change (-1 > drinks/d > 1) (n 359), Increased consumption (>= 1 drinks/d) (n 38), 95% CI, Per 1-drink increase, 95% CI. Row labels are: Change in total NT-proBNP Model 1, Change in total NT-proBNP Model 2, Change in hsT Model 1, Change in hsT Model 2, Change in hsCRP Model 1, Change in hsCRP Model 2, Change in PICP Model 1, Change in PICP Model 2, Change in 3-NT Model 1, Change in 3-NT Model 2. Row 1: Decreased consumption (>= 1 drinks/d) (n 126), -0.01; 95% CI, -0.23, 0.20; No change (-1 > drinks/d > 1) (n 359), 0 (ref); Increased consumption (>= 1 drinks/d) (n 38), -0.15; 95% CI, -0.42, 0.11; Per 1-drink increase, -0.04; 95% CI, -0.12, 0.05. Row 2: Decreased consumption (>= 1 drinks/d) (n 126), -0.08; 95% CI, -0.31, 0.15; No change (-1 > drinks/d > 1) (n 359), 0 (ref); Increased consumption (>= 1 drinks/d) (n 38), -0.14; 95% CI, -0.41, 0.13; Per 1-drink increase, -0.02; 95% CI, -0.10, 0.07. Row 3: Decreased consumption (>= 1 drinks/d) (n 126), -0.06; 95% CI, -0.14, 0.01; No change (-1 > drinks/d > 1) (n 359), 0 (ref); Increased consumption (>= 1 drinks/d) (n 38), -0.06; 95% CI, -0.16, 0.03; Per 1-drink increase, -0.03; 95% CI, -0.03, 0.02. Row 4: Decreased consumption (>= 1 drinks/d) (n 126), -0.07; 95% CI, -0.15, 0.02; No change (-1 > drinks/d > 1) (n 359), 0 (ref); Increased consumption (>= 1 drinks/d) (n 38), -0.02; 95% CI, -0.12, 0.08; Per 1-drink increase, -0.03; 95% CI, -0.03, 0.03. Row 5: Decreased consumption (>= 1 drinks/d) (n 126), 0.09; 95% CI, -0.15, 0.34; No change (-1 > drinks/d > 1) (n 359), 0 (ref); Increased consumption (>= 1 drinks/d) (n 38), 0.41; 95% CI, 0.10, 0.71; Per 1-drink increase, 0.10; 95% CI, 0.00, 0.19. Row 6: Decreased consumption (>= 1 drinks/d) (n 126), 0.05; 95% CI, -0.21, 0.31; No change (-1 > drinks/d > 1) (n 359), 0 (ref); Increased consumption (>= 1 drinks/d) (n 38), 0.31; 95% CI, 0.00, 0.63; Per 1-drink increase, 0.10; 95% CI, 0.00, 0.19. Row 7: Decreased consumption (>= 1 drinks/d) (n 126), 0.03; 95% CI, -0.09, 0.16; No change (-1 > drinks/d > 1) (n 359), 0 (ref); Increased consumption (>= 1 drinks/d) (n 38), -0.09; 95% CI, -0.25, 0.06; Per 1-drink increase, -0.05; 95% CI, -0.05, 0.05. Row 8: Decreased consumption (>= 1 drinks/d) (n 126), 0.03; 95% CI, -0.10, 0.16; No change (-1 > drinks/d > 1) (n 359), 0 (ref); Increased consumption (>= 1 drinks/d) (n 38), -0.07; 95% CI, -0.22, 0.08; Per 1-drink increase, -0.01; 95% CI, -0.06, 0.04. Row 9: Decreased consumption (>= 1 drinks/d) (n 126), 0.04; 95% CI, -0.16, 0.23; No change (-1 > drinks/d > 1) (n 359), 0 (ref); Increased consumption (>= 1 drinks/d) (n 38), 0.03; 95% CI, -0.20, 0.27; Per 1-drink increase, -0.02; 95% CI, -0.09, 0.05. Row 10: Decreased consumption (>= 1 drinks/d) (n 126), 0.10; 95% CI, -0.12, 0.31; No change (-1 > drinks/d > 1) (n 359), 0 (ref); Increased consumption (>= 1 drinks/d) (n 38), 0.03; 95% CI, -0.22, 0.28; Per 1-drink increase, -0.03; 95% CI, -0.10, 0.05.
NT-proBNP, N-terminal pro-B-type natriuretic protein, hsTnT, high-sensitivity troponin-T, hsCRP, high-sensitivity C-reactive protein, 3-NT, 3-nitrotyrosine, PICP, procollagen type 1 carboxy-terminal propeptide.
Model 1: mixed linear model adjusted for age, sex, education, intervention group and interaction of all covariates with time. Time is modelled in 5-year increments.
Model 2: mixed linear model adjusted for baseline alcohol consumption, age, sex, education, intervention group, marital status, smoking, physical activity, height, BMI, systolic and diastolic blood pressure, diabetes, depression, diet adherence, cholesterol medication use, antihypertensive medication use and interaction of all covariates with time. Time is modelled in 5-year increments.
* 1 drink = 14 grams of alcohol.
There was no evidence of differences between men and women in the baseline associations of alcohol consumption and cardiac biomarkers (online Supplemental Table 3). When looking at change in biomarkers over time, heavy drinking was associated with decreased hsTnT (β: −0·13, 95 % CI: −0·27, 0·00) and increased 3-NT (β: 0·38, 95 % CI: 0·03, 0·73) in men, but not in women (online Supplemental Table 4). Once again, there was no evidence of statistically significant sex interactions.
Discussion
In this population at high risk of CVD, baseline alcohol consumption was not associated with cardiovascular biomarkers cross-sectionally. However, increases in alcohol consumption over time were associated with higher levels of systemic inflammation, as reflected by hsCRP. In contrast, higher baseline alcohol consumption was associated with smaller increases in hsTnT over follow-up.
A key consideration in interpreting our findings is that alcohol exposure was quantified as average drinks per day. This measure captures cumulative alcohol exposure but does not provide information on drinking patterns, such as frequency of drinking days or episodic heavy drinking. As a result, our findings reflect associations with overall alcohol exposure and do not allow differentiation between regular moderate consumption and intermittent high-intensity intake, which may have distinct biological effects(Reference Nyberg, Batty and Pentti17).
The longitudinal association between increasing alcohol intake and higher hsCRP concentrations suggests that changes in alcohol exposure over time may influence systemic inflammatory pathways. Alcohol metabolites may trigger an immune response via oxidative stress(Reference Tharmalingam, Gangadaran and Rajendran18) and have been shown to alter ion channel activity in the heart(Reference Voskoboinik and Marcus19). This chronic low-grade inflammation is a well-established contributor to CVD and has been implicated in the development and progression of AF(Reference Sinner, Stepas and Moser20). Our findings are consistent with prior evidence linking higher alcohol consumption to increased inflammatory activity(Reference Oliveira, Rodriguez-Artalejo and Lopes21) and suggest that increases in average intake, even within a population undergoing lifestyle intervention, may adversely affect inflammatory status.
Moderate-to-heavy drinkers experienced smaller increases in hsTnT compared with abstainers over the 5-year follow-up period. Changes in drinking behaviour did not appear to impact these findings. While counterintuitive, our results seem to line up with findings from the Atherosclerosis Risk in Communities cohort, where moderate drinkers were less likely to experience incident increases in hsTnT compared with never drinkers(Reference Lazo, Chen and McEvoy22); researchers found a similar effect in former drinkers compared with never drinkers. PREDIMED-Plus did not collect data on drinking behaviour before the start of the trial, and heavy drinkers (> 6 drinks/d) were excluded from the study; thus, we cannot readily replicate findings in former drinkers. In addition, the absence of information on prior drinking history and patterns limits the ability to determine whether this finding reflects differences in long-term exposure, residual confounding or selection effects within this cohort. Therefore, this result should be interpreted cautiously.
Notably, we did not observe consistent associations between alcohol consumption and biomarkers of fibrosis (PICP), oxidative stress (3-NT),or myocardial stress (N-terminal pro-B-type natriuretic protein). These findings suggest that, within the range of alcohol intake observed in this cohort, average exposure may have a more detectable relationship with inflammatory processes than with other pathways, although limited statistical power and measurement constraints may also contribute.
Strengths of this study include having a well-characterised cohort nested in a large trial with excellent retention and alcohol and biomarker data available from multiple visits over the course of 5 years and the availability of information on multiple potential confounders. We must also, however, address some of the limitations of this study. Most importantly, the lack of detailed information on drinking patterns limits the interpretation of the findings. Average alcohol intake does not distinguish between different consumption behaviours, such as regular moderate drinking v. episodic heavy drinking, which may have different physiological effects. Consequently, our results isolate associations with cumulative exposure but cannot attribute observed changes in biomarkers to specific drinking patterns. Also, PREDIMED-Plus did not collect information on past drinking behaviour, which may be biasing our current estimates, as we cannot differentiate between lifelong abstainers and those who recently started abstaining. In addition, though the FFQ has been previously validated, they are still dependent on participant recall, which may introduce some degree of misclassification in our study. Finally, generalisability of these findings to other populations, for example those at lower cardiovascular risk, is uncertain.
Future studies should incorporate more granular assessment of alcohol consumption, including frequency of drinking, quantity per occasion, identification of binge drinking episodes and timing of intake. Repeated short-term assessments or ecological momentary approaches may improve characterisation of within-person variability, and the use of objective biomarkers of alcohol exposure could reduce misclassification. Such approaches would enable a more precise evaluation of how different drinking patterns influence biological pathways relevant to CVD and AF.
Conclusion
In this population of individuals at high cardiometabolic risk, baseline alcohol consumption was not cross-sectionally associated with circulating biomarkers of AF-related pathways. However, higher baseline alcohol intake was associated with smaller increases in hsTnT over follow-up while increases in alcohol intake over time were associated with higher levels of systemic inflammation. These results provide longitudinal evidence linking changes in alcohol exposure to inflammatory processes in a high-risk population, within the constraints of the available exposure assessment.
Supplementary material
For supplementary material/s referred to in this article, please visit https://doi.org/10.1017/S0007114526107922
Acknowledgements
This study was supported by NIH/NHLBI under award numbers R01HL137338 and K24HL148521. The PREDIMED-Plus trial was supported by the European Research Council (Advanced Research Grant 2014–2014, number 340918 awarded to M.A.M.-G. as principal investigator of the trial) and by the official funding agency for biomedical research of the Spanish Government, Instituto de Salud Carlos III ([Carlos III Health Institute], Sevilla, Spain), through the Fondo de Investigación para la Salud, which is co-funded by the European Regional Development Fund PI13/00673, PI13/00492, PI13/00272, PI13/01123, PI13/00462, PI13/00233, PI13/02184, PI13/00728, PI13/01090, PI13/01056, PI14/01722, PI14/0147, PI14/00636, PI14/00972, PI14/00618, PI14/00696, PI14/01206, PI14/01919, PI14/00853, PI14/01374, PI16/00473, PI16/00662, PI16/01873, PI16/01094, PI16/00501, PI16/00533, PI16/00381, PI16/00366, PI16/01522, PI16/01120, PI17/00764, PI17/01183, PI17/00855, PI17/01347, PI17/00525, PI17/01827, PI17/00532, PI17/00215, PI17/01441, PI17/00508, PI17/01732, PI17/00926, PI19/00957, PI19/00386, PI19/00309, PI19/01032, PI19/00576, PI19/00017, PI19/01226, PI19/00781, PI19/01560, PI19/01332, PI20/01802, PI20/00138, PI20/01532, PI20/00456, PI20/00339, PI20/00557, PI20/00886, PI20/01158, the Recercaixa grant 2013ACUP00194, grants from the Consejería de Salud de la Junta de Andalucía PI0458/2013; PS0358/2016, PI0137/2018, the PROMETEO/2017/017 grant from the Generalitat Valenciana, the SEMERGEN grant and FEDER funds CB06/03. Funders had no role in the design, analysis or writing of this article.
This study was performed in line with the principles of the Declaration of Helsinki. The Ethics Committee of Clinical Research of the Department of Health of the Government of Navarra, the Research Ethics Committee of the Balearic Islands and the Basque Country Clinical Research Ethics Committee reviewed and approved this study’s protocol, and all participants have provided written informed consent to be part of the study.
A. A.: Formal analysis – Lead, Methodology – Supporting, Writing – original draft – Equal, Writing – review & editing – Equal; E. T. A.: Methodology – Lead, Writing – review & editing – Equal; D. R.: Methodology – Lead, Writing – review & editing – Equal; Á. M. A-G.: Methodology – Lead, Writing – review & editing – Equal; M. A. M-G.: Writing – review & editing – Equal; L. T-S.: Writing – review & editing – Equal; C. R.: Writing – review & editing – Equal; M. N. M.: Writing – review & editing – Equal; L. L.: Writing – review & editing – Equal; V. S.: Writing – review & editing – Equal; J. S-S.: Writing – review & editing – Equal; M. F. C.: Writing – review & editing – Equal; A. A.: Conceptualisation – Equal, Methodology – Lead, Writing – original draft-Equal, Writing – review & editing – Equal. All authors read and approved the final manuscript.
The authors declare no conflicts of interest.


 Open access

