Introduction
The incidence of cardiovascular disease (CVD) is strongly predicted by atherosclerosis (ATS)Reference Rahman and Woollard 1 and is the top-1 cause of mortality worldwide.Reference Mc Namara, Alzubaidi and Jackson 2 As long as atherosclerotic plaques do not obstruct more than 40% of the blood vessel lumen, ATS may remain asymptomatic, but when the obstruction proceeds, myocardial ischemia may develop with or without significant myocardial necrosis and the latter condition is named unstable angina (UA).Reference Wiviott and Braunwald 3 There is a strong comorbidity between CVD/AST and major depression whereby depressed patients show an increased risk of increased cardiac morbidity and mortality, and CVD patients may show an increased risk of depression.Reference Strik, Honig and Maes 4 - Reference de Melo, Nunes and Anderson 6 The incidence of depression is increased in CVD/ATS patientsReference Hare, Toukhsati and Johansson 7 , and depression is associated with coronary heart diseaseReference Moise, Khodneva and Richman 8 , Reference Raič 9 and UA.Reference Lespérance, Frasure-Smith and Juneau 10
The main pathways causing ATS comprise increased atherogenicity, immune cell dysfunctions, increased oxidative stress, and insulin resistance (IR).Reference Hansson and Hermansson 11 , Reference Li, Li and Li 12 Increased oxidative stress toxicity and especially increased oxidation of low-density lipoprotein cholesterol (LDLc) with consequent IgG-mediated autoimmune responses and lowered antioxidant defenses are important pathways leading to ATS.Reference Leopold and Loscalzo 13 - Reference McMurray, Ray and Abdullah 15 There is now also evidence that major depression is a neuro-immune disorder characterized by immune activation, a chronic low-grade inflammatory state, increased oxidative stress, and lowered antioxidant levels.Reference Maes, Ruckoanich and Chang 5 , Reference Maes 16 Comprehensive reviews showed that shared metabolic, immune-inflammatory, and nitro-oxidative pathways may explain the comorbidity between depression and ATS/CVD.Reference Maes, Ruckoanich and Chang 5 , Reference de Melo, Nunes and Anderson 6
First, increased atherogenicity is not only a hallmark of ATS/UA, but also occurs in major depressionReference Vargas, Nunes and Barbosa 17 – Reference Nunes, de Melo and de Castro 19 as indicated by increased Castelli risk indices 1 and 2 and an increased atherogenic index of plasma (AIP) with lowered levels of high-density lipoprotein cholesterol (HDLc) and elevated triglyceride levels.Reference Maes, Ruckoanich and Chang 5 , Reference Oliveira, Kallaur and Lopes 20 Second, increased IR is not only a hallmark of ATS/UA, but also major depression is accompanied by increased IR as measured with the homeostatic model assessment of IR (HOMA-IR). Thus, a recent review and meta-analysis found a small but significant association between IR and depression, although there are also negative findings.Reference de Melo, Nunes and Anderson 6 , Reference Silva, Atlantis and Ismail 21 – Reference Landucci Bonifácio, Sabbatini Barbosa and Gastaldello Moreira 23
Third, ATS/CVD and major depression share a chronically activated immune-inflammatory response system (IRS), as indicated by increased levels of various pro-inflammatory cytokines, including interleukin-6 (IL-6), increased production of reactive oxygen and nitrogen species (RONS), and nitro-oxidative stress toxicity (NOSTOX) as indicated by higher levels of oxidized LDLc, malondialdehyde, and autoimmunity directed against oxidative specific epitopes, and lowered levels of antioxidants with immune regulatory activities, for example, zinc.Reference Maes, Ruckoanich and Chang 5 As such, the onset of depression in ATS/CVD may be explained by the combined activities of IRS, RONS, and NOSTOX. When present, depression may increase risk toward ATS/CVD via increased atherogenicity, RONS, and ROSTOX.Reference Maes, Ruckoanich and Chang 5 , Reference de Melo, Nunes and Anderson 6
Recently, we found that ATS may be discriminated from normal controls by using a combination of different biomarkers in machine learning models, namely an increased HOMA-IR index, IL-6, IL-10 (a negative immune regulatory cytokine), β-endorphin, copper and magnesium, and lower zinc.Reference Qazmooz, Smeism and Mousa 24 Moreover, ATS with UA was significantly discriminated from ATS without UA by increased levels of triglycerides (TG), IR, IL-10, β-endorphin, and mu-opioid receptors (MOR), and lowered vitamin D3, another antioxidant.Reference Qazmooz, Smeism and Mousa 24 In this respect, it is interesting to note that increased IL-10 may play a protective role in ATS and in major depression.Reference Mallat, Besnard and Duriez 25 , Reference Maes and Carvalho 26 Indeed, IL-10 is a major component of the compensatory immune regulatory system (CIRS), which attenuates the IRS in chronic immune disorders including ATS and major depression.Reference Mallat, Besnard and Duriez 25 , Reference Maes and Carvalho 26 Lowered vitamin D3 is not only detected in CVD/ATS but also in major depression and perinatal depression,Reference Trujillo, Vieira and Lepsch 27 , Reference Sotoudeh, Raisi and Amini 28 while vitamin D supplementation had a protective effects on depression with a moderate effect size.Reference Vellekkatt and Menon 29 Increased levels of β-endorphin and MOR not only occur in CVD/UA, but also in major depression.Reference Al-Fadhel, Al-Hakeim and Al-Dujaili 30 – Reference Callaghan, Rouine and O’Mara 32 These endogenous opioid system (EOS) peptides have immune-regulatory effects and, therefore, increased levels may exert CIRS functions in both CVD/ATS and major depression.Reference Qazmooz, Smeism and Mousa 24 , Reference Al-Fadhel, Al-Hakeim and Al-Dujaili 30 Finally, a recent meta-analysis showed that elevated copper levels are associated with major depression and are involved in the pathophysiology of that illness.Reference Ni, You and Chen 33
Nevertheless, no studies have examined whether UA is accompanied by depressive symptoms and whether their association may be explained by shared pathways including increased atherogenicity (as assessed with AIP and Castelli risk 1 indices) and IR (as assessed with an increased HOMA-IR index), IRS (elevated IL-6) and CIRS (elevated IL-10) activation, lowered levels of antioxidants such as zinc and vitamin D, aberrations in the EOS as indicated by increased β-endorphin and MOR levels, and increases in copper.
Hence, this study was conducted to examine whether increased depressive ratings occur in ATS or UA and whether the abovementioned biomarkers of ATS/UA are also associated with severity of depression in ATS/UA, thereby suggesting that shared pathways may underpin both ATS/UA and depression due to that condition.
Participants and Methods
Participants
This study recruited 120 ATS patients and 58 normal volunteers. All participants were admitted to the Sadr-Teaching Hospital, Najaf Governorate, Iraq, from November 2019 to January 2020. We made the diagnosis of ATS employing the ICD-10 criteria (CM-170) based on a full medical history, physical examination, blood pressure estimations, echocardiography, Doppler sonography, and electrocardiogram. UA was diagnosed using the guidelines of the American College of Cardiology Foundation/American Heart Association Task ForceReference Anderson, Adams and Antman 34 , and patients were classified into class III (n = 34) or IV (n = 26) according to Canadian Cardiovascular Society criteria.Reference Campeau 35 As such, the ATS study sample was divided into three subgroups, namely ATS without UA, UA class III, and UA class IV.
The European Society of Hypertension and the European Society of Cardiology guidelines were used to make the diagnosis of hypertension.Reference Mancia, Fagard and Narkiewicz 36 Hypertension patients had blood pressure measurements of >140/95 mmHg using a conventional sphygmomanometer in a seated posture and with the arm in the horizontal position after 15 minutes of quiet sitting. The World Health Organization criteria 37 , 38 were used to make the diagnosis of type 2 diabetes mellitus (T2DM) when fasting plasma glucose (FPG) ≥7.0 mM and glycated hemoglobin >6.5%.
The 58 apparently healthy controls (HC) were age- and sex-matched to the ATS groups and were free from ATS/CVD/UA. Exclusion criteria for patients and controls were renal or hepatic diseases, myocardial infarction, stroke, cancer, (auto)immune disorders, neuroinflammatory and neurodegenerative disorders, and subjects with an albumin/creatinine ratio >30 mg/g and serum C-reactive protein (CRP) > 6 mg/dL, thereby excluding subjects with overt inflammation. We excluded subjects with psychiatric axis-I diagnosis according to DSM-V criteria 39 except subjects with a “mood disorder due to a general medical condition, depressed mood, or diminished interest or pleasure in all or almost all activities.” All patients had serum FBG <25 mmol/L and fasting insulin <400 pmol/L to comply with the necessities of the HOMA calculator program and TG <4.5 mmol/L to comply with the Friedewald’s formula requirements. Written consent was obtained from all subjects before participating in the study, which was approved from the IRB of the University of Kufa (487/2019) in compliance with the International Guidelines for Human Research protection as required by the Declaration of Helsinki.
Methods
Depression was measured using the 1996 revision of the Beck Depression Inventory-II (BDI-II).Reference Beck, Steer and Ball 40 This self-rating depression scale has high internal consistency and high test-retest reliability, and shows a strong correlation with the Hamilton Depression Rating Scale.Reference Beck, Steer and Ball 40 The BDI-II score can be used as a cost-effective instrument to detect depression including in patients with medical conditions.Reference Wang and Gorenstein 41 The items of the BDI-II scale cover all symptoms of the DSM-IV diagnostic criteria for major depression. We computed the total score of all items as an overall index of severity of illness. The total BDI-II score was dichotomized using two different cutoff values, namely ≥19 and ≥29. The first threshold value delineates moderate depression (vs no + minimal + mild depression), and the second threshold value delineates severe depression (vs no + minimal + mild + moderate depression).Reference Beck, Steer and Ball 40 We also computed BDI-II subdomain scores, namely a) key depressive symptoms (sum of the items sadness, pessimism, loss of pleasure, and loss of interest), b) lowered self-esteem (sum of the items past failure, guilty feelings, punishment feelings, self-dislike, self-criticalness, and worthlessness), and c) physiosomatic symptoms (sum of the items loss of energy, changes in sleeping pattern, changes in appetite, concentration difficulties, tiredness or fatigue, and loss of interest in sex).
Fasting blood samples (10 mL) were drawn in the morning from all subjects after an overnight fast. After complete clotting, the blood was separated by centrifugation at 3000 rpm for 10 minutes and then stored at −80oC until analysis. Total cholesterol (TC), TG, calcium, magnesium, glucose, albumin, urea, and creatinine were measured spectrophotometrically by kits supplied by Biolabo (Maizy, France). Serum HDLc was measured after precipitation of all other lipoproteins by a reagent consisting of sodium phosphotungstate and magnesium chloride, and the cholesterol levels in the supernatant were measured spectrophotometrically. LDLc was computed from Friedewald’s formula: LDLc = TC − HDLc − TG/2.19. Serum CRP was measured by latex agglutination principles using a kit supplied by Spinreact (Barcelona, Spain). Copper and zinc were measured in serum spectrophotometrically by kits supplied by Giesse Diagnostics (Rome, Italy). Commercial ELISA sandwich kits were used to measure serum IL-6 and β-endorphin (Melsin Medical Co., Jilin, China), IL-10 (Elabscience, Hubei, China), insulin (DRG International Inc., NJ, USA), and MOR (Mybiosource Inc. San Diego, California, USA). The sensitivities of the kits were for IL-6: 0.1 pg/mL, IL-10: 4.69 pg/mL, β-endorphin: 0.1 pg/mL, insulin: 12.22 pmol/L, and MOR: 7.18 pg/mL. The intra-assay coefficients of variation (precision within-assay) of all assays were less than 10%.
As explained previously,Reference Flauzino, Pereira and Alfieri 42 , Reference Bonifácio, Barbosa and Moreira 43 we computed different atherogenic and IR indices using z unit-weighted composite scores, namely z TC − z HDLc (zTC-zHDLc), reflecting the Castelli risk index; z TG − z HDLc (zTG-zHDLc), reflecting AIP; and z glucose + z insulin, reflecting IR. These composite scores are strongly correlated with the indices they are intended to reflectReference Flauzino, Pereira and Alfieri 42 , Reference Bonifácio, Barbosa and Moreira 43 Body mass index (BMI) was computed as body weight (in kilograms) divided by length (in meter).Reference Mc Namara, Alzubaidi and Jackson 2
Statistical Analysis
Continuous variables are displayed as mean ± standard deviation (or standard error), and normality of distribution of continuous data was tested using the Kolmogorov–Smirnov test. Comparisons of continuous variables between study groups were performed using analysis of variance and differences between nominal variables using analysis of contingency tables (using χ2 test). Univariate generalized linear model (GLM) analysis was employed to examine the relationships among the biomarkers and diagnostic classes while controlling for covariates including age, BMI, tobacco use disorder (TUD), and sex. Effect sizes were computed using partial η2 values, and GLM-generated estimated marginal mean values were computed. We conducted protected pairwise comparisons among treatment means and used P-correction for false discovery rate to adjust for type 1 errors due to multiple comparisons.Reference Benjamini and Hochberg 44 Binary logistic regression analysis was used to delineate the essential explanatory variables that predict depression (with no depression as reference group). We used multiple regression analysis to predict the BDI-II and subdomain scores using atherogenicity and IR indices, trace elements, and immune and EOS biomarkers as explanatory variables while allowing for the effects of UA, age, sex, BMI, and smoking.
We also conducted multilayer perceptron Neural Network analysis to assess the prediction of increased BDI-II scores (either ≥19 or ≥29) as input variables and the biomarkers as input variables. In this study, we employed an automated feedforward model and employed two hidden layers with up to six nodes and up to 250 epochs with mini-batch training and gradient descent. One consecutive step with no further decrease in the error term was used as the stopping criterion. The study sample was divided into training (46.7%), testing (20%), and holdout (33.3%) samples. Error, relative error, the area under the receiver operating curve (ROC), the confusion matrices, and the importance of the explanatory variables (displayed in an importance chart) were computed. Tests were 2-tailed, and a P-value of .05 was used for statistical significance. All statistical analyses were performed using IBM SPSS windows version 25, 2017.
Partial Least Squares (PLS) path analysis (SmartPLS)Reference Ringle, Da Silva and Bido 45 was employed to assess the causal association between biomarkers, atherogenicity, IR, and the phenome of ATS/UA including the BDI-II score. All variables were entered as single indicators or as latent vectors (LVs) extracted from their reflective manifestations. Complete PLS analysis was conducted using 5000 bootstrap samples when the outer and inner models complied with prespecified quality data, namely a) the model fit SRMR is <0.08, b) LVs have good composite reliability (>0.7), Cronbach’s alpha (>0.7), and rho_A (>0.8), with an average variance extracted >0.5, c) LV loadings are >0.666 at P < .001, d) Blindfolding shows adequate construct cross-validated redundancies and communalities, and e) Monotrait–Heterotrait analysis indicates adequate discriminatory validity. Moreover, Confirmatory Tetrad analysis was used to assess whether the reflective model of the LVs is not misspecified. Differences in the PLS model and pathways between men and women were assessed using permutation and Multi-Group Analysis.
Results
Sociodemographic data
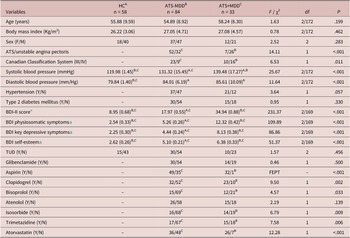
Table 1 shows the sociodemographic data of ATS patients with (AST+MDD) and without depression (AST-MDD) and HC. There were no significant differences in age, sex ratio, body weight, BMI, and TUD between the three study groups. There was a significantly higher incidence of UA and class IV (vs class III) according to the Canadian classification score in the ATS+MDD vs the ATS-MDD group. The systolic blood pressure was significantly different between the three diagnostic groups and increased from controls ➔ ATS-MDD ➔ ATS+MDD. Diastolic blood pressure was significantly higher in ATS patients than in controls. The frequency of hypertension and T2DM was not significantly different between both ATS groups. This table also lists the differences in the drug state among the groups and shows that patients with AST+MDD were more frequently treated with aspirin, atorvastatin, bisoprolol, clopidogrel, isosorbide dinitrate, and trimetazidine than the AST-MDD group.
Sociodemographic, Clinical and Biomarker Data in HC, and Patients with ATS with (ATS+MDD) and Without (ATS-MDD) Depression

Notes: Results are shown as mean (SD). A,B,C: comparisons between group means (significant at P = .05). Depression is defined as a total BDI-II score ≥29.
Abbreviations: ATS, atherosclerosis; BDI, Beck Depression Inventory; FEPT, Fisher’s exact probability test; HC, healthy controls; TUD, tobacco use disorder.
a These data are adjusted for sex, age, and smoking, and shown as mean (SE).
Associations depression groups and biomarkers
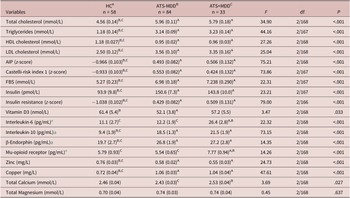
Table 2 shows the measurements of the biomarkers in the study groups divided according to BDI-II scores. Total cholesterol, TG, LDLc, AIP, Castelli-1, FPG, insulin, IR, IL-10, β-endorphin, and copper were significantly higher in ATS patients than in controls. Serum zinc and HDLc levels were significantly lower in the ATS patients in comparison with the control group. Total serum magnesium was not different between the three groups. Serum vitamin D3 was significantly lower in ATS-MDD patients than the control group. MOR and IL-6 were significantly higher in the ATS+MDD group than in the other two study groups. We found that P-correction did not change the significant differences of all biomarkers listed in Table 2 and covarying for the drug state did not change these results.
Measurements of the Biomarkers in HC, and Patients with ATS with (ATS+MDD) and Without (ATS-MDD) Depression

Notes: Results are shown as model-generated estimated marginal mean values after covarying for the effects of age, sex, smoking, and body mass index. Depression is defined as a total Beck Depression Inventory-II score ≥29. Results are shown as mean (SD). A,B,C: comparisons between group means (significant at P < .05).
Abbreviations: AIP, atherogenic index of plasma; ATS, atherosclerosis; FBS, fasting blood sugar; HC, healthy controls; HDL, high-density lipoprotein; Insulin resistance, homeostatic model assessment-insulin resistance index; LDL, low-density lipoprotein.
a These data were processed in Ln transformation, and are adjusted for sex, age, and smoking and shown as mean (SE).
Best predictions of AST+MDD vs ATS-MDD
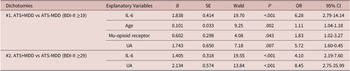
Table 3 shows the outcome of binary logistic regression analyses with AST+MDD as dependent variable (and ATS-MDD as the reference group). The first regression discriminated patients with BDI-II score ≥19 vs BDI-II <19 and showed that four input variables significantly discriminated both groups (χ2 = 66.306, df = 4, P = <.001), namely IL-6, MOR, age, and UA (all positively associated). The Nagelkerke effect size was 0.585, and the accuracy of the classification was 82.9% with a sensitivity of 84.3% and a specificity of 80.9%. The second regression separated ATS patients with BDI-II ≥29 from ATS patients with BDI-II <29 and showed that IL-6 and UA were significant (χ2 = 43.02, df = 2, P = <.001) explanatory variables with a pseudo-R2 Nagelkerke value of 0.442, an overall accuracy of 80.3%, sensitivity of 57.6%, and specificity of 89.3%. Forced entry of the drug state in this regression did not change the significance of these two predictors.
Results of Binary Logistic Regression Analysis with ATS with Depression (ATS+MDD) as a Dependent Variable and ATS Without Depression (ATS-MDD) as a Reference Group

Notes: #1: depression is defined as patients with a BDI-II score ≥19. #2: depression is defined as patients with a BDI-II score ≥29.
Abbreviations: 95% CI, 95% confidence intervals; ATS, atherosclerosis; BDI-II, Beck-Depression Inventory; IL-6, interleukin-6; OR, odds ratio; UA, unstable angina.
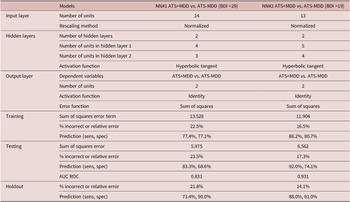
Table 4 shows the results of the most accurate neural network (NN#1) discriminating ATS+MDD from ATS-MDD patients (using BDI ≥29 as a cutoff value). This feedforward network was trained with two hidden layers, with four units in layer 1 and three units in layer 2, and hyperbolic tangent as the activation function in the hidden layers and identity in the output layer. The sum of squares error term was much lower in the testing than in the training sample, and the percentage of incorrect classifications was reasonably constant in the three samples, indicating that the model learned to generalize from the trend and is not overtrained. The area under the ROC was 0.831 with a sensitivity of 71.4%, and specificity of 90.0%. Figure 1 displays the importance chart and shows that IL-6 has the highest predictive power of the model, followed at a distance by MOR, UA, zinc, β-endorphin, and total calcium, and again at a distance by magnesium and AIP.
Results of Neural Networks with ATS with Depression (ATS+MDD) vs ATS Without Depression (ATS-MDD) as Output Variables and Biomarkers as Input Variables

Abbreviations: ATS, atherosclerosis; AUC ROC, area under curve of receiver operating curve; BDI-II, Beck Depression Inventory-II; NN, neural network.
Results of neural network (importance chart) with depression in unstable angina and atherosclerosis (using BDI ≥29 as a cutoff value) as output variables and biomarkers (in z-scores) as input variables.
Abbreviations: AIP, atherogenic index of plasma; IL-6, interleukin-6; IR, insulin resistance; MOR, mu-opioid receptor.

Table 4 also shows the network information and model summaries of NN#2 discriminating ATS+MDD from AST-MDD using BDI-II ≥19 as a cutoff value. This model was trained using two hidden layers, with five units in layer 1 and four units in layer 2, again with hyperbolic tangent and identity as activation functions in the hidden layers and output layer, respectively. The percentage of incorrect classifications was fairly constant in the three sets while the area under the ROC curve was 0.931 with a sensitivity of 88.0% and a specificity of 81.0%. Figure 2 shows that IL-6 has the highest predictive power of the model, followed by β-endorphins, MOR, AIP, zinc, IR, total calcium, and vitamin D3.
Results of neural network (importance chart) with depression in unstable angina and atherosclerosis (using BDI ≥19 as a cutoff value) as output variables and biomarkers (in z-scores) as input variables.
Abbreviations: AIP, atherogenic index of plasma; IL-6, interleukin-6; IR, insulin resistance; MOR, mu-opioid receptor.

Relationships depression scores and biomarkers
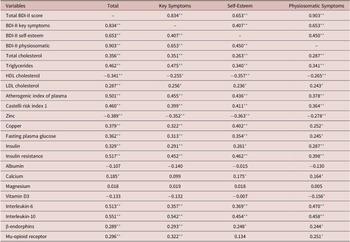
Table 5 shows the intercorrelations between the total score and subdomain scores on the BDI-II and the biomarkers. In the whole study group, the BDI-II scores were significantly correlated with most biomarkers, except albumin, magnesium, and vitamin D3. In ATS patients, the BDI-II total score was significantly correlated with total calcium (r = 0.303, P < .01), IL-6 (r = 0.530, P < .001), IL-10 (r = 0.187, P < .01), and MOR (r = 0.344, P < .001).
Partial Correlations Matrix Between the Total Score on the Beck Depression Inventory-II, Total Score and Subdomains, and Biomarkers

Notes: Shown are partial correlations after adjusting for effects of age, sex, body mass index, and smoking.
Abbreviations: Castelli risk index 1: computed as z-score of total cholesterol—z-score of HDL cholesterol; HDL, high-density lipoprotein; LDL, low-density lipoprotein.
* P < .01.
** P < .001.
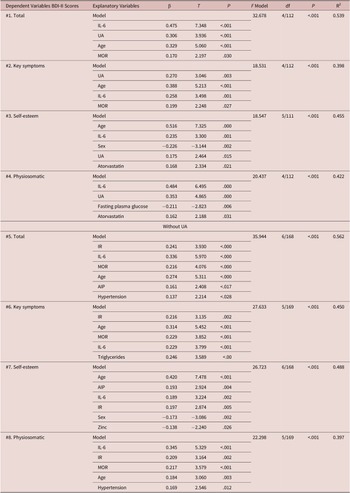
Table 6 shows the results of different multiple regression analyses with the total BDI-II score and symptom domain scores as dependent variables and the biomarkers as explanatory variables while allowing for the effects of age, sex, BMI, UA, and the drug state of the subjects. We found that 53.9% of the variance in total BDI score (regression #10) and 39.8% of the variance in BDI Key symptom score (regression #2) could be explained by age, IL-6, MOR, and UA. Figure 3 shows the partial regression of the BDI-II physiosomatic score on IL-6 after adjusting for the variables listed in Table 6, regression #1. Regression #3 shows that 45.5% of the variance in self-esteem could be explained by IL-6, UA, age, atorvastatin (all positively), and male sex. We found that 42.2% of the variance in BDI-II physiosomatic subscore (regression #4) could be explained by IL-6, UA, and atorvastatin (all positively) and FPG (inversely).
Results of Multiple Regression Analysis with the Total Beck Depression Inventory-II Score and BDI-II Subdomain Scores as Dependent Variables

Abbreviations: AIP, atherogenic index of plasma; IL-6, interleukin-6; IR, insulin resistance; MOR, mu-opioid receptor; UA, unstable angina.
Partial regression of the physiosomatic subdomain of the Beck Depression Inventory score on interleukin (IL)-6.

We reran all multiple regression analyses but now without UA, thereby allowing for other biomarkers to enter in the models. We found that 56.2% of the variance in total BDI score (regression #5) could be explained by IL-6, IR, MOR, UA, hypertension, and age. Up to 45.0% of the variance in BDI key symptoms can be explained by IL-6, IR, MOR, TG, and age (regression #6). Regression #7 found that 48.8% of the variance in self-esteem could be explained by IL-6, IR, AIP, age (all positively), zinc (inversely), and male sex. Finally, we found that 39.7% of the variance in the physiosomatic subdomain score could be explained by IL-6, IR, MOR, age, and hypertension (regression #8).
Results of PLS analysis
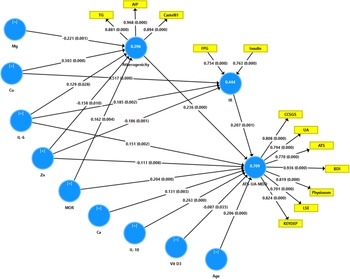
Figure 4 shows a first PLS model which examined the causal paths from different biomarkers ➔ atherogenicity and IR ➔ phenome of ATS/UA and depression whereby each indicator may predict one or more of the downstream LVs, and the atherogenicity and IR LVs may predict the phenome LV (ATS-UA-MDD). Atherogenicity was entered as a reflective LV extracted from AIP, Caselli risk index 1, and triglyceride levels, and IR as a formative model using FPG and insulin. The phenome ATS-UA-MDD was entered as a reflective LV extracted from the total BDI-II score, its three subdomains, ATS, UA, and both CCS UA classes. The overall fit of the model was particularly good with SRMR = 0.038. The construct reliability of the two reflective LVs was adequate: for ATS-UA-MDD LV, Cronbach α = 0.911, rho_A = 0.915, composite reliability = 0.930, and average variance extracted = 0.656; and for the atherogenicity LV: Cronbach α = 0.902, rho_A = 0.905, composite reliability = 0.939, and average variance extracted = 0.838. All loadings on both LVs were >0.701 at P < .0001. Blindfolding showed that all construct cross-validated communalities and redundancies were more than adequate. PLS analysis using 5000 bootstrap samples showed that 70.9% of the variance in the ATS-UA-MDD LV was explained by the regression on the IR and atherogenicity LVs, IL-6, IL-10, zinc, vitamin D3, MOR, calcium, and age. Up to 44.4% of the variance in the IR LV was explained by copper, IL-6, and zinc, and 39.6% of the variance in the atherogenicity LV was explained by magnesium, copper, IL-6, zinc, and MOR. There are specific indirect effects of copper, MOR, magnesium, and zinc on the ATS-UA-MDD LV, which were mediated by atherogenicity, and of copper, IL-6, and zinc mediated by IR. All biomarkers showed significant total effects on the ATS-UA-MDD LV, including magnesium and copper.
Results of a multistep Partial Least Squares analysis with multiple mediators (see the Results section for explanation).
Abbreviations: AIP, atherogenic index of plasma; ATS, atherosclerosis; BDI, Beck Depression Inventory; Ca, calcium; CCSGS, class III/IV unstable angina (UA); Cu, copper; FPG, fasting plasma glucose; IL, interleukin; IR, insulin resistance; KEYDEP, key depressive symptoms of the BDI; LSE, lower self-esteem; Mg, magnesium; MOR, mu-opioid receptor; Physiosom, physiosomatic domain of the BDI; TG, triglycerides; vit, vitamin; Zn, zinc.

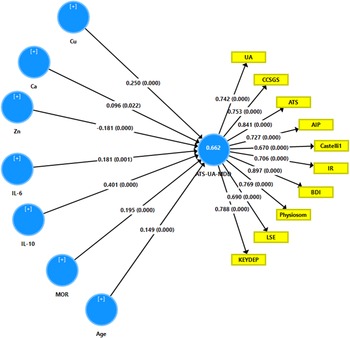
Figure 5 shows a second PLS pathway analysis which considered one output LV extracted from the ATS-UA-MDD LV shown in Figure 5 and in addition, IR, AIP, and Castelli risk index 1. All biomarkers as well as age, sex, BMI, and TUD were entered as single indicators. The overall fit of this PLS model was adequate with SRMR = 0.040. The construct reliability of the ATS-UA-MDD LV was excellent with Cronbach α = 0.918, rho_A = 0.923, composite reliability = 0.932, and AVE = 0.579. All outer model loadings were >0.670 at P < .0001, and all construct cross-validated communalities and redundancies were more than adequate. Confirmatory Tetrad Analysis showed that the model was not misspecified as a reflective model. We found that 66.2% of the variance in the LV was explained by the regression on six biomarkers and age. Permutations and Multigroup Analysis disclosed no significant differences between men and women in this model.
Results of Partial Least Squares analysis (see the Results section for explanation).
Abbreviations: ATS/UA/MDD, an atherosclerosis/unstable angina/depression latent vector extracted from ATS; UA, unstable angina; CCSGS, class III/IV UA; AIP, atherogenic index of plasma; IR, insulin resistance; BDI, Beck Depression Inventory; Physiosom, physiosomatic domain of the BDI; LSE, lower self-esteem; KEYDEP, key depressive symptoms of the BDI; Cu, copper; Ca; calcium; Zn, zinc; IL, interleukin; MOR, mu-opioid receptor.

Association BDI-II scores and ATS/UA/CCS classes III and IV
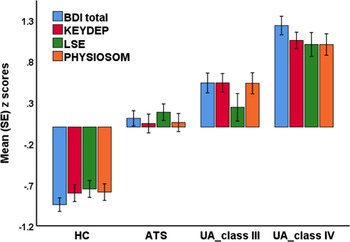
Figure 6 shows a clustered bar graphs with the summaries of the separate BDI-II and subdomain scores in four study groups, namely controls, ATS, UA class III, and UA class IV. Univariate GLM analysis (adjusted for age and sex) showed that the total BDI-II score (F = 86.60, df = 3/169, P < .001), key depressive (F = 47.86, P < .001), lower self-esteem (F = 40.60, P < .001), and physiosomatic (F = 40.17, P < .001) subdomains were significantly different among the four study groups and increased from controls ➔ AST ➔UA class III ➔ UA class IV, except LSE which was not different between ATS and UA class III.
Clustered bar chart with z-scores of the Beck Depression Inventory total score and the BDI subdomains key depression symptoms, low self-esteem, physiosomatic symptoms in healthy controls, atherosclerosis, unstable angina (UA) class III, and UA class IV.

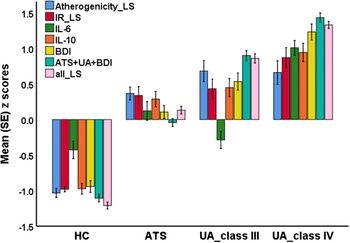
Figure 7 shows the latent variable scores computed using the first PLS analysis comprising latent scores reflecting atherogenicity, IR, ATS+UA+BDI score, and a combination of these LVs (all_LS). We also added IL-6, IL-10 (as most strongly associated with the BDI-II score), and the total BDI score in this clustered bar graph. The total BDI-II, ATS+UA+BDI, and all_LS latent variable scores were significantly different between the four groups. Increased atherogenicity was a hallmark of ATS, increased IR for ATS and UA class IV, increased IL-6 for UA class IV, and increased IL-10 for ATS and UA class IV.
Clustered bar chart with z-scores of latent variable scores (LS) reflecting atherogenicity, IR (insulin resistance), ATS+UA+BDI (LS extracted from atherosclerosis, unstable angina, and Beck Depression Inventory scores), and all three LS combined (all_LS). This bar graph also shows interleukin (IL)-6, IL-10, and the total BDI score.

Discussion
Clinical aspects of the comorbidity of depression and ATS/UA
The first major finding of this study is that there is a strong association between depressive ratings and ATS/UA. As described in the Introduction, there is now evidence that both depression and ATS co-occur with bidirectional associations.Reference Strik, Honig and Maes 4 – Reference Raič 9 Moreover, the present study found significantly increased total and subdomain BDI-II scores in UA patients as compared with patients without UA. These findings extend those of Lesperance et al (2000), who described an association between depression and UA.Reference Lespérance, Frasure-Smith and Juneau 10 The same authors showed that the BDI identified depression in 41.4% of UA patients and that depressed patients showed an increased risk of mortality due to nonfatal myocardial infarction or cardiac death.Reference Lespérance, Frasure-Smith and Juneau 10 The Coronary Psychosocial Evaluation Studies reported that in UA patients, a high BDI score was associated with a significantly increased mortality, 42 months later as compared with patients without depression.Reference Whang, Shimbo and Kronish 46 The American Heart Association, in a recent publication, states that depression predicts a poor prognosis in patients with the acute coronary syndrome.Reference Lichtman, Froelicher and Blumenthal 47 Whang et al (2010) established that UA patients with depression have an increased risk of all-cause mortality at 42 months even after adjusting for the Charlson comorbidity index, the GRACE risk score, and left ventricular ejection fraction.Reference Whang, Shimbo and Kronish 46 As such, comorbid depression in ATS/UA appears to increase risk toward cardiac and noncardiac death.
Furthermore, in the present study, we found that the BDI-II score and all subdomain scores were significantly higher in UA class IV (Canadian Classification) as compared with class III, indicating that along the ATS spectrum from normal controls ➔ ATS without UA ➔ UA class III ➔ UA class IV there is a gradual increase in the BDI-II scores, key depressive, and physiosomatic symptoms, and a gradual decrease in self-esteem, with the most extreme values in UA class IV.
In the present study, we included only depressed patients with a mood disorder due to a general medical condition, namely ATS, and as such the findings indicate that the ATS spectrum is accompanied by increased severity of “secondary” depression. In this respect, depression due to medical illness is generally accompanied by more severe symptoms and more medical costs as compared with patients without comorbid depression.Reference Maes, Ruckoanich and Chang 5 , Reference Wang and Gorenstein 41 , Reference Katon, Lin and Kroenke 48 Importantly, a common LV could be extracted from the BDI-II scores, ATS, UA, and UA classes indicating that these data are reflective manifestations of a common single trait, namely “severity of the ATS symptomatome.”
Depressive symptoms, atherogenicity, and IR in ATS/UA.
In the present study, we found that the BDI-II scores, the ATS features, atherogenicity, and IR indices were reflective manifestations of a common core, namely “severity of the atherogenicity–IR–phenome of ATS.” Moreover, this new construct showed accurate “psychometric” properties, including internal consistency, predictive relevance, construct replicability, and convergent validity. As such, the latent variable scores extracted from these data constitute a replicable and reliable score reflecting the severity of ATS/UA, its atherogenic and IR-associated pathophysiology, and severity of comorbid depression as well. Moreover, our results show that the BDI-II score and its subdomains are strongly correlated with atherogenicity and IR.
These results extend those of previous reports that major depression is accompanied by increased AIP, Castelli 1 risk index, and triglyceride levels, and lowered HDLc.Reference Maes, Ruckoanich and Chang 5 , Reference de Melo, Nunes and Anderson 6 , Reference Vargas, Nunes and Barbosa 17 – Reference Nunes, de Melo and de Castro 19 Liang et al observed that depressive symptoms are positively correlated with lipid levels including TC, TG, and LDLc, and negatively with HDLc, and that these associations are partially mediated by heart disease.Reference Liang, Yan and Cai 49 Lowered levels of HDLc in major depression are not only a consequence of activated immune-inflammatory pathways,Reference Maes, Smith and Christophe 50 but also of lowered levels of paraoxonase 1 (PON1) arylesterase activity.Reference Moreira, Boll and Correia 51 – Reference Maes, Sirivichayakul and Matsumoto 53 Upon secretion of the PON1 enzyme from the liver into the blood, PON1 is integrated into high-density lipoprotein (HDL) to form an HDL-PON1 complex.Reference Moreira, Boll and Correia 51 The anchored PON1 protects HDL (and LDL) from oxidation and activates HDL to optimize cholesterol efflux from macrophages to the liver.Reference Moreira, Boll and Correia 51 As such, the lowered PON1 activity (in part determined by PON1 Q192R single nucleotide polymorphisms) in major depression may be causally related to increased oxidation of HDL and LDL and, therefore, may underpin ATSReference Billecke, Draganov and Counsell 54 – Reference Chistiakov, Melnichenko and Orekhov 58 and the comorbidity between ATS and major depression.Reference Moreira, Boll and Correia 51
A recent review and meta-analysis reported a significant association, although with small effect size, between major depression and IR, although some papers reported negative findings.Reference de Melo, Nunes and Anderson 6 , Reference Silva, Atlantis and Ismail 21 , Reference Kan, Silva and Golden 22 , Reference Bonifácio, Barbosa and Moreira 43 IR and IR metabolic syndrome contribute to the molecular pathophysiology of atherosclerotic disease, for example, by suppressing nitric oxide production.Reference Di Pino and DeFronzo 59 All in all, our results show that increased atherogenicity and IR are pathways which lead to ATSReference Hansson and Hermansson 11 , Reference Li, Li and Li 12 and are associated with the onset of depression due to ATS/UA.
Depressive symptoms, immune and oxidative stress biomarkers, and ATS/UA.
This study found that IL-6 and MOR are important biomarkers of comorbid depression due to ATS/UA and that the BDI-II scores are significantly and positively associated with IL-6, IL-10, MOR, β-endorphins, and copper, and negatively with zinc, magnesium, and vitamin D. Increased levels of IL-6 and IL-10 are now established biomarkers of major depressionReference Maes and Carvalho 26 , and significant correlations between depression scores and IL-6 and IL-10 are frequently observed.Reference Al-Fadhel, Al-Hakeim and Al-Dujaili 30 , Reference Wiener, Moreira and Portela 60 Inflammatory cytokines, including IL-6, increase not only the risk to develop ATS via activation of macrophages leading to endothelial dysfunction and atherothrombosisReference Caruso, Fresta and Grasso 61 but also major depression.Reference Maes, Anderson and Kubera 62 Increased IL-6 is also observed in patients with depression due to multiple sclerosis.Reference Kallaur, Lopes and Oliveira 63 The increased levels of IL-10 indicate that activation of the CIRS is another shared pathway in major depressionReference Maes and Carvalho 26 and depression due to ATS/UA (this study).
Lowered zinc is another shared biomarker of depression due to ATS/UA (this study), and major depressionReference Maes, Smith and Christophe 50 , Reference Roomruangwong, Barbosa and Matsumoto 64 , Reference Twayej, Al-Hakeim and Al-Dujaili 65 Zinc is an acute phase reactant which displays not only anti-inflammatory and antioxidant effects but also anti-atherogenic effects.Reference Bao, Prasad and Beck 66 Moreover, zinc deficiency may cause endothelial cell dysfunctions and supplementation with zinc may improve LDL oxidation, vascular endothelial cell functions, and inflammation.Reference Bao, Prasad and Beck 66
A deficiency in vitamin D3 is associated with slow coronary flow rate, increased risk of CVD/ATS, and worse prognosis of ATSReference Sagarad, Sukhani and Machanur 67 – Reference Huang, Wang and Hu 70 , and is detected in depression due to other medical illness including chronic kidney disease, traumatic brain injury, and chronic spinal cord injury.Reference Jhee, Kim and Park 71 – Reference Jamall, Feeney and Zaw-Linn 73 In healthy individuals, lowered vitamin D3 levels are associated with increased atherogenicity, IR, and depression (BDI) and anxiety scores.Reference Casseb, Ambrósio and Rodrigues 74 Moreover, vitamin D3 supplementation may reduce angina attacksReference Sagarad, Sukhani and Machanur 67 and depressive symptoms.Reference Vellekkatt and Menon 29
Depressive symptoms, EOS, trace elements, macrominerals, and ATS/UA.
Lowered magnesium levels are not only associated with arrhythmias, ATS, UA, and heart failure,Reference Qazmooz, Smeism and Mousa 24 , Reference Kieboom, Licher and Wolters 75 – Reference You, Zhong and Du 78 but also with major depression.Reference Al-Dujaili, Al-Hakeim and Twayej 79 A deficiency in magnesium may contribute to IR, hyperglycemia, atherosclerotic changes, arterial stiffness, vascular inflammation, and lowered levels of key antioxidants.Reference Kostov and Halacheva 77 , Reference Qu, Jin and Hao 80 – Reference Belin and He 83
Increased levels of MOR and β-endorphins are observed in major depressionReference Al-Hakeim, Zeki Al-Fadhel and Maes 84 and ATSReference Wilbert-Lampen, Trapp and Barth 85 and also in depression due to ATS/UA (this study). Both EOS biomarkers play a role in monocytic and endothelial endothelin secretion, thereby regulating the balance between vasoactive products, which mediate vasoconstriction.Reference Wilbert-Lampen, Trapp and Barth 85 β-endorphins and/or MOR agonists may contribute to ATS, plaque instability, endothelial dysfunctions, and IR.Reference Okano, Sato and Shirai 86 Moreover, these and other EOS system peptides are secreted during immune activation and may function as part of the CIRS.Reference Al-Fadhel, Al-Hakeim and Al-Dujaili 30 , Reference Al-Hakeim, Zeki Al-Fadhel and Maes 84 , Reference Moustafa, Al-Rawi and Stoyanov 87
Nevertheless, two biomarkers of depression due to ATS/UA, namely increased copper, and calcium (this study) were not always increased in major depression. For example, Narang et al (1991) detected increased copper levels in major depression,Reference Narang, Gupta and Narang 88 whereas Twayej et al (2020) and Styczen et al (2016) established lower copper levels in major depression.Reference Twayej, Al-Hakeim and Al-Dujaili 65 , Reference Styczeń, Sowa-Kućma and Siwek 89 Likewise, some authors found increased serum and cerebrospinal fluid calcium/magnesium ratios in major depression,Reference Levine, Stein and Rapoport 90 whereas Al-Dujaili et al Reference Al-Dujaili, Al-Hakeim and Twayej 79 established lowered calcium levels in major depression. Calcium mineralization of atherosclerotic arteries is associated with calcification of plaques, plaque formation, and increased blood vessel rigidity.Reference Małecki and Adamiec 91 , Reference Kalampogias, Siasos and Oikonomou 92
Limitations
The results of our study should be interpreted with regard to its limitations. First, we used a case–control design and consequently, we may not establish firm causal interpretations. Second, it would have been even more interesting if we had measured other biomarkers of oxidative stress, including oxidized LDL and IgG responses to oxidized LDL, as well as Q192R PON1 genotypes and PON1 CMPAase activity.
Conclusions
Current views are that the functional impairments that accompany medical illnesses are a cause of depressionReference Wang and Gorenstein 41 and that depression in patients with ATS may partly be attributed to increased psychological stress.Reference Glassman, Bigger and Gaffney 93 Nevertheless, our results show that depression due to ATS/UA is a reflective manifestation of the atherogenicity and IR pathophysiology and the phenome of ATS/UA and that this single latent trait is strongly associated with immune activation, lowered antioxidant levels, the EOS, trace elements, and macrominerals. As such, atherogenicity, IR, immune activation, lowered zinc, and vitamin D3 as well as increased copper and calcium are new drug targets to treat depression in patients with ATS/UA. Possible new treatments of ATS/UA comprise anti-inflammatory agents targeting IL-6 trans-signaling, curcumin, zinc, resveratrol, and lifestyle interventions.Reference de Melo, Nunes and Anderson 6
In this study, we employed a bottom-up nomothetic network approach to delineate a validated and replicable pathway phenotype of comorbid depression, ATS, and UA.Reference Stoyanov 94 , Reference Stoyanov and Maes 95 Previously, we have explained how the key components of an illness may be used to construct a data-driven model that assembles causome (genome and environmentome) features, adverse outcome pathways (the biomarkers), and brainome (eg, connectome data) and phenome (symptopmatome and phenomenome) features.Reference Stoyanov 94 – Reference Maes, Vojdani and Galecki 97 Therefore, future research, which examines comorbid UA and depression, should enrich the pathway phenotype constructed in the current study with genome, environmentome, brain connectome, and phenemenome (eg, self-rated health-related quality of life) feature sets.
Abbreviations
- AIP
-
atherogenic index of plasma
- ATS
-
atherosclerosis
- BDI-II
-
Beck Depression Inventory-II
- BMI
-
body mass index
- CIRS
-
compensatory immune regulatory system
- CVD
-
cardiovascular disease
- EOS
-
endogenous opioid system
- FPG
-
fasting plasma glucose
- GLM
-
generalized linear model
- HDLc
-
high-density lipoprotein cholesterol
- HOMA-IR
-
homeostatic model assessment of IR
- IL-6
-
interleukin-6
- IR
-
insulin resistance
- IRS
-
immune-inflammatory response system
- LDLc
-
low-density lipoprotein cholesterol
- LV
-
latent vector
- MDA
-
malondialdehyde
- MOR
-
mu-opioid receptors
- NOSTOX
-
nitro-oxidative stress toxicity
- PLS
-
Partial Least Squares
- PON1
-
paraoxonase 1
- RONS
-
reactive oxygen and nitrogen species
- T2DM
-
type 2 diabetes mellitus
- TC
-
total cholesterol
- TG
-
triglycerides
- TUD
-
tobacco use disorder
- UA
-
unstable angina
Acknowledgments
The authors would like to thank the staff of the CCU unit and the internal medicine clinic in Al-Sadr Teaching Hospital, Najaf City, Iraq, for their help in the collection of samples. Also, we acknowledge the highly skilled work of the staff of Asia Laboratory in measuring the biomarkers.
Funding Statement
There was no specific funding for this specific study.
Disclosure
The authors have no financial conflict of interests.
Author Contributions
All authors contributed significantly to the paper and approved the final version.