1. Introduction
In the past decade, public disclosure of pollution has appeared as a new instrument aimed at reducing industrial pollution. One of the first and most notable was the US Toxics Release Inventory (TRI) program of 1988. The Program for Pollution Control Evaluation and Rating (PROPER) in Indonesia can claim to be the first large-scale program in the developing world.Footnote 1 These schemes can be seen as either a complement to or a substitute for traditional regulation, the enforcement of which is difficult and expensive but critical for policy success.Footnote 2 Information disclosure can also be seen as an alternative to market-based instruments, such as taxes.
The principle behind the public disclosure approach is the correction of an information asymmetry. Tietenberg (Reference Tietenberg1998) refers to information disclosure as the third wave of instrument choice (after regulation and market-based instruments) and suggests that provision of information triggers and/or intensifies interactions among firms, workers, community groups, consumers, and financial markets, as well as the regulators themselves. It thus increases the expected costs of non-compliance through channels that do not directly involve the regulator. Other non-monetary factors, such as managers’ desire to avoid disgrace, probably play an important role.
A feature that has made disclosure schemes very attractive to policymakers is their low cost: a properly managed and relatively small infrastructure for collecting and disseminating information is generally sufficient for implementation. The widely accepted idea of citizens’ right to know has both paved the way for the use of these schemes and prompted the authorities to learn about the environmental preferences of the public.Footnote 3 Another important aspect is that information collection may be a first step toward the possible introduction of other policies at a later stage.
The empirical evidence on the effectiveness of disclosure programs in reducing pollution – the ultimate goal from an environmental perspective – is still limited, however.Footnote 4 Konar and Cohen (Reference Konar and Cohen1997) analyze the US TRI scheme and find in a set of 130 firms that bad publicity was correlated with falling stock prices, which in turn were followed by emissions reductions. Furthermore, the greater the fall in stock price, the larger the observed emissions reduction. Because the TRI builds entirely on legal emissions, bad publicity is mainly associated with polluters’ relative position in the ranking. Note that the released reports are completely based on self-reported data, allowing for obvious bias. According to Hahn et al. (Reference Hahn, Olmstead and Stavins2003), the TRI is claimed to have led to a 45 per cent reduction, although there is no analysis that has actually been able to attribute this reduction to the policy itself. Foulon et al. (Reference Foulon, Lanoie and Laplante2002) find that in a set of 15 pulp and paper firms in British Columbia, appearance on the Ministry of Environment's polluters list strengthened the conventional enforcement strategies (fines and penalties) and provided strong incentives for pollution control. The list only discloses the identity of noncompliant firms and firms of concern for the regulator.
In the developing world, where enforcement is generally weak, the evidence on the effectiveness of information strategies is to a large extent anecdotal. Afsah et al. (Reference Afsah, Laplante and Wheeler1997) and more recently Wang et al. (Reference Wang, Bi, Wheeler, Wang, Cao, Lu and Wang2002) have reported the success of information disclosure schemes in Indonesia and China, respectively. Their work is mainly descriptive and shows a tendency toward improving environmental indicators among the participating firms. Nonetheless, they do not have the necessary data to analyze in detail whether the programs accounted for the observed improvements. More specifically, would some emissions reductions have occurred in the absence of the program? If so, how large a share of the reduction was the program responsible for? It is important to answer these questions now that information disclosure programs are starting to be widely used in poor countries, even though the existing evidence is still fragmentary.
The PROPER program was launched in June 1995 and operated for three years as the first major scheme in the developing world to use information disclosure. At the time, it was considered an inspiring and reasonably cheap experiment, and several other countries set off to emulate various aspects (see World Bank, 2000).Footnote 5 The PROPER scheme targeted major industrial water polluters and used a five-color scale to grade the environmental performance of different facilities. The grading is primarily built on polluters’ compliance status with existing regulation and, unlike the TRI ranking and the British Columbia polluters’ list, included both compliant (Gold, Green and Blue grades) and noncompliant firms (Red and Black grades).Footnote 6 Four rounds of evaluations were released to the media over the three years that the program ran. In 1998, Indonesia and other countries of the region were hit by a severe recession coupled with other structural and political problems. This ‘Asian financial crisis’ occasioned considerable political and administrative turmoil, and the PROPER program ceased to function. Currently, however, it is being revived – this time, on a larger scale, making it all the more urgent to analyze the first period and draw lessons for its redesign. We address the effect of the PROPER scheme on actual pollution by analyzing a panel data set of firms that participated in the program and a control group of firms that did not. The use of both ex ante and ex post information allows us to study possible changes in pollution trends due to the policy, and the inclusion of a control group of nonparticipating firms allows us to control for unobserved factors that could have affected emissions in the economy as a whole. To the best of our knowledge, there are no other published studies that analyze, econometrically, emissions rates as a function of environmental policy in the developing world. Most studies in this field compare data before and after a program and ascribe observed changes to the program. However, the existence of trends in emissions implies that such evaluations may be biased, thus casting some doubts on the claimed potential of information disclosure to deliver pollution reductions in economies with weak governmental institutions and imperfect markets.
The results of this study show that there was indeed a strong, positive response to the scheme, in particular among firms with poor environmental compliance records; these firms cut their emissions intensity by approximately a third. The response was immediate, and firms pursued further reductions in the following months. We do not, however, find definitive evidence of further abatement in the firms that were in compliance already at the start of the program.
We also find that self-reported data tend to underestimate actual readings. Although our overall conclusions concerning the estimated effect of PROPER are not sensitive to the use of controls for self-reported data, our results do point to the need for strategies to induce truthful reporting, even among those firms that already have a reputation of being green. This paper proceeds as follows. Section 2 describes information disclosure as a policy instrument, and section 3 presents an overview of some aspects of environmental management in Indonesia. Section 4 presents the estimation approach, section 5 reports the data, and section 6 discusses the results. Section 7 concludes.
2. Public disclosure as a policy instrument
It is curious that economics, the discipline that reminds us there is no such thing as a free lunch, should itself sometimes still assume that information is freely available. Parsimony of information costs is generally accepted as a comparative advantage of the market mechanism, yet we know that the market cannot function at all without information, and we know that the environmental area is very complex. That implies that information demands may be heavy.
Countries such as Indonesia face a tough challenge in choosing and designing policy instruments to deal with industrial pollution. Conventional regulation (such as requirements to use best available technology) is known to be grossly inefficient, since it provides no incentive for firms to innovate. Furthermore, the whole process of setting standards is easily manipulated by powerful industrial lobbies. Indonesia was historically known for a high degree of centralization of both political and economic power in the same closely knit circle, making it hard for understaffed environmental regulators to enforce meaningful and costly requirements. Under such conditions, environmental regulations can even be co-opted to keep new, cleaner entrants out and further solidify the dominance of old, heavily polluting industries.
Other instruments, such as taxes, permits, liability, voluntary agreements, and information disclosure, have been suggested to overcome the difficulties associated with direct regulation; see Sterner (Reference Sterner2003). However, none of these solves all the regulator's problems. With the market-based instruments, the regulator faces many of the old problems associated with command-and-control regulation, plus new problems specifically related to the complexity of the market instruments themselves (e.g. Bell and Russell, Reference Bell and Russell2003; Russell and Vaughan, Reference Russell and Vaughan2003). Information disclosure is of special interest because it is both a prerequisite for other instruments and an instrument in its own right.
A good deal of knowledge is necessary for any form of environmental policy. Environmental protection agencies in developing countries, however, do not usually have the necessary information and cannot collect it easily – especially if it is intended to be used for regulation or taxation. A public disclosure program can provide a useful mechanism for data collection. The fact that the information is disseminated and used for grading makes data quality important and is conducive to monitoring and control. The data gathered allow authorities to set priorities and eventually develop the design of policy instruments. It is in this sense a prerequisite for regulation, voluntary agreements, or eco-taxes. The information collection is also a signal that the authorities are becoming more serious, and that signal itself can have important effects.
Somewhat less obvious is the fact that information disclosure can act as an instrument in its own right. We know that bargaining can be a powerful instrument, but naturally it also requires information. Today, information can be easily compiled, processed, and transmitted, and the US TRI has suggested that the mere public provision of pollution data can trigger strong and sometimes unexpected effects on factor and output markets, in addition to more traditional political channels. Public disclosure about a plant's handling of toxic materials can prompt employees to demand higher safety standards or compensatory wages, enable communities to negotiate pollution reductions with local plants, cause environmentally conscious consumers to switch to greener products, and change investors’ behavior. The reaction is not limited to agents with ‘green’ preferences. Bankers react not necessarily because they fear pollution but because they fear that others fear it – that is, they fear market reactions to decreasing sales, liability exposure, declining profitability, falling property values, and so forth. Foulon et al. (Reference Foulon, Lanoie and Laplante2002) look at the effects of appearance on the Ministry of Environment's polluters list in British Columbia and suggest the existence of a certain degree of complementarity between disclosure and conventional enforcement. In fact, a regulator that allocates its budget between monitoring and enforcement may use provision of information to liberate resources to increase monitoring.Footnote 7 Information disclosure can take several forms. Complex information can be interpreted and conveyed through labeling schemes, of which there are several types. Type 1 is certification – of products, firms, processes, or management procedures – by independent agencies. Type 2 is self-certification, without fixed criteria or independent outside review. Type 3 is the provision of raw data, without interpretation or judgment, sometimes in the form of life-cycle analysis.
Certification of organic food is widespread and one of the oldest schemes, but the number of new schemes has been increasing rapidly (see Nadaï, Reference Nadaï1999). Type 1 green labeling of products has become popular in northern Europe; Germany's Blue Angel, started in 1977, was the first national eco-labeling program. Another form of disclosure is environmental certification of firms by ISO 14000 or EMAS standards,Footnote 8 which are oriented toward management: it is the environmental management system that is certified, not the products or processes per se. At least in some markets, certification adds value to the firm or product by boosting credibility. Certification can also be an internal management instrument. To deal with inertia against new directives, managers have to fight to get their policies implemented throughout an organization. In this respect, ISO 14000 is akin to quality control (ISO 9000).
Type 3 labeling is fairly common in industry. Volvo, for instance, evaluates its performance according to several criteria and its own internal goals, and the results are published in environmental reports. The US TRI has characteristics of Type 3 programs, except that it is not voluntary. One criticism of these is that the public cannot interpret such information.Footnote 9 The program analyzed here, PROPER, has traits of both Type 3 and Type 1: the information is interpreted through rating and refers to firms or plants rather than products, and the rating – which is not voluntary – is carried out by a ministry rather than by a nongovernmental organization.
3. PROPER and Indonesian environmental managementFootnote 10
Before the financial crisis began in 1997, the growth of Indonesia's industrial production was impressive. In the 1980s and 1990s, growth rates frequently surpassed 10 per cent per annum, and Indonesia was one of the so-called miracle economies of Asia. Increased prosperity even appears to have benefited the poor. The proportion of people below the poverty line declined from 60 per cent to around 11 per cent from 1970 to 1996. Development was nevertheless uneven, both socially and geographically: 75 per cent of the industrial activity in Indonesia was concentrated in Java. Estimates in 1994 indicated that industrial pollution accounted for 25 per cent to 50 per cent of the total pollution load in rivers of the island (World Bank, 1994). Industrial contamination had become a serious health problem and (along with over-fishing) was threatening the coral reef diversity of the archipelago – the most densely populated area on earth.
Despite increasing environmental problems, the environmental protection sector has traditionally been weak in Indonesia. The first serious attempt of the Ministry of Population and Environment to control industrial pollution was the semi-voluntary Clean River program, begun in 1989. The Clean River program was based on pollution reduction agreements between provincial vice-governors and polluting firms. The agreements were not legally binding, however, and their details were kept secret. In 1990, BAPEDAL, the new environmental authority, took over the program.Footnote 11 Although it appeared to have some success in reducing pollution, stronger measures were needed.Footnote 12
Faced with the discrepancy between a powerful and expanding industrial sector and its own lack of resources, BAPEDAL decided to tackle industrial emissions control through an information disclosure program. Earlier attempts at regulation had not been very successful, no fines were ever assessed and the authorities lost 90 per cent of cases taken to court. This was the reason why the ministry wanted to try an alternative to regulation. The PROPER program, targeting water pollution, was launched in June 1995. Its distinctive feature was the disclosure of information via a five-color code, in which each participating firm was assigned a color according to its environmental status. The system was designed with considerable care so that it could be readily understood and still convey enough information to influence behavior. The environmental authority's staff understood that disclosing raw data could create interpretation problems among the public, yet a simple binary index – in compliance or out of compliance – would not do justice to all firms, especially those that had an excellent performance record and those that missed compliance by a narrow margin.
As noted earlier, the grading system primarily built on the compliance status of firms with the environmental regulation. The presence of environmental management practices and clean technology were used as secondary criteria. Plants that self-reported information on analysis of the effluent were viewed as cooperative and were, to some limited extend, rewarded in the grading process. Thus, Black was awarded to facilities that did not meet the legal standards and made virtually no pollution control effort. Red facilities had made some effort to reduce emissions but failed to meet legal standards and had insufficient reporting. Blue was given to facilities that met legal standards and had reasonably frequent reporting. Green was intended for the ‘proactive’ companies and was awarded if pollution was 50 per cent or less than the required standards and the firm conducted good equipment maintenance, reporting, and environmental work. Gold would reward firms who were below 5 per cent of the legal standard and met international standards of environmental excellence,Footnote 13 which in addition to the Green requirements implied the use of clean production technology, waste minimization, and pollution prevention activities. Besides releasing the ratings, BAPEDAL issued a simple one-page checklist on the environmental performance of the participating firms.Footnote 14 To achieve the greatest impact on environmental quality, the environmental authority selected major polluters with the highest contributions to rivers’ pollution loads to participate in the scheme.Footnote 15
In June 1995, 187 plants were given prior, private notification of their initial ratings and were told that the ratings would be publicly disclosed in December 1995 and at regular intervals thereafter. New firms were gradually included in the program until it reached 324 facilities in June 1998. Participation was compulsory for selected firms but also contained provisions for ‘opt-ins,’ and a small number of additional firms joined the program voluntarily.
BAPEDAL went to great lengths not to alienate or provoke industry but to be constructive and provide accurate and timely advice about what firms had to do to improve their ratings. Since industrial leaders were very influential during this period, there was also a conscious media strategy for the release of information and other aspects of public relations related to the program (Afsah and Vincent, Reference Afsah and Vincent1997).Footnote 16
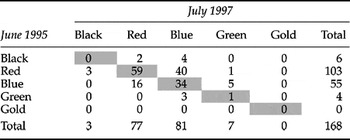
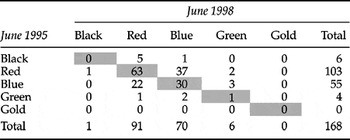
Tables 1a, 1b, and 1c show the evolution of the rankings of those firms that were rated four times from June 1995, when the program started, to June 1998, when the program closed. The tables show that the Black and Red facilities (noncompliance status) make up 65 per cent of the sample in June 1995. This illustrates the lack of stringency in the previous regulatory system, since PROPER did not itself make any changes in emissions requirements. Table 1a shows an immediate positive response within the first six months of the program – even before full disclosure – particularly among Black and Red plants: 83 per cent of the Black plants and 26 per cent of the Red plants improved. One Black plant even managed to turn Blue in this short period. Note, however, that 31 per cent of the Blue plants and 50 per cent of the Green plants could not sustain their ratings.
Change in ratings, June 1995 to December 1995

Change in ratings, June 1995 to July 1997

Change in ratings, June 1995 to June 1998

Note: Tables 1a, 1b, and 1c include data on firms that were rated in each of the following rating rounds: June 1995, December 1995, July 1997, and June 1998.
Table 1b shows a clearer trend of improvement for the longer period between June 1995 and July 1997: not many more firms slipped in performance after that initial six-month period. At the end of the period, the number of Black and Red firms had decreased significantly. We see a larger positive response among those firms that started off with a poor ranking than among those that started off with a good initial ranking. This accords well with the central idea behind the rating program as formulated by the BAPEDAL officer who conceived the program, Nabiel Makarim.Footnote 17 He had noted that Indonesia has a strong cultural taboo related to the shame of losing face, and thus bad publicity is a much more powerful instrument than good publicity: those firms that were already in compliance would not be heavily affected by the disclosure. The difference in response could also reflect increasing marginal abatement costs: abatement activities are more difficult and expensive at advanced stages of cleanup.
Table 1c shows the last ratings for 1998, which may reflect the deepening financial crisis. The environmental performance of many firms deteriorated, although not necessarily to the initial levels of June 1995. The chaotic situation in Indonesia in late 1997 and 1998 may have led firms to relax their abatement activities as they probably decided to concentrate on more urgent matters.
4. Testing the policy impact on pollution levels
Although tables 1a and 1b show a general improvement after implementation of the program, the trend cannot be taken as proof of PROPER's success, since the improvements might have occurred even without the program. We therefore studied emissions before and after the program, using a panel data set of firms that participated in the program and a control group of firms that did not. With panel data we are less worried about heterogeneity of the firms, which is controlled for by firm-specific effects, particularly those characteristics that are constant over time.Footnote 18 This approach is rather convenient in our case, where information on individual determinants of pollution is limited and incomplete. The basic model we estimate is as follows

where t indicates time, i indicates firm, and s indicates sector. E is pollution concentration (mg/L). As stated earlier, firms’ fixed effects control for factors that determine pollution and vary across firms. A sector-specific time trend is included to allow for the possibility of separate trends in the pollution intensity of particular industrial sectors. Given that pollution control in Indonesia to some extent has relied on self-reported data, we use a dummy to control for the possibility of underreporting bias. The effect of the PROPER program is assessed through two dummy variables. The first captures the immediate response to the policy, taking the value of 1, one month after a firm joined the program; the second allows for a lagged response, taking the value of 1, six months after entry. Since we do not know of any external factors, such as other changes in environmental regulation that could have affected firms’ emissions, our specification does not include any time-specific effects except the time trend. The errors are assumed to be normally distributed.
Note that in the PROPER program, water pollution is measured in terms of concentration (mg/L), rather than in total load (tons/day). For the ecosystem, load would often be more important and relevant than concentration. Disadvantages of concentration as a measure include the possibilities that a firm could dilute its effluent to improve its rating, and that increases in production scale involving increased amounts of both pollution load and water could escape detection. The seeming independence of emissions concentration from production scale has allowed regulators around the world to set environmental standards for industrial sectors to make legislation simpler and to facilitate enforcement. Indonesia is not an exception, and the data collected for both the regulations and the color grading system refer to concentration rather than to load.
5. Data
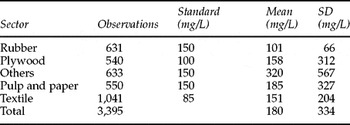
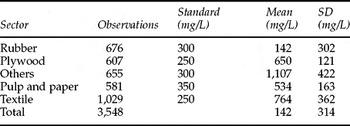
Indonesia's environmental authority, BAPEDAL, provided the information collected for the PROPER program and the earlier Clean River program. The period of analysis is June 1993 through June 1997. We selected this period because we wanted to avoid using information that was affected by the financial crisis, which is reported to have started in July 1997. We focus on emissions concentration as measured by biochemical oxygen demand (BOD) and chemical oxygen demand (COD),Footnote 19 which are common water pollution indicators, for which data were available for an adequate number of firms both inside and outside PROPER. We first constructed two panels with monthly data for both pollutants. In the few cases where more than one reading was available for a given month, we selected the median of the readings. Since readings were not available for all 48 months of the period of analysis, we selected only those firms that had at least six readings before and six readings after June 1995. Among the selected firms, none had joined the program voluntarily. Tables 2a and 2b present summary statistics of the data on pollution concentration. The BOD panel covers 132 facilities, of which 76 participated in the program. The COD panel covers 138 firms, with 82 being part of the program. In our sample, 34.5 per cent of the BOD and 39.5 per cent of the COD readings were self-reported.
BOD concentration, summary statistics

COD concentration, summary statistics

The advantage of our data is that we have a double comparison: before and after as well as inside and outside the PROPER program. For the latter comparison to be truly valid, we would need to know how our sample relates to the whole population of polluting firms, since the comparison could be biased if the groups were not representative and comparable. We have used all the data available to us, excluding only polluters with very few readings, and the data set covers a large proportion of the firms that were considered of interest by the environmental authority: these were the significant polluters, particularly regarding water effluents. BAPEDAL had identified as interesting 1500–2000 firms, most of which were already in the Clean River Program and which accounted for about 80 per cent of total pollution. The plan was to gradually increase coverage to all these firms but BAPEDAL wanted to move carefully to maintain the quality and integrity of the program. They therefore started with a selection of less than 200 firms for the first year. These were chosen on the basis of being important polluters of course, but the main criterion at this stage was that firms were located in regional clusters to minimize the travel cost for the inspectors and thus keep within the limited initial budget. As far as we have been able to ascertain, there is thus no other systematic difference between the firms in PROPER and those that participated in the Clean River program but not PROPER (N. Makarim, personal communication, 2006). It appears that PROPER started with a very small budget and simply could not deal with all polluters. In fact, during the period 1995–1998 the budget of the program increased by a factor of 2.2 and the number of firms in the program increased by a factor of 1.7.
6. Results
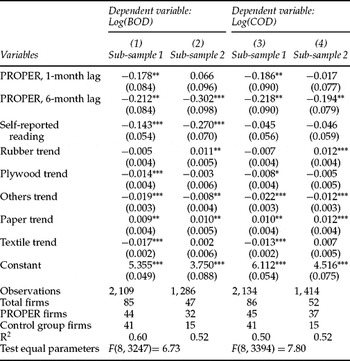
Table 3 presents the regression results for the pollutants BOD and COD. For each pollutant we estimate two models based on specific sub-samples. The first sub-sample covers firms that had poor environmental compliance records prior to implementation of the policy (and thus risked public embarrassment); the second sub-sample covers the firms that exhibited a relatively good environmental record.Footnote 20 Let us call the former group the initially noncompliant sub-sample and the latter the initially compliant sub-sample. By splitting the data this way, we acknowledge that pollution trends probably differ between firms that are at different stages of cleanup. Also, the magnitude and timing of the reaction to the policy may differ between the two sub-samples. Finally, as discussed below, the incentives to underreport may be different between the two sub-samples. In general, the explanatory power of the regressions is satisfactory and the estimations of the policy variables are consistent across regressions, although, as expected, a great deal of the explanatory power of the regressions is due to firm-specific effects. Statistical tests show that splitting the data in such a way was appropriate.
Explaining emissions concentration (log mg/L)

Notes: Regressions include firms’ fixed effect dummies. Sub-sample 1 (Sub-sample 2) cover firms with poor (good) environmental compliance records prior to the PROPER program. ‘PROPER, 1-month lag’ is a policy dummy that takes the value of 1, one month after a firm joined the program. ‘PROPER, 6-month lag’ takes the value of 1, six months after a firm joined. The reported F-statistics have p-values lower than 0.00005. Standard errors are in parentheses.
*Significant at 10% level; **significant at 5%; ***significant at 1%
We use two PROPER participation dummy variables to capture the immediate and lagged reaction to the program. The first dummy variable takes the value of 1, one month after a firm joined the program; the second dummy variable takes the value of 1, six months after the entry. For the initially noncompliant firms, the effect of PROPER participation is an immediate reduction in emissions, followed by a further reduction. For the initially compliant sub-sample, there is no immediate effect from entering the program, but we do observe a lagged effect. These results are consistent with a more urgent reaction to embarrassing news than to good news, or with an increasing marginal abatement cost function. If a firm has previously made little abatement effort, then simple changes in production processes not requiring capital investments could lead to significant and rapid emissions reductions. Firms in advanced stages of abatement have already achieved the easy reductions, and further reduction is technologically more difficult and expensive.
Robustness
Next we perform a simple robustness test on the PROPER participation variables to the length of the panels. Recall that the duration (48 months) and its close (June 1997) were selected to exclude information from the financial crisis period, and thus the panel covers exactly 24 months before and after the launch of the program. The longer the panel, the more likely it is to include unobserved effects that may affect pollution. We therefore estimated the models for several shorter panels to check the robustness of the PROPER variables. The panels were restricted in three ways, by excluding the first six months, the last six months, and the first and last six months. In the panels of firms with poor compliance histories (regressions 1 and 3 in table 3), no significant changes in the policy parameters are observed. On the other hand, shortening the panels of firms with good compliance records (specifications 2 and 4 in table 3) results in an insignificant lagged policy variable in some cases. Nevertheless, the negative sign is always preserved, and we can conclude that the estimations are reasonably robust in this respect.
The total estimated reductions in pollution concentrations for the initially noncompliant firms were 32 per centFootnote 21 and 33 per centFootnote 22 for BOD and COD, respectively. In the group of firms with good compliance records, there was no immediate reaction, whereas a lagged reaction shows in some specifications. However, the estimations are, strictly speaking, not robust enough to permit definite conclusions.
When evaluating the effectiveness of a program, the question of selectivity bias arises. Would the participating firms have reduced their emissions to the same extent without the policy? To deal with this concern effectively, we have included time trends and included both firms inside and outside the program. The time trends are expected to capture the natural pollution tendency within sectors, leaving the policy dummy to account for the effect of the program. F tests reject the null hypothesis of equal time trends across sectors in the models. This is not surprising, since it is more natural to think of industrial sectors as technologically independent and evolving at independent paces.
The reliability of self-reporting
Our data include both self-reported and external readings. In our sample, 45 per cent and 55 per cent of the BOD and COD readings respectively of the initially compliant firms were self-reported, whereas only 27 per cent and 29 per cent of the readings of the initially noncompliant firms were self-reported. It is natural that the environmental authority would seek to measure emissions of the noncompliant firms directly. The regression results show that self-reported concentration readings (BOD readings in particular) were significantly lower than readings taken by the environmental authorities. It also seems that the tendency for self-reported readings to be low was actually stronger in the initially compliant group (–24 per cent compared with –13 per cent), although the difference was not significant at a reasonable confidence level.Footnote 23
The self-reporting variable is not significant in the COD panels. One reason may be that BOD standards are relatively tighter than COD standards, and firms find it more difficult to meet them. Another reason could be that the regulator relies more on BOD readings to assess firms’ environmental performance. Finally, the main policy variables (response to PROPER) are not particularly sensitive to the presence of the self-reporting dummy in the regressions, and thus our main conclusions still hold.
Our model allows for separate pollution trends for each sector within the two sub-samples. We find negative pollution trends in most sectors in the noncompliant group, but mixed evidence in the compliant group. F tests reject the hypothesis of equal trends between the two sub-samples.Footnote 24 Thus the noncompliant firms have faster rates of decrease in pollution intensity in addition to their larger reaction to the PROPER program, reinforcing the impression that the main changes in emissions occurred in the initially noncompliant group.
Emission reductions
The analysis above was carried out in terms of emissions concentration – that is, the pollution intensity of effluents. Total pollution loads to the environment also depend on the flow of wastewater. In principle, concentrations can be reduced by increasing water flow. However, most of the plants studied have very large water flows, and further increases would lead to higher pumping and other costs. Data on water flows were somewhat incomplete but did not indicate more than a small increase of 10 per cent, which may have been partly due to increases in production. Using the predicted policy effects on concentration levels and ex ante–ex post information on water flows for 44 initially out-of-compliance firms in the program (which corresponds to 40 per cent of the total noncompliant firms that were first included in the program), we calculate the effect of the policy on emissions. The estimated reduction in emissions loads due to PROPER participation was 6.2 tons per day for BOD and 11.6 tons per day for COD. These reductions were achieved despite the observed increase in water flows in the period following the policy.
7. Conclusions
This paper has examined the effectiveness of Indonesia's Program for Pollution Control Evaluation and Rating in reducing industrial water contamination. The PROPER program, which ran from 1995 to 1998, was a pioneering scheme in the developing world that used information disclosure to control industrial pollution. The evidence for the effectiveness of such schemes is still very limited, particularly in the developing world. We analyze actual changes in emissions concentrations due to the PROPER program using panel data techniques with plant-level data on a treatment group and a control group.
The main finding of the paper is that the policy was indeed responsible for a reduction in emissions intensity as measured by biochemical oxygen demand and chemical oxygen demand, and that this reduction was particularly rapid and strong for those firms that initially had a poor compliance record. The total estimated reductions in pollution concentration for these firms were approximately 32 per cent in BOD and COD. Further calculations using information on water flows for 44 firms (40 per cent of the noncompliant firms that were initially in the program) show that the estimated reductions in concentration were equivalent to emissions reductions of 6.2 tons per day for BOD and 11.6 tons per day for COD.
The third set of results concerns the importance of underreporting to explain emissions. Self-reported concentration readings, in particular BOD readings, tend to underestimate actual concentration levels. This points to the need for strategies to induce truthful reporting, even among those firms that already have a reputation of being green. Although self-reporting is more common in the (initially) compliant firms, no significant difference in the self-reporting variable was found between the two groups. Our findings are in line with recent evidence that suggests caution in interpreting studies evaluating programs built entirely on self-reporting such as the TRI in the US (De Marchi and Hamilton, Reference De Marchi and Hamilton2006).Footnote 25
It may be surprising that mere information disclosure and ratings had such a strong effect. Apparently, reputation is not just a rich-country issue; in fact, it may be more important in economies where judicial institutions and insurance markets are weak. We do not know whether the effects depend on the relative ease with which firms that have not previously controlled emissions can achieve abatement, or on firms’ perceptions that the rating program signaled tougher regulation ahead. Blackman et al. (Reference Blackman, Afsah and Ratunda2004) find some support for the latter explanation and also attribute the effects to other mechanisms, such as pressure from shareholders and neighbors.
The authors are grateful to Fredrik Carlson, Lennart Flood, Gunnar Eskeland, Nabiel Makarim and three anonymous referees for their helpful comments and suggestions. The generous economic support from The Swedish Agency for International Development Cooperation, Sida, to the capacity building program at the Environmental Economics Unit of the University of Gothenburg, is gratefully acknowledged.