





1. Introduction
Type Ia supernovae (SNe Ia) are thermonuclear explosions of carbon-oxygen white dwarfs (Hoyle, & Fowler Reference Hoyle and Fowler1960). SNe Ia are differentiated from other stellar explosions by identifying the absence of hydrogen and helium lines in their spectra and the presence of a silicon line at 6150 Å. Astronomers have used them to study the expansion of the Universe and dark energy for decades as they can be used as standardisable candles (Schmidt et al. Reference Schmidt1998; Riess et al. Reference Riess1998; Perlmutter et al. Reference Perlmutter1999). They are a prime site for nucleosynthesis, producing intermediate-mass elements and stable isotopes of the iron group elements (IGE). Despite their importance for galactic and stellar evolution, the progenitor systems and explosion mechanisms of Type Ia supernovae remain poorly understood (Hillebrandt et al. Reference Hillebrandt, Kromer, Röpke and Ruiter2013) (see Ruiter, & Seitenzahl Reference Ruiter and Seitenzahl2025; Liu et al. Reference Liu, Röpke and Han2023, for recent reviews). Historically, there are two main competing scenarios: the Chandrasekhar-mass scenario, where a near-Chandrasekhar (hereafter near-Ch) mass (
 $\sim$
1.4 M
 $_{\odot}$
) white dwarf accretes material from a companion until central ignition (Khokhlov Reference Khokhlov, Danziger and Kjaer1991; Arnett, & Livne Reference Arnett and Livne1994; Branch et al. Reference Branch, Livio, Yungelson, Boffi and Baron1995), and the sub-Chandrasekhar mass scenario, where the explosion is triggered via double detonation from either a white dwarf merger or a helium shell detonation (Iben Jr et al. Reference Iben, Nomoto, Tornambe and Tutukov1987; Livne & Arnett Reference Livne and Arnett1995; Sim et al. Reference Sim, Röpke, Hillebrandt, Kromer, Pakmor, Fink, Ruiter and Seitenzahl2010; Fink et al. Reference Fink, Röpke, Hillebrandt, Seitenzahl, Sim and Kromer2010; Woosley, & Kasen Reference Woosley and Kasen2011; Pakmor et al. Reference Pakmor2022).
Regardless of the nature of the explosion, a Type Ia supernova explosion unbinds the stellar material of its progenitor WD into the surrounding ambient medium. Around
 $\sim10^{51}\,\mathrm{erg}$
of energy is released in the explosion, which initiates a shock wave (forward shock) that propagates radially outward from the center of the explosion. The forward shock gradually decelerates as it interacts with the surrounding medium, producing an inward-propagating (in a Lagrangian sense) reverse shock (Ardavan Reference Ardavan1973; Mansfield, & Salpeter Reference Mansfield and Salpeter1974; Truelove, & McKee Reference Truelove and McKee1999; Reynolds Reference Reynolds, Alsabti and Murdin2017). In young supernova remnants, where the ionisation timescale is comparable to the supernova remnant age, the reverse shock heats the ejecta as it passes through and the ejecta progressively ionises with time behind the shock front due to non-equilibrium conditions. Since the supernova remnant does not exist in ionisation equilibrium, the behaviour seen in radiative shocks, where ionisation states decrease over time due to recombination (Itoh Reference Itoh1977; Shull Reference Shull1982), is reversed. Instead, the ionisation of different elemental species increases with time, creating zones of higher ionisation near the outer boundary (old-shocked ejecta) of the ejecta and lower ionisation inwards (newly-shocked ejecta) (Lu et al. Reference Lu, Ge, Zheng, Zhang, Long and Aschenbach2015; Laming Reference Laming2014). This highly ionised reverse-shocked ejecta produces X-ray emission lines due to collisional excitation (Badenes et al. Reference Badenes, Bravo, Borkowski and Domnguez2003, Reference Badenes, Borkowski, Hughes, Hwang and Bravo2006; Ballet Reference Ballet2006; Patnaude et al. Reference Patnaude, Badenes, Park and Laming2012) and forbidden coronal lines in the optical discovered by Seitenzahl et al. (Reference Seitenzahl, Ghavamian, Laming and Vogt2019) (hereafter IS19). In this paper, we analyse the spatial morphology of the clumps, line profiles and velocity width trends of these forbidden optical coronal lines. The evolution of the remnant and the interaction of the ejecta with the reverse shock gives rise to hydrodynamical instabilities, which can be detected through the observed morphology of the reverse-shocked ejecta.
The expansion of the dense reverse-shocked ejecta gas is decelerated by the less dense forward-shocked ambient medium. The interaction between the shocked ejecta and the surrounding medium establishes a contact discontinuity, where deceleration drives the growth of finger-like Rayleigh–Taylor (RT) instabilities that penetrate and fragment the less-dense gas (Rayleigh Reference Rayleigh1903; Taylor Reference Taylor1950). As the instability evolves, the linear growth phase of the initial perturbation transitions into non-linear growth, forming Kelvin-Helmholtz (KH) caps (Wang, & Chevalier Reference Wang and Chevalier2001). The difference in relative velocities between the gases forms mushroom caps at the ends of the RT instabilities, which facilitates efficient mixing of the gases. The development of RT instabilities is crucial for the morphology and evolution of the supernova remnants and can be indicative of a particular explosion mechanism (Ferrand et al. Reference Ferrand, Warren, Ono, Nagataki, Röpke and Seitenzahl2019, Reference Ferrand2021). Formation of clumps and the irregular morphology of ejecta has been attributed to strong inter-shock convection that transmits the material beyond the forward shock’s nominal radius. Another theory that explains the clumping of ejecta material is the nickel bubble effect. The sequential radioactive decay of
 $^{56}$
Ni
 $\rightarrow^{56}$
Co
 $\rightarrow^{56}$
Fe heats up the ejecta, creating an inflated nickel bubble (Wang Reference Wang2008; Woosley Reference Woosley1988). The radiation deposited by radioactivity seeps through the shock via radiative diffusion, influencing the development of the ejecta structure. This creates a density gradient in the ejecta material, increasing radially outwards, with the highest density at the bubble–shell interface (Wang Reference Wang2005). The passage of the reverse shock through such structured ejecta introduces an impulse, which gives rise to Richtmyer-Meshkov (RM) instabilities (Richtmyer Reference Richtmyer1954; Meshkov Reference Meshkov1969) in the initial evolution phase of the remnant. Regardless of how the clumps are formed, they are fragmented due to enhanced mixing by RT instabilities at the contact discontinuity (Bykov et al. Reference Bykov, Uvarov, Churazov, Gilfanov and Medvedev2022) towards the later stages of their evolution.
Gull (Reference Gull1973) first modelled supernova remnant evolution and demonstrated RT instability growth in young supernova remnants. Subsequent multi-dimensional studies (e.g., Chevalier et al. Reference Chevalier, Blondin and Emmering1992) showed that RT fingers are limited by KH caps and ram pressure, preventing them from reaching the forward shock. Two- and three-dimensional MHD simulations of the RT instabilities in the shell of Type Ia supernova remnants were carried out using a moving grid technique, which allowed for the tracking of the evolution of the RT fingers and their effects on local magnetic fields (Jun, & Norman Reference Jun and Norman1995, Reference Jun and Norman1996). The growth of the RT fingers has been suggested as a cause for the enhancement of magnetic field effects in three dimensions, creating vortices and ring-structured magnetic fields. Although these simulations have significantly advanced our understanding of RT instability growth in supernova remnants, Wang (Reference Wang2011) pointed out that most simulations use a power-law density distribution for SN Ia ejecta, which is not realistic. Instead, an exponential profile should be followed, as the density of SNe Ia ejecta decreases with expansion and follows a significantly different density profile, which can be well approximated by an exponential function (Dwarkadas, & Chevalier Reference Dwarkadas and Chevalier1998; Dwarkadas Reference Dwarkadas2000).
Several observations of different young Type Ia SNRs have revealed clumpy ejecta in X-rays, which are associated with hydrodynamic instabilities (Chevalier Reference Chevalier1982; Nadezhin Reference Nadezhin1985). High-resolution X-ray imaging of Tycho’s supernova remnant with the Einstein and ROSAT missions revealed knots and clumps in the ejecta (Seward et al. Reference Seward, Gorenstein and Tucker1983). Later, higher resolution Chandra X-ray imaging was able to spatially resolve and determine the separation between the clumps on scales of a few arcseconds (Hwang et al. Reference Hwang, Petre, Szymkowiak and Holt2002; Warren et al. Reference Warren2005). Similar X-ray images from Chandra also revealed clumpy ejecta in SNR 1006, along with protrusions of the clumps ahead of the forward shock (Winkler, & Laird Reference Winkler1976; Hamilton et al. Reference Hamilton, Sarazin and Szymkowiak1986; Pye et al. Reference Pye, Punds, Rolf, Seward, Smith and Willingale1981). These protrusions were generally interpreted as an effect of back-reaction from cosmic ray acceleration; however, recent MHD studies revealed that energy loss from cosmic ray acceleration alone is insufficient to explain both the separation between the forward shock and the contact discontinuity and the protrusions. Instead, initial clumping or asymmetry might be responsible for the breakouts (Orlando et al. Reference Orlando, Bocchino, Miceli, Petruk and Pumo2012; Dyer et al. Reference Dyer, Blondin and Reynolds2014; Sato et al. Reference Sato, Hughes and Williams2019). Chandra observations of SNR 3C 397 and many other SNRs with the Advanced CCD Imaging Spectrometer also reveal arcsecond-scale clumps (Safi-Harb et al. Reference Safi-Harb, Dubner, Petre, Holt and Durouchoux2005; Sato, & Hughes Reference Sato and Hughes2017a,b ; Williams et al. Reference Williams2017).
SNR 0509 showing H from the Balmer dominated shock region in orange, [Fe xiv] in magenta and [S xii] in cyan from the reverse-shocked ejecta. The area inside the white rectangle is used to analyse the ejecta in the eastern region (see Figures 2 and 4), while the area inside the green rectangle is used to analyse the ejecta in the western region (see Figure 3); in both regions, line profiles are extracted to derive velocity widths.

SNR 0509-67.5 (hereafter SNR 0509) is a young Type Ia supernova remnant located in the Large Magellanic Cloud at a distance of about 50 kpc. It is estimated to be roughly 310–350 years old, based on proper motion analyses of the remnant (Arunachalam et al. Reference Arunachalam, Hughes, Hovey and Eriksen2022). The mass of the ejecta in SNR 0509 is consistent with a sub-Chandrasekhar mass (
 $\sim1\,\mathrm{M}_\odot$
), the explosion energy is on the order of
 $1-1.4 \times 10^{51}$
erg (Hovey et al. Reference Hovey, Hughes and Eriksen2015) and it has been classified as a 91T-like SN from light echo studies (Rest et al. Reference Rest2005). The remnant is expanding into a low-density ambient medium, with a preshock hydrogen number density of
 $\sim0.05-0.1\,\mathrm{cm^{-3}}$
(Ghavamian et al. Reference Ghavamian, Seitenzahl, Vogt, Dopita, Terry, Williams and Winkler2017), producing prominent Balmer-dominated shocks around its periphery. Its nearly perfect circular morphology suggests an isotropic explosion in a relatively uniform environment. Recent observations of a double-shell ejecta morphology of [Ca xv] have suggested its origin from a double detonation explosion scenario (Das et al. Reference Das2025; Mandal et al. Reference Mandal, Ghavamian, Das, Seitenzahl, Mohamed and Ruiter2026). See Soker (Reference Soker2025) for an alternative explanation. Seitenzahl et al. (Reference Seitenzahl, Ghavamian, Laming and Vogt2019) demonstrated radial separation between some lines from the reverse-shocked ejecta of SNR 0509. Motivated by these characteristics, and the growing evidence for structured ejecta in SNR 0509, we present a high spatial resolution optical study of the remnant, revealing spatially resolved clumps in the ejecta shells of iron and sulphur with high S/N.
2. Methods
2.1. Data reduction
We performed a deep observation of SNR 0509 using the MUSE (Bacon et al. Reference Bacon2010) optical integral field spectrograph, mounted on Unit Telescope 4 of the European Southern Observatory’s (ESO) Very Large Telescope at Cerro Paranal. This observation was part of ESO program ID 0104.D-0104(A), led by P.I. Seitenzahl. We collected the data in service mode using the WFM-AO setup over 25 separate nights spanning 24 months: 39 observations, each lasting approximately 2 700 s, and a single observation of 93.92 s (which we excluded due to poor quality), resulting in a total exposure time of around 105 300 s (29 h and 15 min). Data reduction, night-sky subtraction, and de-reddening procedures are identical to those described in Das et al. (Reference Das2025, Reference Das, Seitenzahl, Ferrand, Pakmor, Murphy, Ruiter, Schmidt and Röpke2026).
2.2. Data analysis
2.2.1. Emission line profile analysis
We used the de-reddened and sky-subtracted data cube to extract spectra of the respective ionisation states of Fe. Since the emission lines from the reverse-shocked ejecta are very weak compared to the Balmer dominated H
 $\alpha$
emission, we used spatial binning to obtain a clearly identifiable signal for curve fitting. We selected several smaller regions from both the eastern and western limb-brightened edges within the white and green rectangles, respectively, in Figure 1 to avoid contamination from stellar emission. For each emission line, we selected and binned individual spaxels with strong S/N from both the eastern and western sides, to enable robust Gaussian profile fitting. We fit the emission lines using a Gaussian profile with a linear continuum, using the curve_fit function from scipy.optimize (see Figures 2 and 3). The curve_fit function provided the optimal parameters after fitting, along with the associated covariance, which we used to calculate the errors. We calculated the velocity width of the lines using the formula
 $V_{\mathrm{width}} = 2.3548\, c\, \sigma_\lambda/\lambda_0$
for the full width at half maximum (FWHM), where
 $\lambda_0$
is the central wavelength of the signal and
 $\sigma_\lambda$
is the standard deviation of the Gaussian in wavelength units. Using the outputs from the curve_fit function for
 $\lambda_0$
and
 $\sigma_\lambda$
for all ionisation states of Fe, we computed their respective velocity widths. Uncertainties were calculated by standard propagation of error from the covariance matrix returned by the curve_fit function.
Extracted spectra and single component Gaussian plus linear continuum fits for the broad coronal emission lines of Fe and S from the reverse-shocked ejecta in the eastern region of SNR 0509 (white rectangle in Figure 1).


Reverse-shocked ejecta shells of various species are visualised by integrating over their detected emission lines (see Data Analysis). Contour lines in blue with various surface brightness levels are overlaid on the integrated image (see Table. 2 for SB levels). Small circular contours highlight high density clumps/blobs observed in the reverse-shocked ejecta of iron and sulphur. The clump inside the black rectangle is used to visualise the morphological change in Figure 5.

The clump highlighted in Figure 4 is isolated and shown with contour levels across the successive ionisation zones of Fe to track the morphological changes.

2.2.2. Surface brightness map of reverse-shocked ejecta
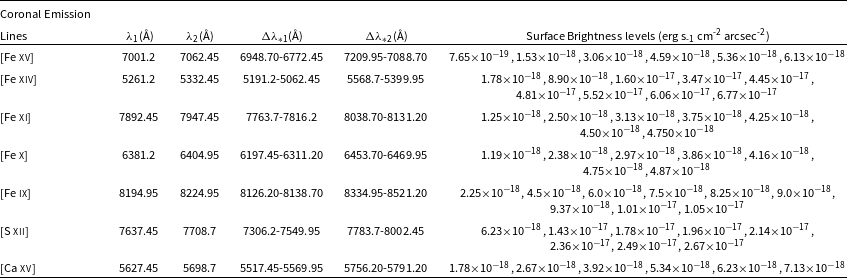
We map the surface brightness (and iso-contours) of the emission lines from the individual ionisation states of Fe and S to interpret the distribution of ejecta material (see Figure 4). For this, we adopted the following strategies. We smoothed the data cube using Gaussian smoothing with kernel = 2 in QFitsView to improve the visualisation of fainter signals. We selected a region of 68
 $\times $
85 pixels (
 $13.6''\times 17''$
) from the eastern limb-brightened edge of the remnant (white region in Figure 1), as it exhibits the most prominent clumps with minimal projection effects. We visualised the different species by integrating over the spectral range (between
 $\lambda_1$
and
 $\lambda_2$
) where each signal was detected. We integrated two adjacent spectral ranges on both sides of the signal (
 $\Delta \lambda_{*1}$
and
 $\Delta \lambda_{*2}$
) and subtracted them from the signal to remove any continuum. The selected wavelength ranges are listed in Table 2. We adopted this process from QFitsView, which allowed us to image the distribution of the ejecta corresponding to their broad emission lines. We present emission maps overlaid with contours at multiple surface-brightness levels (see Table 2) to enhance the visualisation of high-density clumps, which we identified by closely spaced contours.
The perfectly circular, saturated (in white) contour lines in Figure 4 in [Fe x], [Fe xv], and [S xii] result from the presence of a star with signal at the same wavelength as the broad emission lines. We selected the ejecta clump highlighted in Figure 4, between
 $-67^{\circ}31'19''$
and
 $-67^{\circ}31'23''$
, to study the dynamics and evolution of the clump through successive ionised states of Fe. We present the same clump across all ionised states of Fe together in a single frame, as shown in Figure 5. We coloured the highest contour level in each ionisation state to better track the evolution of the clump and its behaviour under the effect of the reverse shock.
2.2.3. Radial profiles of coronal Fe emission
To resolve the radial stratification of coronal Fe ionisation stages across the limb-brightened eastern edge of SNR 0509–67.5, we extracted one-dimensional surface brightness profiles from the de-reddened, Gaussian-smoothed MUSE datacube. For each line we first constructed a continuum-subtracted emission map as described above. For each map, we extracted a 3
 $\times $
27-spaxel rectangular aperture on the limb-brightened eastern edge (white rectangle in Figure 1), with its long axis oriented radially outwards along right ascension. Summing over declination gives the radial profile and its uncertainty. We then convert the spectral flux to surface brightness using the MUSE flux scaling of
 $10^{-20}\,\mathrm{erg\,s^{-1}\,cm^{-2}}$
Å
 $^{-1}$
(see Figure 6).
Observed surface brightness (in log scale) of forbidden coronal emission lines from various ionised states of Fe in the reverse-shocked ejecta of SNR 0509. Also indicated are the radii at which each detected ionisation state reaches its peak, namely [Fe xv], [Fe xiv], [Fe xi], [Fe x], and [Fe ix]. The spatial offsets between the limb-brightened shells of these ionised Fe species in the reverse-shocked ejecta are marked above each profile, and their corresponding maximum surface brightnesses are shown on the left.

3. Results
IS19 reported the first observation of optical coronal lines from the reverse-shocked ejecta of young supernova remnants. They used the ejecta shells as a diagnostic tool to constrain the explosion energy and mass of the progenitor. IS19 previously detected and reported [Fe xiv] 5302.86 Å and [Fe xv] 7059.59 Å emission lines in SNR 0509 and N103B, using a MUSE data cube with a total exposure of 5608 s. Our new deep MUSE cube, with an on-source integration time of
 ${\sim}105300$
s (29 h 15 min), not only confirms the presence of [Fe xiv] and [Fe xv] but also reveals additional ionisation stages of Ca, S, and Fe in the ejecta, including [Fe xi] 7894.06 Å, [Fe x] 6374.54 Å, and [Fe ix] 8236.55 Å (all wavelengths measured in air, as given by Del Zanna, & DeLuca Reference Del Zanna and DeLuca2018).
3.1. Ionisation in the reverse-shocked ejecta
We create 1D SNR models (using Truelove, & McKee Reference Truelove and McKee1999) where the reverse shock position is computed analytically using the specific explosion parameters summarised for SNR 0509 in IS19 – ejecta mass
 $M_{ej}=1.0\,\mathrm{M}_\odot$
, explosion energy
 $E=1.5\times 10^{51}$
erg, and age
 $t=310$
years assuming homologous expansion. The model further computes the non-equilibrium ionisation of Fe in the ejecta following the reverse shock passage as in Laming, & Hwang (Reference Laming and Hwang2003) and IS19. For the model above we assume two cases, A and B, with an ejecta density given by an outer envelope power law
 $v^{-7}$
for ejecta expansion velocity v and a uniform density ejecta core. The composition of the ejecta is set by O:Si:S:Ca:Fe = 0.2:0.5:0.2:0.05:0.05 for case A and O:Si:S:Ca:Fe = 0.2:0.5:0.2:0.05:1.05 for case B. Case B has a local overdensity by a factor of two, coming from an increased mass of Fe in attempt to reproduce the strength of the Fe lines observed in SNR 0509. The Truelove, & McKee (Reference Truelove and McKee1999) model remains the same, except that when encountering the increased density in the ejecta clump the reverse shock velocity is reduced in accordance with the model in Sgro (Reference Sgro1975). The model computes the charge state fractions of Fe for both cases at different radii (top panel of Figure 7). The radial extent of these ionisation states of Fe roughly matches with the radial extent of the same ionisation states of Fe observed in SNR 0509. The peak radius of each ionisation state is taken as the position of maximum surface brightness with the half-spaxel sampling setting a positional uncertainty of
 $\sim0.024$
pc. The separation between [Fe xv] and [Fe xiv] is 0.05 pc, between [Fe xiv] and [Fe xi] it is 0.15 pc, [Fe xi] and [Fe x] are unresolved, and between [Fe x] and [Fe ix] the separation is 0.04 pc. The bottom panel of Figure 7 shows estimates of the surface brightness (SB) of specific coronal forbidden lines originating from various ionisation states of Fe for the two different ejecta compositions. The line emissivities are calculated from atomic data given by Del Zanna et al. (Reference Del Zanna, Storey, Badnell and Mason2014) for Fe ix (865 levels), Del Zanna et al. (Reference Del Zanna, Storey, Badnell and Mason2012) for Fe x (552 levels), Del Zanna, & Storey (Reference Del Zanna and Storey2013) for Fe xi (996 levels), Aggarwal, & Keenan (Reference Aggarwal and Keenan2014) for xiv (136 levels), Fernández-Menchero et al. (Reference Fernández-Menchero, Del Zanna and Badnell2014) for Fe xv (53 levels), and Zhang et al. (Reference Zhang and Graziani1994) for S xii (15 levels). All models include full radiative cascades. We also include estimates of the impact excitation rates by heavy ions, typically O
 $^{6+}$
following Seitenzahl et al. (Reference Seitenzahl, Ghavamian, Laming and Vogt2019) using the approach of Laming et al. (Reference Laming, Raymond, McLaughlin and Blair1996) generalised from E1 to M1 transitions, for the ions with ground state fine structure transitions, Fe x, Fe xi, Fe xiv, and S xii. This can increase forbidden line emissivities over those calculated from the electrons alone by a factor of up to 2. Leveraging the superior spatial resolution of MUSE (
 $0.2'' \times 0.2''$
), we mapped the radial ejecta profiles of five Fe ionisation states – [Fe xv], [Fe xiv], [Fe xi], [Fe x], and [Fe ix] – and found their peak emission regions to lie between 2.6 and 2.91 pc (Figure 6).
1D analytical model to predict the occurrence of highly-ionised coronal lines in the reverse-shocked ejecta of an SNR originating from a sub-Chandrasekhar mass white dwarf explosion. Top: Number density of each charge state fraction of Fe and their predicted radii from the remnant’s centre where they emerge for model A (left) and model B (right). Bottom: Predicted surface brightness (in log scale) of the coronal emission lines for each Fe ionisation states for model A (left) and model B (right).

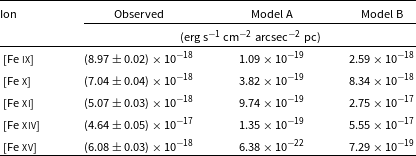
In Figure 6, [Fe xiv] is the brightest coronal line, followed by [Fe ix], with [Fe xv] being the faintest. To reproduce the observed surface brightness (SB) of the ionised Fe species, we adopted the ejecta compositions described above. The analytically computed SB values for the Fe ionisation states derived from case A, shown in the left panel of Figure 7, exhibit substantial discrepancies with all of the observed lines except [Fe x]. In particular, the model predicts a much lower SB for [Fe xiv] and a higher SB for [Fe xi], in clear opposition to the observations. Nonetheless, the predicted SB of [Fe x] in case A agrees well with the observed line profiles.
The SB values of the Fe ionisation states computed from case B, displayed in the right panel of Figure 7, agree well with the observations for [Fe xiv], [Fe xv] and [Fe ix]. However, case B also has limitations: it fails to match the observed SB of [Fe x] and [Fe xi], for which it predicts values that are higher by several orders of magnitude (See Table 1). This possibly suggests that we are looking at a “two ring” structure in Fe, similar to that seen in [Ca xv] (Das et al. Reference Das2025). Further discussion of such ideas is beyond the scope of this paper, but much motivation exists for future modeling.
Comparison of observed and model-predicted Fe line surface brightness at the eastern limb brightened edge, integrated over the radial extent of each ionisation shell in Figure 6. Observed uncertainties are the 1
 $\sigma$
propagated errors. Model A and Model B correspond to the two ejecta compositions described in Section 3.

Table 1: Long description
A table comparing observed and model-predicted Fe line surface brightness for different ionization states. The table has 5 rows and 4 columns. The columns are labeled Observed, Model A, and Model B, with units of erg s^-1 cm^-2 arcsec^-2 oc. The rows are labeled with different Fe ionization states: [Fe ix], [Fe x], [Fe xi], [Fe xiv], and [Fe xv]. Row 1: [Fe ix], Observed: (8.97 ± 0.02) x 10^-18, Model A: 1.09 x 10^-19, Model B: 2.59 x 10^-18. Row 2: [Fe x], Observed: (7.04 ± 0.04) x 10^-18, Model A: 3.82 x 10^-19, Model B: 8.34 x 10^-18. Row 3: [Fe xi], Observed: (5.07 ± 0.03) x 10^-18, Model A: 9.74 x 10^-19, Model B: 2.75 x 10^-17. Row 4: [Fe xiv], Observed: (4.64 ± 0.05) x 10^-17, Model A: 1.35 x 10^-19, Model B: 5.55 x 10^-17. Row 5: [Fe xv], Observed: (6.08 ± 0.03) x 10^-18, Model A: 6.38 x 10^-22, Model B: 7.29 x 10^-19.
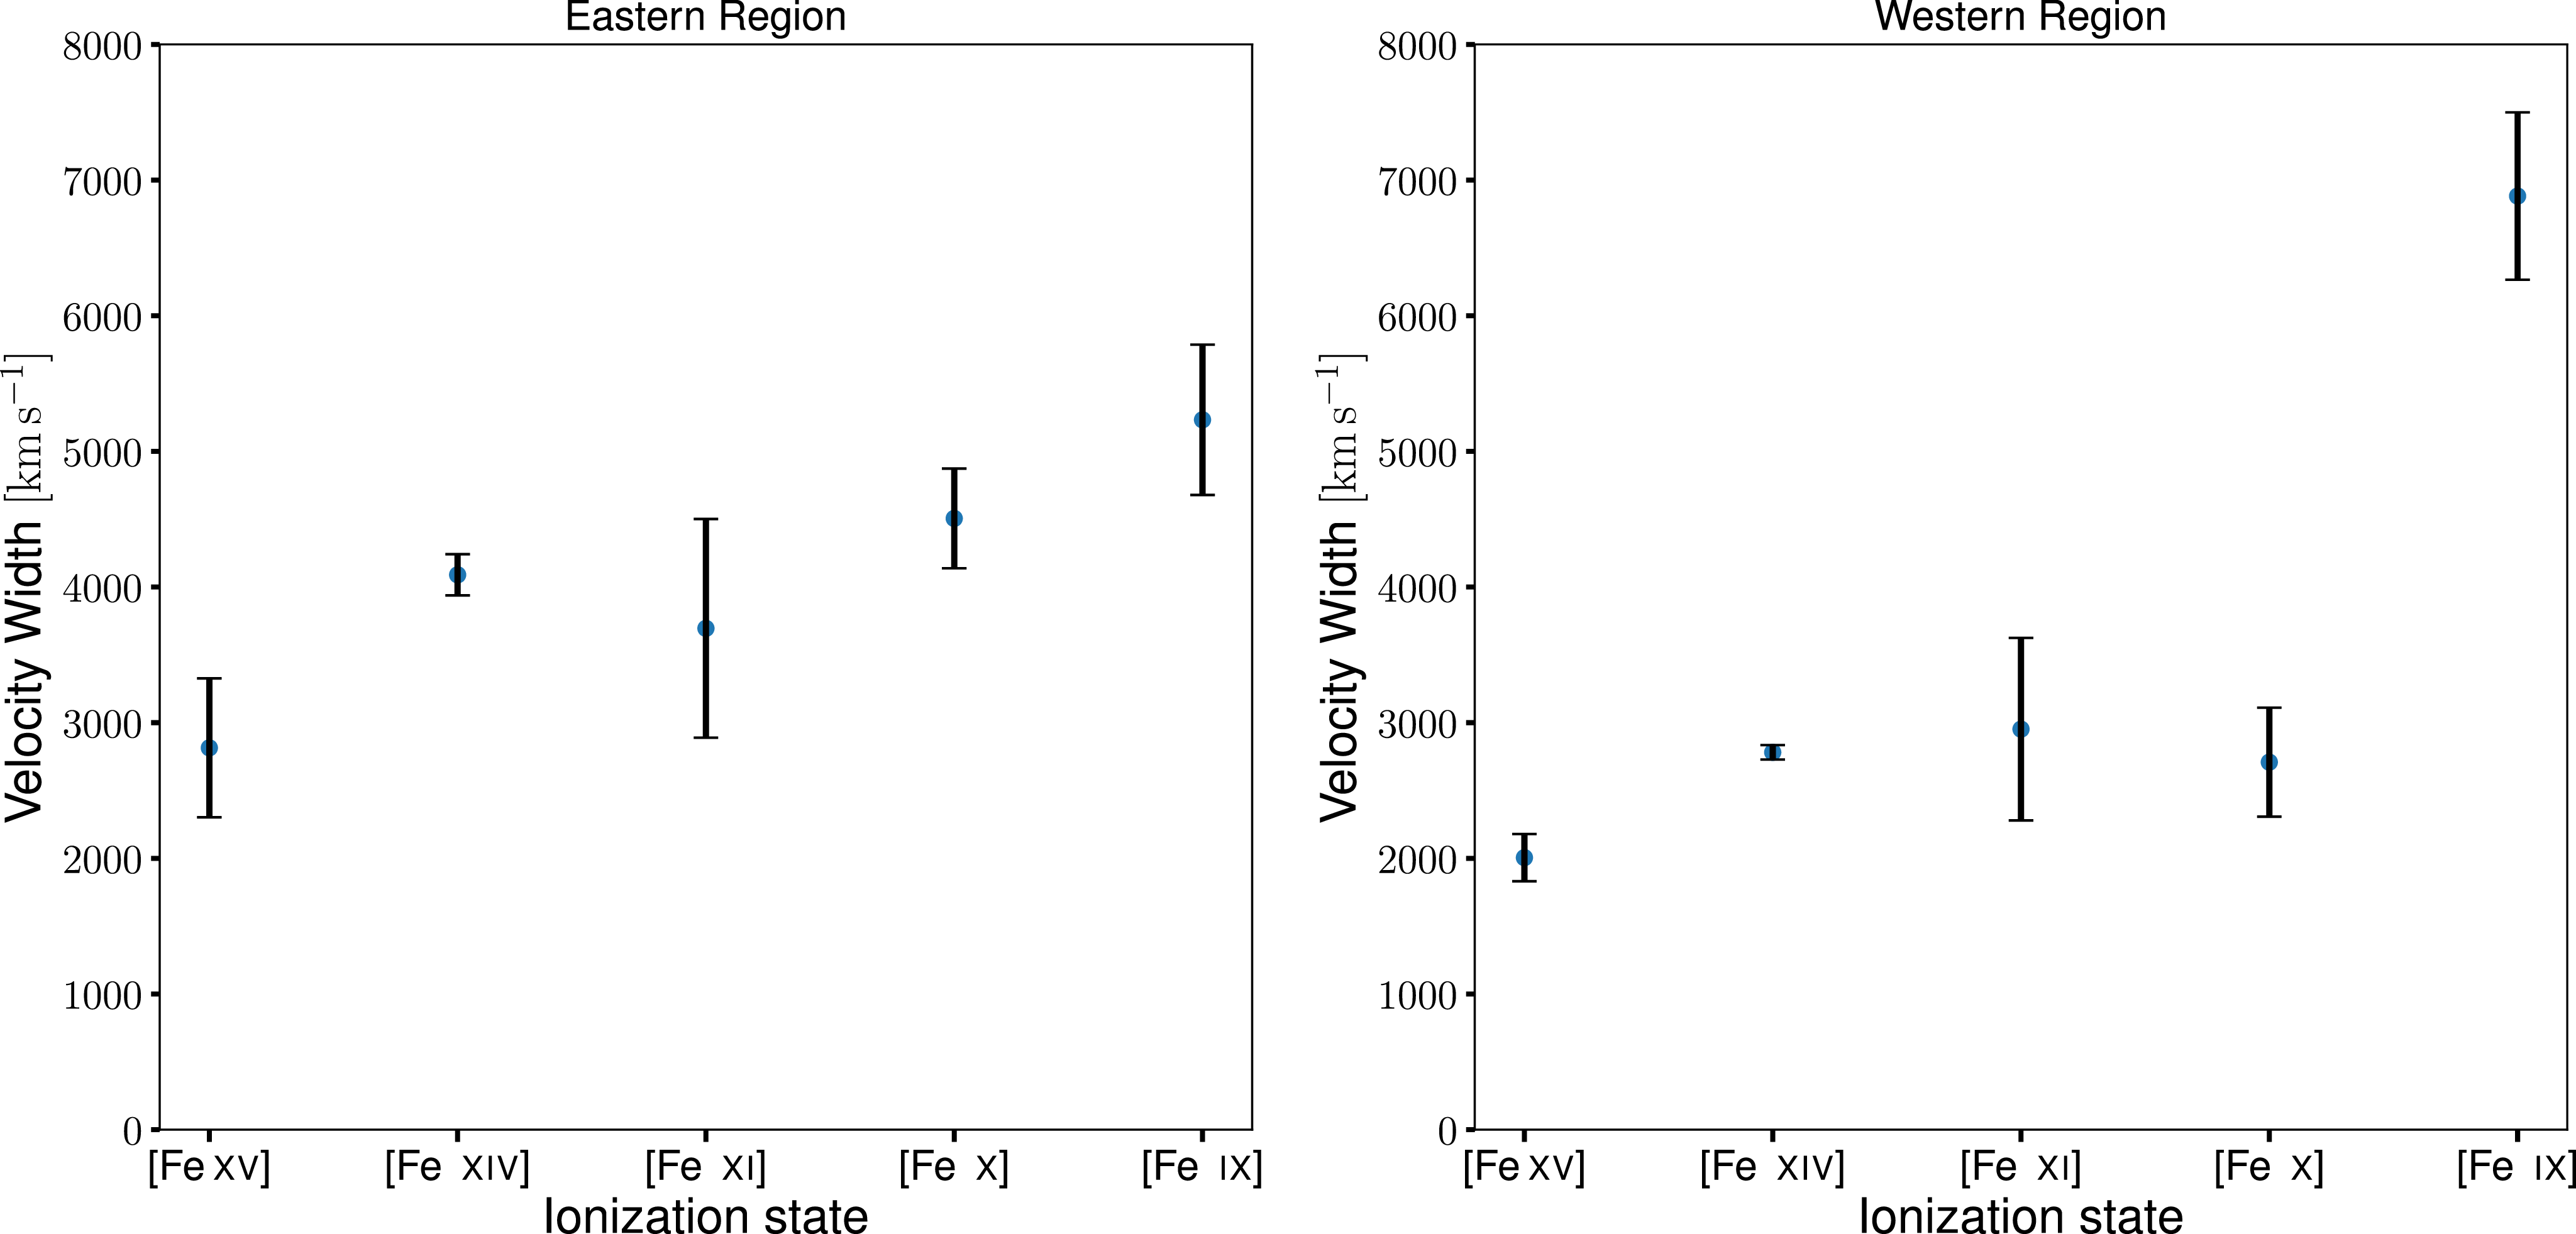
Velocity widths of the ionised Fe states with standard propagated uncertainties (1
 $\sigma$
) shown as error bars. Left: Velocity widths derived from the Gaussian fits shown in Figure 2. Right: Velocity widths derived from the Gaussian fits shown in Figure 3. In both regions, [Fe xv] exhibits the narrowest widths, while [Fe ix] shows the broadest.

3.2. Variation of reverse shock velocity
The reverse-shocked ejecta produces broad optical coronal emission lines, and the velocity width of these lines gives us an indirect measurement of the reverse shock speed. The interaction of the reverse shock with the ejecta also heats up the ejecta, contributing to thermal motions of the ions, which in turn contributes to thermal broadening (Vink Reference Vink2012). Broadening of the emission lines can also occur due to the introduction of turbulence in the ejecta as a result of the ejecta-reverse shock interaction (McKee, & Truelove Reference McKee and Truelove1995). Thus, it is fair to state that the broadening of the coronal emission lines depends directly on the effect of the reverse shock, and the velocity width of the emission lines can be associated with the reverse shock velocity, as both the ionisation and thermal effects are directly dependent on the velocity of the shock.
As SNR 0509 is a young Type Ia remnant, transitioning from free-expansion to the Sedov-Taylor phase, the reverse shock velocity is expected to increase as it traverses inwards (Chevalier Reference Chevalier1982; Leahy, & Williams Reference Leahy and Williams2017). As described earlier, we fit single component Gaussian profiles to determine the velocity widths of the coronal emission lines of the different ionisation states of Fe. Figure 8 illustrates that, in both the eastern and western regions, the velocity width progressively increases as the ionisation state of Fe decreases. The western region exhibits a more pronounced rise in velocity widths compared to the eastern region, likely because it is interacting with a denser CSM. Figure 1 presents a composite image combining H (orange), [Fe xiv] (magenta), and [S xii] (cyan), revealing pronounced interaction and structural irregularities on the western side of the remnant. This behavior is most likely caused by the expanding ejecta encountering a dense surrounding medium. The denser ambient medium on the western side impedes forward shock expansion, generating a stronger reverse shock that propagates inward more rapidly in that region.
3.3. Clump formation in the SNR 0509
We report the detection of distinct clumpy regions in all observed Fe ionisation states and [S xii] within the eastern limb-brightened ejecta. As the reverse shock propagates inwards, the outermost layers of the ejecta interact first and exhibit higher ionisation compared to the freshly ionised ejecta closer to the center of the remnant. Thus, [Fe xv] appears in the outermost layers, while [Fe ix] originates from deeper layers. Figure 4 shows contour maps of different levels of observed optical flux (see Table 1) for the various successively ionised Fe species in the ejecta, along with an overlay of their distribution map. Successive Fe ionisation states are shown together for direct comparison and highlight the radial extent of the shells along with their distinct morphology. Some clumps are more prominent and their existence can be traced from [Fe ix] to [Fe xv] (e.g., the clump highlighted in the black square).
Slices from the D6 model showing the ejecta distribution of highly ionised Fe and S species, along with clumping, similar to the ionisation stages observed in SNR 0509. The inner region of the remnant is masked by excluding all ejecta within a radius set to
 $\sim$
1.5 times the inner radius measured for the individual ionised shells in the observations, thereby reproducing the observed limb-brightened morphology.

The ejecta of the D6 model with various ionised states of Fe and [S xii] are shown with contour lines to distinguish the high density clumps/blobs from the smoother ejecta in the model.

Data used to visualise the ejecta clumps in Figure 4.

Table 2: Long description
A table detailing coronal emission lines and their corresponding surface brightness levels. The table has 7 rows and 8 columns. Column headers are: Lines, λ1(Å), λ2(Å), Δλ+1(Å), Δλ-2(Å), and Surface Brightness levels (erg s-1 cm-2 arcsec-2). Row labels include different ionization states of iron (Fe) and sulfur (S). Each row lists specific wavelengths and brightness levels for each emission line. Notable trends include varying brightness levels across different ionization states and wavelengths.
The clumps observed in [Fe xv] and [Fe ix] likely trace the same ejecta structures at different ionisation stages following the passage of the reverse shock. To examine their morphological evolution, we isolated one representative ejecta clump (black box in Figure 4); Figure 5 shows its evolution from [Fe ix] to [Fe xv]. The observed morphological progression of individual clumps (compact in low-ionisation maps; broader in high-ionisation maps) can be explained via a combination of physical processes that act as the reverse shock penetrates the ejecta. First, direct shock compression increases local temperature and ionisation, most strongly at a knot; simultaneously, shear at the interface of the ejecta boundary drives Kelvin–Helmholtz growth, while RM/RT modes fragment the knot as it is decelerated (Wang, & Chevalier Reference Wang and Chevalier2001; Blondin, & Ellison Reference Blondin and Ellison2001; Wang Reference Wang2011). These instability-driven processes naturally produce the appearance of a compact core with surrounding filamentary or fragmented structure in more early shocked ejecta. Second, internal pressure variations produced early by radioactive heating (the so-called Ni-bubble effect) can induce alternating compression and rarefaction of ejecta clumps. Third, microphysical effects such as thermal conduction, radiative cooling, and local magnetic fields modify the clump’s survivability and morphology: magnetic tension can suppress small-scale fragmentation and produce elongated morphologies, while efficient conduction and ablation tend to smear out small-scale structure (Cowie, & McKee Reference Cowie and McKee1977; Blondin et al. Reference Blondin, Borkowski and Reynolds2001; Vieser, & Hensler Reference Vieser and Hensler2007; Orlando et al. Reference Orlando, Bocchino, Reale, Peres and Pagano2008).
Taken together, the simplest consistent picture is that we are observing the growth of Rayleigh–Taylor (RT) instabilities, in which dense ejecta knots are progressively processed by an inward-moving reverse shock. The knot cores largely survive (hence detection in multiple ions), while the outer layers are stripped and fragmented, producing broader, more structured emission in the highest-ionisation lines. We emphasise that while this interpretation is strongly suggested by the morphology and line width trends, disentangling the relative importance of Ni-bubble compression versus instability-driven fragmentation will require either targeted hydrodynamic modeling or further multi-wavelength constraints (e.g., X-ray counterparts, polarisation, or resolved PV diagrams). Until such tests are available, statements about Ni-bubble dominance and other microphysical effects are framed as a plausible mechanism rather than a firm conclusion.
[S xii] also appears to exhibit clumps in the ejecta of SNR 0509. However, the clumps exhibited by [S xii] differ from those seen in Fe. The [S xii] emission reveals fewer but significantly more distinct and sharper clumps compared to those observed in the ionised Fe maps. However, they are also surrounded by comparatively smoother ejecta, similar to Fe. Across all observed species, the clumps consistently appear embedded in limb-brightened shell structures, regardless of ionisation state or element. This represents the first high-resolution optical observation of clumps in the ejecta of a Type Ia SNR. Ionisation ages fitted to X-ray spectra also indicate clumping in 0509 (Warren & Hughes Reference Warren and Hughes2004)) and in SN 1006 (Uchida et al. Reference Uchida, Yamaguchi and Koyama2013; Laming, & Finke Reference Laming and Finke2026), generally to a higher degree in the non-Fe ejecta than suggested here.
We employed the 3D hydrodynamical remnant-forward modelled version of the dynamically driven double degenerate double detonation (D6) explosion mechanism (see Tanikawa et al. (Reference Tanikawa, Nomoto and Nakasato2018) for details of the explosion mechanism and Ferrand et al. (Reference Ferrand, Tanikawa, Warren, Nagataki, Safi-Harb and Decourchelle2022) for the remnant model), motivated by recent results of SNR 0509 originating from a double WD merger system (Das et al. Reference Das, Seitenzahl, Ferrand, Pakmor, Murphy, Ruiter, Schmidt and Röpke2026). The dynamical age of the D6 remnant at 500 years matches that of SNR 0509, implying that both are at similar stages of evolution (SNR 0509 is expanding 1.3-1.7 times slower than the model). Figure 9 shows similar plots of the morphology of the ejecta at the eastern limb-brightened edge of the D6 model. We show the ejecta distribution of similar ionisation stages of Fe and S for direct comparison with our observations. Figure 10 shows the iso-contour levels in the D6 model to highlight localised high-density blobs, analogous to the observed clumps in SNR 0509. The radial extent of the ionised ejecta shells is not directly comparable to our observations, as the model evolves faster than SNR 0509 due to differences in the ambient density. As a result, the full spatial extent of the model remnant is larger by a factor of
 $\sim$
1.3–1.7 in expansion rate (corresponding to up to a factor of
 $\sim$
3.4 in diameter), even though the dynamical ages are similar. [Fe xiv] from the D6 model shows distinct localised high-density clumps in Figure 10, similar to those observed in Figure 4. [Fe xv] and [S xii] trace the ejecta that were shocked earliest and have therefore resided longest at the contact discontinuity, where Rayleigh–Taylor fingers continue to grow. The greater fragmentation seen in these species in the model is thus more plausibly a consequence of longer RT growth time. This effect can be seen in the [Fe xv] ejecta in the model and, to some extent, in the observations. However, [S xii] in the ejecta of SNR 0509 deviates from the model, with smoother ejecta and more distinct clumps observed.
4. Conclusions
In this paper, we present a comprehensive deep optical observational study of the young Type Ia SNR 0509 in the Large Magellanic Cloud using MUSE on the VLT, along with a comparison of the observations with available 1D and 3D models. We confirm that Type Ia SNRs can reveal non-radiative reverse-shocked ejecta in the optical through collisional ionisation and excitation, as first established by Seitenzahl et al. (Reference Seitenzahl, Ghavamian, Laming and Vogt2019). Building on this discovery, our deep MUSE observations provide a spatially resolved view of these coronal emission lines across the remnant, allowing us to map zones and clumps of successive ionisation states in iron, from [Fe xv] to [Fe ix] and [S xii], which appear as limb-brightened clumpy shells. This enables morphological comparison with 3D hydrodynamical remnant models, at least qualitatively for now. The high spatial resolution of our data reveals the clumpy substructure within these shells and allows us to trace the morphological evolution of ejecta clumps across different ionisation states.
We compare our 1D analytical models (Model A and Model B) to the observed surface brightness of the Fe coronal lines in SNR 0509 (see Figure 7). Model A, with no overdensity, fails to reproduce most of the observed coronal lines except [Fe xiv]. Model B, with its Fe mass fraction increased from 0.05 to 0.525 and concurrent factor of two increase in total mass density, successfully reproduces the high surface brightness of [Fe xiv] and [Fe ix] as well as the lower surface brightness of [Fe xv]. In spite of the good agreement, we acknowledge that Model B is not fully satisfactory due to several caveats: the unknown cross-ionisation effects between different ionised species and the possibility that the ejecta is not uniformly denser by a factor of two. Nevertheless, the model comparison indicates the need for enhanced density or clumping in the Fe ejecta to reproduce the significantly higher surface brightness of [Fe xiv] and a possible “two-ring” structure for Fe with higher density. The calculated radii at which the surface brightnesses of the ionised Fe shells peak are broadly consistent with the observations. However, the exact shell radii in SNR 0509 are influenced by the density of the ambient medium, its interaction with the ejecta, and the development of Rayleigh–Taylor instabilities. As this is the first time the ejecta have been observed with such high spatial detail and resolution, more sophisticated comparison models are not yet available. We therefore recommend more detailed non-equilibrium ionisation calculations, ideally in 3D, to enable more accurate comparisons with these and future observations of reverse-shocked ejecta in SNRs.
Our observations also reveal spatially resolved, distinct clumps in the ionised limb-brightened ejecta shells of iron and sulphur. We identify five to six compact Fe-rich clumps in [Fe xiv] and [Fe xi] and four clumps in [Fe x] and [Fe ix] (with one clump partially obscured by a bright star), which persist across successive ionisation stages and are embedded within a smoother, limb-brightened ejecta envelope. However, [Fe xv] at the boundary of the ejecta exhibits less distinct clumps and increased fragmentation. This morphological change is indicative of shock-driven hydrodynamical perturbations that originate as RT or RM instabilities and evolve into KH instabilities at the contact discontinuity, leading to partial fragmentation of clumps in the outer layers while compact cores survive in the inner layers. A direct comparison with a
 $\sim$
500 yr snapshot of the D6 model shows good qualitative agreement: both the data and the model display similar clump structures in the limb-brightened shells of [Fe ix] through [Fe xiv], along with comparable fragmentation in [Fe xv] (see Figures 9 and 10). The sulphur shell appears at the ejecta boundary, overlapping with [Fe xv] and is therefore expected to experience similar fragmentation, as seen in the D6 model. However, the observed [S xii] emission in SNR 0509, although located in a similar region, exhibits compact and distinct clumps rather than a fragmented shell (also shown in Mandal et al. Reference Mandal, Ghavamian, Das, Seitenzahl, Mohamed and Ruiter2026). We also find that instabilities are strongly influenced by shock–ejecta interaction, as illustrated in Figure 5, which shows the morphological evolution of an individual clump under the influence of the reverse shock.
In addition to spatially resolved measurements of ejecta shell extents and clump morphology, our analysis of emission-line profiles from the reverse-shocked ejecta probes the kinematics of the reverse shock. The velocity widths of the lines depend on both thermal and turbulent motions of the shocked gas (Vink Reference Vink2012). We find a systematic variation of line widths with ionisation state in the eastern limb-brightened shell. Figure 8 (left) shows an increasing trend in velocity width from the outer high-ionisation shell to the more central, lower-ionisation shell. Limb-brightened shells let us spatially resolve the successive ionisation zones along the radial direction however the curvature does add a geometric term to the velocity width. The observed trend suggests an increasing reverse shock speed as it propagates inward, consistent with predictions by Truelove, & McKee (Reference Truelove and McKee1999) and Chevalier (Reference Chevalier1982). In the western region, the velocity widths also show a general increase from [Fe xv] to [Fe ix], although the trend is less definitive, with [Fe x] exhibiting a similar velocity width as [Fe xi] and [Fe xiv] within uncertainties. This discrepancy may arise due to the ejecta interacting with a denser ambient medium on the western side.
Overall, we propose that deep optical observations of spatially resolved ejecta and their distribution provide a powerful new diagnostic for constraining explosion models for SNe Ia and shock–ejecta interactions in Type Ia supernova remnants. The observed clump morphology may additionally reflect the combined effects of hydrodynamical instabilities and a possible Ni-bubble-induced reduction in central ejecta density. This interpretation remains tentative given current uncertainties in ion–ion interactions and non-equilibrium ionisation modelling. Further forward modelling of supernova remnants across a broader range of explosion scenarios and circumstellar environments, together with deep observations of additional Type Ia remnants, will be essential for establishing a statistical understanding of optical ejecta properties and reproducing the observed ionisation structure and line strengths.
Acknowledgements
JML was supported by basic research funds of the Office of Naval Research.


 σ
 σ

 ∼


 Open access

