I. INTRODUCTION
Hydrogen is used as a clean renewable source in various fields, such as chemical production, Reference Kiwa, Tsukada, Suzuki, Tonouchi, Migitaka and Yokosawa1,Reference Wang, Anderson, Kang, Ren, Li, Low, Lin, Gila, Pearton, Osinsky and Dabiran2 fuel cell technology, Reference Buttner, Post, Burgess and Rivkin3 and rocket engine. Reference Şennik, Çolak, Kılınç and Öztürk4 Therefore, sensing and monitoring of hydrogen leakage is a nonnegligible issue for safety consideration. Tungsten oxide is considered as one of the most promising candidates for hydrogen sensitive materials because of its interesting structural and defective properties. Various structural thick or thin films of tungsten oxides were prepared and investigated by a number of methods including chemical vapor deposition, Reference Mahan, Parilla, Jones and Dillon5 hydro- or solvothermal, Reference Qin, Shen, Li and Hu6,Reference Su, Xiao, Lin, Jian, Li, Sun and Wang7 thermal evaporation, Reference Van Hieu, Van Vuong, Van Duy and Hoa8 magnetron sputtering, Reference Yang, Lin and Wong9 evaporation, anodic oxidation, Reference Zeng, Hu, Wang, Chen and Qin10 and so on. The performance of tungsten oxide gas sensors can be significantly enhanced by increasing the surface area, which provides more surface adsorption sites for the reaction of analyte and oxygen atoms. Accordingly, anodic oxidation is a promising process for fabricating well-defined thin nanoporous films due to their low cost to build uniform controllable morphologies and large area oxide film.
Typically, several successful anodization conditions for synthesizing a uniform nanoporous WO3 layer have been reported. Ou et al. Reference Ou, Balendhran, Field, McCulloch, Zoolfakar, Rani, Zhuiykov, O'Mullane and Kalantar-zadeh11 prepared a WO3 nanoporous network by anodization of a RF-sputtered tungsten film deposited on fluoride doped tin oxide conductive glass; the crystalline nanoporous network with thicknesses ranging from 0.6 to 1 μm exhibited enhanced electrochromic properties. This team also prepared a thick three-dimensional nanoporous WO3 film by anodization of a W foil in fluoride-containing electrolytes; the thickness of the nanoporous films ranged from 0.5 to 3 μm with an efficient growth rate of 2 μm/h under low applied voltages. Reference Ou, Rani, Balendhran, Zoolfakar, Field, Zhuiykov, O'Mullane and Kalantar-zadeh12 Kim and Choi Reference Kim and Choi13 prepared a nanoporous WO3 film with a thickness of about 2.6 μm by photoelectrochemical anodization and concluded that the increase in thickness resulted from a protective crystalline oxide on the surface and acceleration of dissolution at the tip by holes generated during illumination. Lee et al. Reference Lee, Kim, Lee, Roy and Schmuki14 obtained thick WO3 mesoporous layers by anodization of a tungsten foil in a 10 wt% K2HPO4/glycerol electrolyte, at a temperature of around 80–100 °C. This WO3 mesosponge layer with a thickness of 9 μm consists of typical feature sizes of 20–30 nm and pore widths of 10–30 nm obtained at 90 °C. Kalantar-zadeh et al. Reference Kalantar-zadeh, Sadek, Zheng, Bansal, Bhargava, Wlodarski, Zhu, Yu and Hu15 investigated the formation of nanostructured WO3 films using high temperature anodic oxidation in nitride acid. The obtained films with plate-like nanostructures (20–60 nm in thicknesses and 50–1000 nm in lengths) have predominant orthorhombic WO3 crystal structures. Furthermore, samples with different morphologies were prepared with varying electrolytes. Kukkola et al. Reference Kukkola, Mäklin, Halonen, Kyllönen, Tóth, Szabó, Shchukarev, Mikkola, Jantunen and Kordás16 prepared mesoporous particles by anodic oxidation and thick film by drop casting. The films acquired after calcination showed pronounced response toward H2 and NO dependent on temperature and yielded highest values between 170 and 220 °C. Hu et al. Reference Hu, Zeng, Wang, Chen and Qin17 fabricated anodic tungsten oxide thin film sensors toward NO2 detection. The porous (derived from cracks) sensor achieved maximum response values to NO2 at a low operating temperature of 150 °C. The anodizing parameters, such as anodic voltages, time, temperature, and operation distance, dramatically affected the pore diameter, porosity, and pore density. However, the whole process of anodic sputtering metallic tungsten thin film to produce uniform, large area, nanoporous thin tungsten oxide films was not fully exploited. Furthermore, the pore formation and expansion mechanism were not clear.
In this article, the anodic thin films for gas sensor are investigated systematically. The sputtering tungsten films are anodized in HF/NaF mixed solution, and the influence factors such as the anodic voltage, time, and operation distance are discussed in detail. The films prepared under these experimental conditions were analyzed by measuring their pore diameter, porosity, and pore density using Image-Pro Plus 6.0 software. Finally, the sensitivities of the device are investigated and discussed for various concentrations of hydrogen in air.
II. EXPERIMENTAL
The sapphire substrates were washed carefully (1 mm in thickness, ultrasonically cleaned for 10 min with HCl solution, deionized water and ethanol, respectively.). The W layer was deposited by radio frequency magnetron sputtering using a metallic W (99.99%) target in an Ar atmosphere at a pressure of 6.67 Pa (base pressure 5.0 × 10⁻³ Pa) with a deposition rate of 0.22 nm/s at a power of 100 W and a substrate rotation speed of 12 rpm. The distance between the substrate and the target was 60 mm. A thin Ti layer of about 20 nm was deposited before the W layer to enhance the adhesion between the substrate and the W layer from metallic Ti (99.99%) target.
The anodic oxidation process of the sputtered W layer was performed using an electrochemical cell with a conventional anode–cathode configuration, where the working electrode was W/Ti-sapphire and the counter electrode was the graphite sheet. The samples were rinsed with deionized water and dried in a vacuum oven after anodic oxidation.
The microstructures of the anodized and sputtered films were characterized by scanning electron microscopy (SEM, Apollo 300, CamScan, UK) and x-ray diffraction (XRD, Dmas-2200, Rigaku, Tokyo, Japan with Cu Kα radiation λ=0.15406 nm).
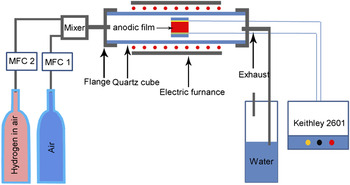
The sensor films were sandwiched between two silver electrodes and sealed in a quartz container, which was in turn connected to an impedance analyzer via two platinum cables. The electrical responses were measured with varying H2 concentrations in air by a flow-through technique with a standard flow rate of 600 mL/min monitored by a mass flow meter. The schematic diagram is presented in Fig. 1.
Schematic diagram for gas sensitivity test.

Sensor response, R s, is defined as (I gas − I 0)/I 0, where I 0 is the base resistance of the film measured in dry synthetic air, and I gas is the current observed at the end of the H-loading process.
Image analysis, which enabled us to acquire quantitative information on the porosity of the anodic alumina films (AAF) at the surface, was performed by using the Image-Pro Plus 6.0 software on high-resolution images of the oxide surface. The micrographs were at first transformed to a binary format, whereupon particle analysis was applied for the estimation of the percentage (%) of the total surface of the oxide occupied by the pores. Information on the pore diameter and porosity was obtained by acquiring high-resolution SEM images at the surface of the oxide. Three micrographs of each oxide were analyzed to determine the average value of the diameter and porosity.
III. RESULTS AND DISCUSSION
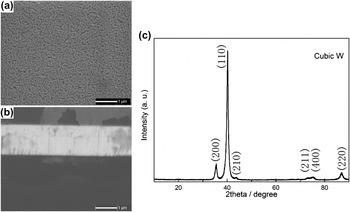
First, the radio frequency magnetron sputtered thin metallic tungsten film was characterized to examine its morphology and structure. Figure 2 shows the SEM images of the surface and the cross-sectional surface and XRD pattern of the deposited metallic tungsten film. The film surface appeared with “textured,” relative uniform morphologies exhibiting small pits and bumps, which could be seeds for pore nucleation. Reference Li, Zhang and Metzger18 The cross-sectional surface image [Fig. 2(b)] shows a nanorod close-packed structure. This resulted from the crystallization habit of metallic tungsten. Figure 2(c) is the XRD pattern, which indicates that the film has well-oriented crystallization along (110) of cubic metallic tungsten.
Surface (a) and cross-sectional surface (b) SEM images and XRD patterns (c) of the tungsten film prepared with radio frequency magnetron sputtering.

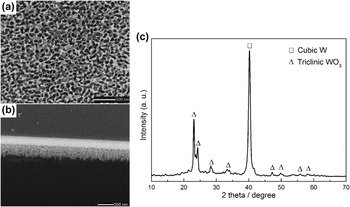
The anodic oxidation films were characterized by SEM and XRD, and the results are shown in Fig. 3. The anodic oxidation films show disordered porous morphology with a pore diameter of about 80 nm and a wall thickness of about 30 nm as shown in Fig. 3(a). The independent deep pores are formed as a result of competition of electrochemical oxidation/dissolution (field-assisted) and the localized chemical dissolution. In addition, lots of interconnected pores are developed by electric breakdown. Reference Palibroda19–Reference Klein, Moskovici and Kadary21 The cross-sectional surface image shown in Fig. 3(b) indicates that the anodic film has disordered pore structures and the residual metallic tungsten. The XRD pattern [Fig. 3(c)] of the anodic thin film after calcination at 300 °C (to eliminate tungsten hydrates) shows that the anodic film is composed of triclinic tungsten trioxide at layer and cubic tungsten (with a thickness of ∼300 nm). Therefore, the anodic film must be heated at higher temperatures to oxidize the metallic tungsten due to its conductance.
Surface (a) and cross-sectional surface (b) SEM images and XRD pattern (c) of the anodic oxidized sputtered film.

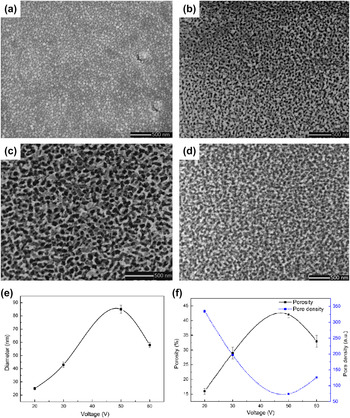
In the following sections, the anodic oxidation process parameters of thin sputtered tungsten films were detailedly and systematically discussed to optimize the procedure. The anodic voltages were first discussed, and the results are shown in Fig. 4. The film oxidized with a voltage of 20 V shown in Fig. 4(a) indicates a dense and uniform oxide film with dot-like structures, which is similar to the metallic tungsten film shown in Fig. 2(a). However, a high density of random small pores formed at the pits due to their higher electrochemical dissolution rate resulted from the smaller radius curvature compared to the bumps.
SEM images of tungsten oxide films with different anodic oxidation voltages: (a) 20 V, (b) 30 V, (c) 50 V, and (d) 60 V operating at an electrode distance of 2 cm for 60 min, and the variation of pore diameter (e), porosity and pore density (f) as a function of voltage.

When the voltage is 30 V, the nanoporous structure is formed on the surface of the oxidized film. The diameter of the pores is smaller compared with the dimensions of their walls as shown in Fig. 4(b). The pores are enlarged and deepened with the walls becoming thinner, and the surface becomes more porous as the voltage increases to 50 V as shown in Fig. 4(c). Figure 4(d) presents the surface SEM image of the film oxidized at 60 V, in which the pore structure is destroyed and the film consists of the agglomerated oxide particles.
The dependence of diameter and porosity on anodic oxidation voltage shown in Figs. 4(e) and 4(f) indicates that the pore diameter increases gradually with increasing anodic oxidation voltage from 20 to 50 V and decreases at the voltage of 60 V. The pore density curve [shown in Fig. 4(f)] exhibits the reverse characteristic since the pore structures were formed by cooperation of electrochemical oxidation/dissolution and electric breakdown. Hence, a dense oxide layer is formed at low operation voltages due to higher rate of growth compared with the dissolution on the entire surface. In contrast, the porous structure is formed under higher voltage as the dissolution rate at the oxide/solution interface of pits increases compared with the bumps, and the pore diameter increases by merging with adjacent pores. However, high operation voltages breakdown most particles, and only compact large particles survived with the pore structures vanishing.
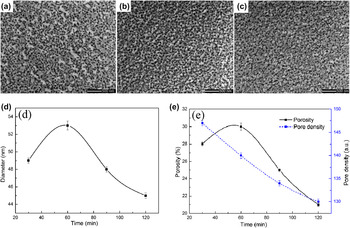
Figure 5 shows the SEM images of the films and the evolution of pore diameter, pore density, and porosity as a function of anodic oxidation time. There are relatively large particles adhering to the surface compared with the bottom layer as shown in Fig. 5(a). There are two chemical explanations. On one hand, there is usually an air-formed oxide layer on the metallic surface that acts as a “barrier layer” preventing the oxidation of the inner layer; on the other hand, the “barrier” oxide form is formed during the initial dozens of seconds at the beginning of the anodized process. According to the report of Ng et al., Reference Ng, Ye, Ng and Amal22 these particles were assigned as the products of initial precipitation and overgrowth of the oxide layer. Therefore, these particles could be formed before or at the beginning of anodic oxidation. As time goes on, the outmost layer was fully broken down and the porous morphology remained time independent as shown in Figs. 5(b) and 5(c). So changing the anodizing time did not affect the achieved morphology. Reference Ghorbani, Nasirpouri, Irajizad and Saedi23 The dependence of the pore diameter and porosity on the oxidation time shown in Figs. 5(d) and 5(e) indicates that the pore was formed and enlarged at the initial 60 min in the midst of the electrochemical oxidation/dissolution process and then decreased with an increase in oxidation time. The chemical explanation is that the oxidation/dissolution rate decreases while the oxide growth rate increases at a low oxidation voltage (here is 30 V). The pore diameter decreased due to the enlargement of the wall dimensions. The curve of pore density exhibits a nearly linear decreasing trend as a function of oxidation time. This resulted from the death of a small pore.
SEM images of tungsten oxide films with different anodic oxidation times: (a) 30 min, (b) 60 min, and (c) 120 min operating under 30 V with an electrode distance of 2 cm, and the variation of pore diameter (d), porosity and pore density (e) as a function of anodic oxidation time.

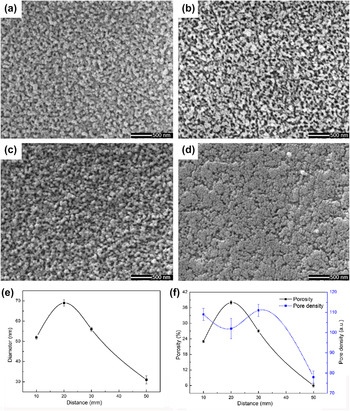
The operation distance of electrodes is another parameter affecting the film surface morphology, and the results are shown in Fig. 6. The rod-like morphology was formed with a short operation distance of about 10 mm [Fig. 6(a)]; the surface turned to a porous structure as the distance is set to 20 mm [Fig. 6(b)]. The rod-like structure was formed again with an operation distance of 30 mm [Fig. 6(c)], but the structure was bigger and denser compared with the 10 mm one. Finally, a flat, featureless insulating “barrier” oxide form, termed as the “barrier-type film,” Reference Li, Zhang and Metzger18 appeared with an operation distance of 40 mm [Fig. 6(d)]. With increasing operation distance, the pore diameter and porosity both show an early increased and later decreased state as shown in Figs. 6(e) and 6(f), whereas the pore density shows a random state.
SEM images of tungsten oxide films with different distances between electrodes: (a) 10 mm, (b) 20 mm, (c) 30 mm, and (d) 50 mm operating under 30 V for 60 min, and the variation of pore diameter (e), porosity and pore density (f) as a function of the operation distance.

The current density varied as the electrode distance was changed. There are two key factors attributed to these phenomena both induced by decreasing current density.
-
(i) The water-splitting reaction at the oxide/electrolyte interface receded as the operation distance expanded. The reaction
 $${3 \over 2}{{\rm{H}}_{\rm{2}}}{\rm{O(l)}} \to {\rm{3}}{{\rm{H}}^{\rm{ + }}}({\rm{aq}}) + {3 \over 2}{{\rm{O}}^{{\rm{2}} - }}({\rm{oxide}})\quad ,$$
is rate-determined. Reference Våland and Heusler24 Field-enhanced oxidation becomes slow which occurs at the metal/oxide interface near the pore bottom when OH− or O2− ions migrate from the solution to the oxide layer, along the direction of the pore growth.
-
(ii) Meanwhile, the rate of field-enhanced dissolution at the solution/oxide interface is decreased. Pore growth involves localized Joule heating Reference Mason25,Reference Applewhite, Leach and Neufeld26 resulting from overpotential at the oxide/electrolyte interface. This increases the dissolution rate of anodic production.
The operation temperature is also in consideration in the experiment but not presented here. However, our data indicate that the temperature barely works on the film surface morphologies in the range of 20–40 °C, which are relative low. This does not coincide with the reported results in other literature Reference Kalantar-zadeh, Sadek, Zheng, Bansal, Bhargava, Wlodarski, Zhu, Yu and Hu15,Reference Ou, Ahmad, Latham, Kalantar-zadeh, Sberveglieri and Wlodarski27 in which samples were anodized at elevated temperatures.
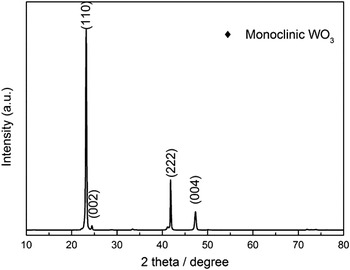
Before hydrogen sensitivity tests, the anodic oxidation thin films are heat treated at 600 °C for 30 min under O2 atmosphere to oxidize the remaining metallic tungsten. Reference Kellett and Rogers28 The residual tungsten layer was fully oxidized and the triclinic crystal phase disappeared, while only the monoclinic WO3 phase is presented as shown in Fig. 7. The sensitivities under different operation temperatures and hydrogen concentrations are thoroughly investigated as a function of detection time, and the thin films exhibit a decrease in resistance upon exposure to reducing hydrogen vapor, corresponding to the n-type response. The sensing mechanism of metal-oxide sensors based on resistance change is discussed in several papers. Reference Barsan and Weimar29–Reference Hübert, Boon-Brett, Black and Banach32 The resistance changes result from the two surface reactions:
 $${{\rm{O}}_{\rm{2}}} + 2{{\rm{e}}^ - } \to 2{\rm{O}}_{{\rm{ads}}}^ - \quad ,$$
 $${{\rm{H}}_2} + {\rm{O}}_{{\rm{ads}}}^ - \to {{\rm{H}}_{\rm{2}}}{\rm{O + }}{{\rm{e}}^ - }\quad .$$
XRD pattern of the anodic oxidized film after annealing at 600 °C.

 ${\rm{O}}_{{\rm{ads}}}^ -$
formed in Eq. (2) decreases the surface conductivity while capturing the surface electrons leading to an electron depletion layer. Subsequently, H2 adsorbs and reacts with
 ${\rm{O}}_{{\rm{ads}}}^ -$
increasing the surface conductance with releasing captured electrons.
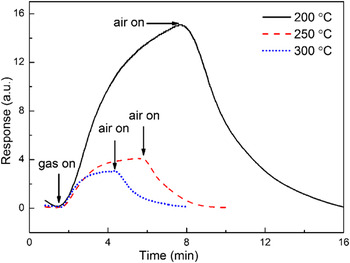
Figure 8 represents the responses of the anodic film exposed to 500 ppm hydrogen vapor at 200, 250, and 300 °C, respectively. The anodic oxidation films exhibit the reaction-dominated response as the response time changes pronouncedly and the response decreases when increasing the operation temperature. This must be attributed to the oxygen species concentration adsorbed on the surface. As is known that, at temperatures between 100 and 500 °C, the interaction with atmospheric oxygen leads to its ionosorption in molecular (
 ${\rm{O}}_{\rm{2}}^ -$
) and atomic (O−) forms proved by temperature programmed desorption (TPD), Fourier transform infrared spectroscopy (FTIR), and electron spin resonance spectroscopy (ESR) at the SnO2 surface.
Reference Lenaerts, Roggen and Maes33–Reference Chang35
Furthermore, the molecular form dominates below 150 °C, whereas the atomic form dominates above 150 °C. Consequently, at higher temperatures (above 200 °C here), the molecular form diminishes or even disappears, which leads to a decrease in the total concentration of chemisorbed oxygen. Thus, the response to hydrogen decreases logically. The response to 500 ppm H2 gas is up to ∼15.1 showing a good sensitivity at 200 °C. Otherwise, the long response and recovery time of samples at 200 °C can be explained as follows: the dissociations of H2 and O2 without noble metal are much slower at lower temperatures, which prolong the whole response and recovery time. In addition, the dissociated H+ ions were transferred to the surface and interacted with lattice oxygen, forming surface water molecules and oxygen vacancies,
Reference Luo, Deng, Tao, Zhao, Zhu, Gong, Chen and Xu36
during the response stage, and then, the surface water molecules desorbed and dissociated O ions recombined with vacancies at the recovery stage; increasing the annealing temperature will dramatically increase rates of the water molecule formation and desorption, vacancy formation, and recombination. Meanwhile, the migration of O ions is much more difficult than that of H ions in the lattice of WO3, and thus the recovery time is longer than that of the response as shown in Fig. 8.
Reference Ou, Yaacob, Breedon, Zheng, Campbell, Latham, Plessis, Wlodarski and Kalantar-zadeh37,Reference Ou, Campbell, Yao, Wlodarski and Kalantar-zadeh38
Response versus time plot of 500 ppm H2 gas at 200, 250, and 300 °C.

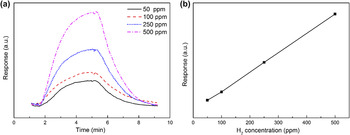
The responses toward various H2 gas concentrations at 250 °C are further investigated as shown in Fig. 9. Obviously, the higher the hydrogen concentration during exposure is, the higher the response is [Fig. 9(a)]. The response exhibited a linear relationship as a function of the hydrogen gas concentration (ppm), which is shown in Fig. 9(b) (the linear regression was performed with four replicates). We can understand the linear relationship according to the Langmuir adsorption isotherm theory. Reference Laidler39 The decrease in resistance is proportional to the specific area of the surface that is covered by hydrogen, as there are efficient reaction cites (particle ends and walls).
Response versus time plot of various concentrations of H2 gas at 250 °C (a) and the linear relationship as a function of the hydrogen gas concentration (b).

IV. CONCLUSION
The radio frequency magnetron sputtered metallic tungsten thin films were anodized in NaF/HF solution and showed a nanoporous morphology. The pore diameter and porosity increased gradually with an increase in the anodic voltage, while the “wall” of the pore was subjected to electric breakdown at 60 V and the pore diameter and porosity decreased. The pore diameter and porosity showed an early increased and later decreased state as the operation time and distance are increased. The electric breakdown and overpotential balance the tungsten oxide growth and dissolution in the process. The obtained thin film after heat treatment showed a reaction-dominated response with a linear relationship. The film sensor exhibited good sensitivity, and the sensor response is up to 15.1 toward 500 ppm H2 gas in air at 200 °C.