The Politics of Gendered Language
One longstanding debate over the politics of language concerns the use of gendered language. Feminists have long argued that the linguistic use of ‘male as norm’, or default to male in everyday language, reflects and upholds patriarchal systems and values (Martyna Reference Martyna1980; Onne Reference Onne2008). One illustration of this is in the field of economics, where scholarship argues that the overwhelming representation of men and the nearly exclusive utilization of male pronouns in prominent economics textbooks reflects the overall male-dominated nature of the discipline (Stevenson and Zlotnick Reference Stevenson and Zlotnick2018). Debate over gendered language has taken hold in the political arena, with myriad examples of policy interventions intended to correct the male-as-norm practice. For example, the passage of the Sex Discrimination Act (1975) in the UK required job advertisements to replace gendered language with language that included both sexes (Cameron Reference Cameron2016). In New South Wales, Australia, a policy was introduced in 1983 that required all further legislation to be written in gender-neutral terms, such as changing ‘he’ or ‘she’ to ‘they’ (Larmour Reference Larmour1990; NSW 2000). In the United States, New York state passed legislation in 2018 that would officially change all instances of ‘policeman’ or ‘fireman’ to their gender-neutral equivalents (NY 2018) and the city of San Diego in 2016 shifted towards using gender-neutral language in communications from city employees (Starnes Reference Starnes2016).
Importantly, experimental research conducted in Estonia by Pérez and Tavits (Reference Pérez and Tavits2019) finds that the usage of genderless language mitigates the use of negative stereotypes toward women, heightens support for policies that aid women's career development, and promotes support for the entry of women into national politics. Critically, Pérez and Tavits (Reference Pérez and Tavits2019) support their experimental findings in Estonia with analyses of cross-national observational data, rendering correlations between the use of genderless language and holding more egalitarian views concerning the role of women in business and government. They argue that their findings are due to gender-neutral language evoking a frame of mind in which male and female objects are not distinguished, which in turn diminishes perceptions of inherent disparities between the sexes. Building on this, Tavits and Pérez (Reference Tavits and Pérez2019) conduct experiments in Sweden and find that the use of gender-neutral language reduces the salience of men, which in turn increases the recognition of, and demand for, female politicians in the Swedish national government. Complementing these works, a report issued by researchers at the World Bank finds that the use of gendered language throughout the world is associated with worse labor market outcomes for women and more regressive gender norms (Jakiela and Ozer Reference Jakiela and Ozer2018). This finding has far-reaching implications, as the report indicates that roughly 38 per cent of the world's population speaks a gendered language.
Research that suggests the use of gendered language is economically and politically detrimental to women highlights the importance of political efforts to promote the use of gender-neutral language. One central effort on this front has been amendments to government constitutions to replace gendered with gender-neutral language. These amendments seek to purge gender pronouns and other gendered words (for example, he, his, men) with terms such as the governor, the candidate or individuals. In the United States, for example, these types of amendments have been put to a popular vote in states and municipalities with direct democracy (Associated Press 2003); the seminal case was Proposition 11 in California in 1974. Nearly a dozen states (including NY, FL, MD) and a growing share of municipalities (for example, Berkeley, Detroit, Sacramento) have amended their constitutions or charters to implement gender-neutral language, indicating the sustained political salience of gendered language among state and local citizenries. Indeed, several states and localities are slated to vote on gender-neutral amendments in the November 2020 general election (for example UT, MN and Washington, DC). Importantly, these amendments afford the opportunity to analyze the sources of voter support for codifying gender equality in language, and to do so with an eye toward testing theories of female empowerment.
Popular Support for Gender-Neutral Language Initiatives
In seeking to explain female political behavior and empowerment, recent studies from the United States tend to prioritize explanations based on gendered early childhood socialization (for example, Fox and Lawless Reference Fox and Lawless2004) and resultant psychological barriers like conflict avoidance (Kanthak and Woon Reference Kanthak and Woon2015; Schneider et al. Reference Schneider2016). In this letter, we concentrate on a longstanding theoretical framework for female empowerment that focuses on women's acquisition of economic resources (Burns, Kay and Verba Reference Burns, Kay and Verba1997; Paxton, Kunovich and Hughes Reference Paxton, Kunovich and Hughes2007; Schlozman et al. Reference Schlozman1994). Command over economic resources serves as a source of social power (Earle Reference Earle1997), and in societal contexts where gender roles historically reduced women's resources by assigning them to domestic roles, increases in women's command over economic resources (for example, income) is theorized to translate into greater household power and to spill over into political life (Burns, Kay and Verba Reference Burns, Kay and Verba1997; Iversen and Rosenbluth Reference Iversen and Rosenbluth2006).Footnote 1 One indicator of female empowerment is women's earnings relative to men, as research on ‘family power’ indicates that women's authority within their household expands as their earnings match or surpass those of men (Blumberg and Coleman Reference Blumberg and Coleman1989; McDonald Reference McDonald1980). According to this framework, as more women in an area acquire economic resources matching those of men, we should observe an empowerment effect manifest in the political arena in the form of augmented demand for gender equality. Applied to the case of language politics, the primary expectation is that support for gender-neutral language propositions should be higher in contexts where women's incomes are closer to parity with men.
We test this expectation on the first case where amending a state constitution to implement gender-neutral language was put to a popular vote: Proposition 11 in California (CA) in 1974. We then perform a replication test using Question 2 in New Hampshire (NH) in 1998. For our analysis of support for gender-neutral language amendments in CA and NH, we rely upon city-level historical administrative election results data. Finally, to increase the precision of our analysis, we perform two additional replication tests using fine-grained precinct-level election results data from gender-neutral amendments to municipal charters in Lincoln, Nebraska and Philadelphia, Pennsylvania, which were subject to popular vote in 2019.
Amending California's State Constitution in 1974
Proposition 11, known as the Miscellaneous Language Changes Regarding Gender Act, or Prop 11, was a constitutional amendment that sought to change constitutional language in CA to ‘draw no distinction between men and women’ (Voter Information Guide 1974). Prop 11 would alter the constitution to eliminate any instances of gendered language (‘he’ or ‘Assemblyman’) and replace it with gender-neutral verbiage (‘the person’ or ‘member of the Assembly’). This proposition appeared on the state ballot in the 1974 general election and narrowly passed into law after receiving a Yes vote from 51.1 per cent of the state electorate.
The controversy surrounding this measure highlights the gender politics of the 1970s. The ‘pro’ argument in favor of making this change accurately reflected the state of politics and everyday life. For instance, ‘[b]oth men and women work in our society. However, the constitution specifies a system of ‘workmen's compensation.’ The constitutional amendment substitutes a more accurate characterization…’ Another argued benefit was the reflection of women's ability to run and win statewide political offices and to recognize equal opportunity in political participation. The ‘con’ argument against Prop 11 was that there is nothing that necessitates the alteration of English colloquialisms to reflect the progression of civil rights and that it would be ‘absurd’ to pander to those who believed masculine language discriminated against women (Weinland Reference Weinland1974). Prop 11 provides an ideal case for investigating the politics of language as it concerns gender. Historically, Prop 11 appeared at the height of ‘second-wave’ feminism and the Women's Movement in the United States (Bergeron Reference Bergeron2015) and is the first case of holding a popular vote to amend a government constitution to implement gender-neutral language. As such, Prop 11 provides a previously unexplored test case for the operation of female empowerment in shaping voter support for a policy that would codify gender equality in language into state law.
We obtained city-level election results for the 1974 election through a special request from the CA State Archive held in the Office of the California Secretary of State. For each CA city in 1974, this data included tallies of the vote for Prop 11, which enabled us to calculate the percent of voters in each city voting Yes, which serves as the dependent variable of our analysis. We combined the city-level administrative election data with demographic data from the 1970 Decennial Census,Footnote 2 yielding complete election and Census data for 324 cities. Our independent variable of theoretical interest is the F:M Income Ratio, which is the ratio of the average income of females to males in each CA city (mean = 0.303, SD = 0.099, min = 0.08, max = 1.66). Increasing values on this variable indicate going from cities where women's average earnings lag behind those of men to cities where they have surpassed those of men.Footnote 3 To ensure that the estimated effect of the income ratio is not capturing potentially correlated variables that influenced support for Prop 11, our analysis includes city-level controls for population density, geographic size, education rates, female unemployment, and the size of the non-White and elderly (>65 years) population. Additionally, to ensure that the income ratio is not capturing variation across cities in political leanings, our analysis controls for the percent Democrat of registered voters in the city in 1974. For more information about variable measurement, see Appendix A.
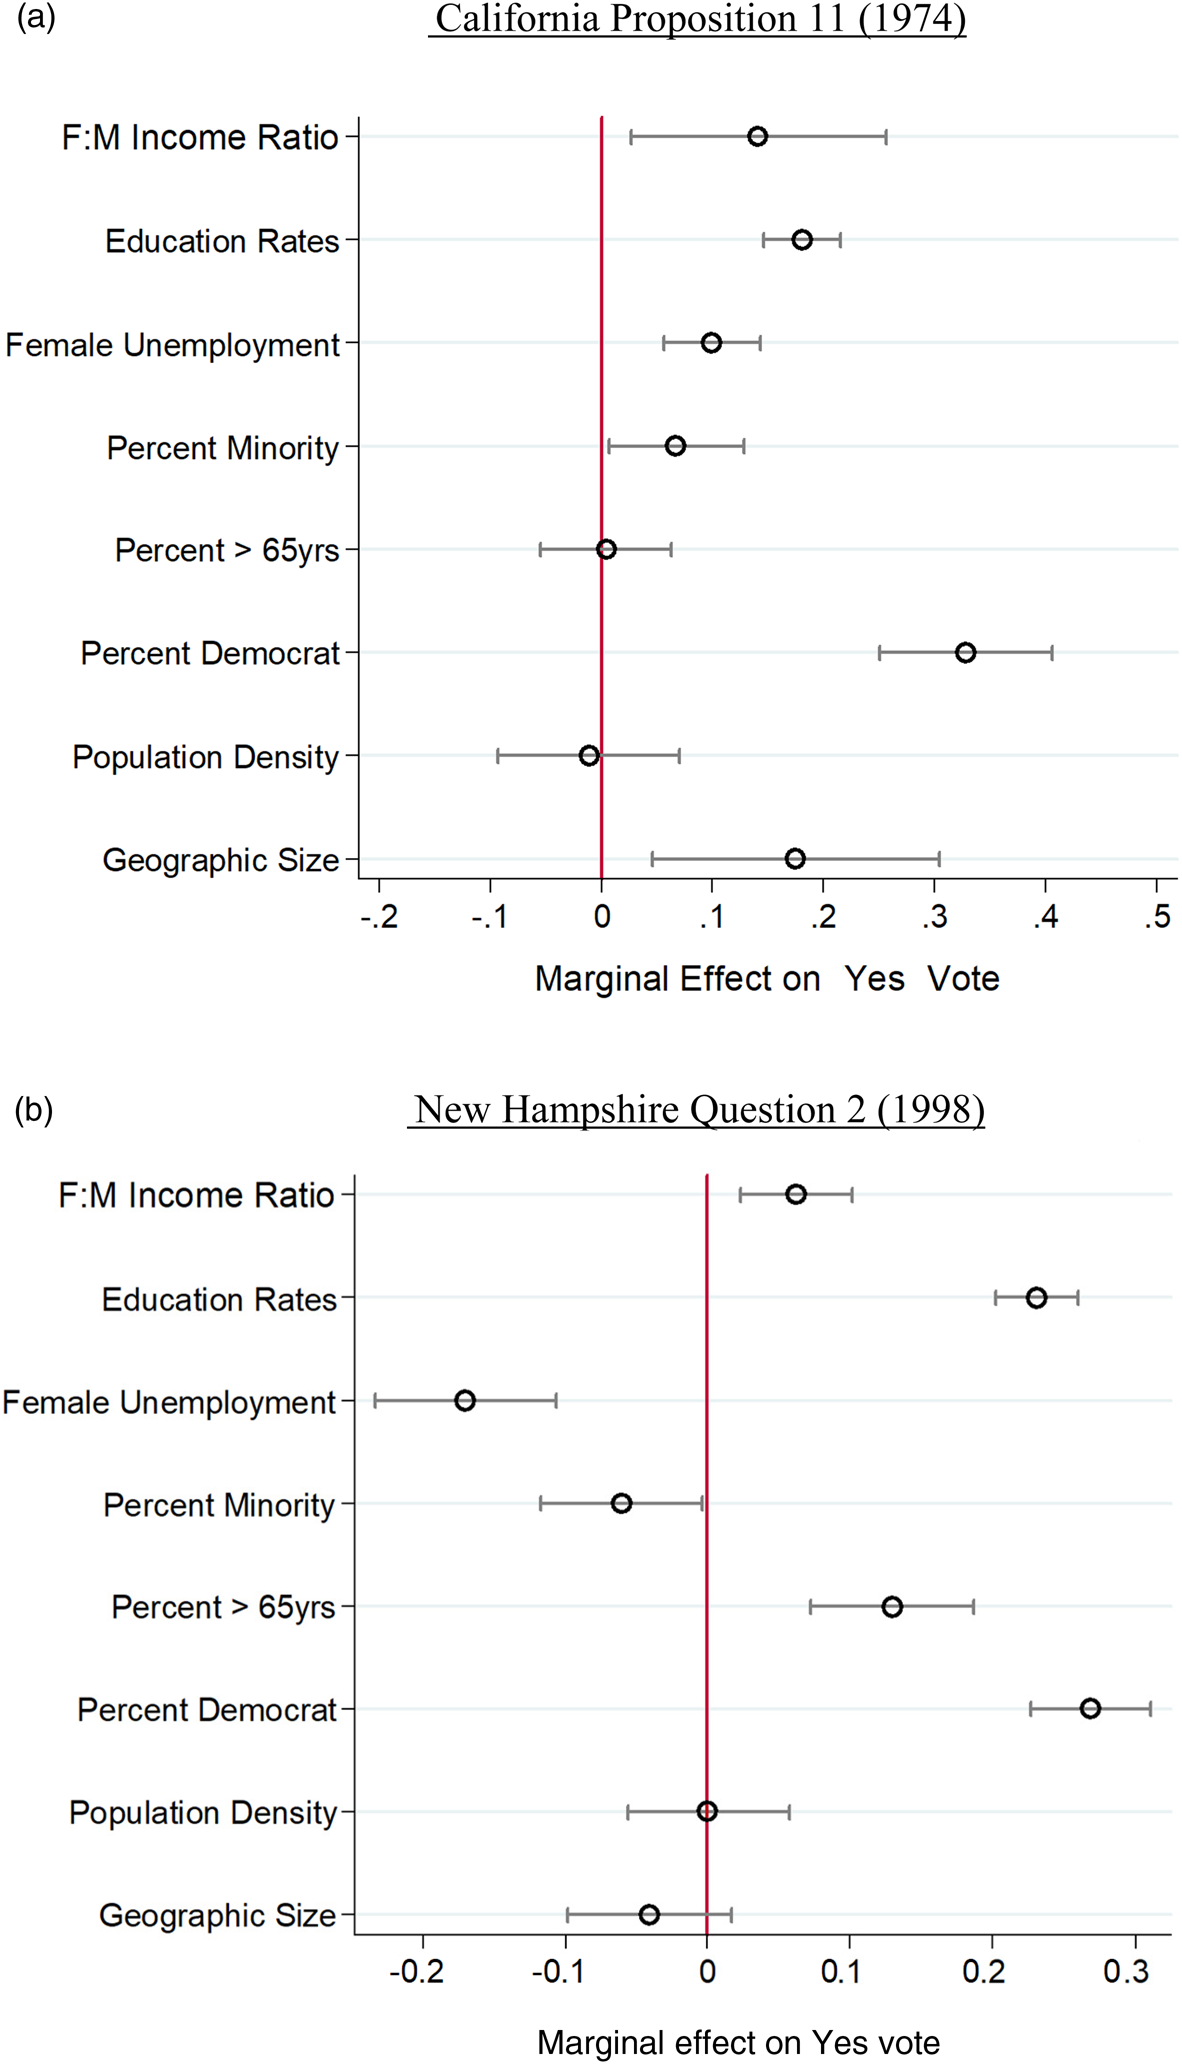
Our analytical strategy involves the use of multivariate regression. Our use of observational data limits our ability to make strong causal claims about the effect of income ratios on voting behavior. However, our analysis includes controls for a variety of conceivable confounders (such as partisanship), and we present the results from placebo tests that further dispel concerns that the income ratio is capturing an omitted variable. For ease of interpretation, Figure 1, Panel A presents the results of a linear regression model where all independent variables have been recoded to range from 0 to 1. Full model results are available in Table C2. The results in Panel A reveal that moving from cities where women's incomes on average lag far behind those of men to cities where their average incomes surpass those of men is associated with a statistically significant increase in aggregate support for Prop 11. In addition to being statistically significant, the effect of F:M Income Ratio is substantively meaningful, as it involves a 14-percentage-point increase in support.
The effect of city female-to-male income ratio on voter support for gender-neutral amendment to state constitutions
Note: (a) California Proposition 11 (1974), (b) New Hampshire Question 2 (1998). Plots display unstandardized coefficient estimates from OLS regression models with 90 per cent confidence intervals. F:M Income Ratio in each plot is the ratio of average income of females to males in each city. Full regression results in Tables C2 and C9.

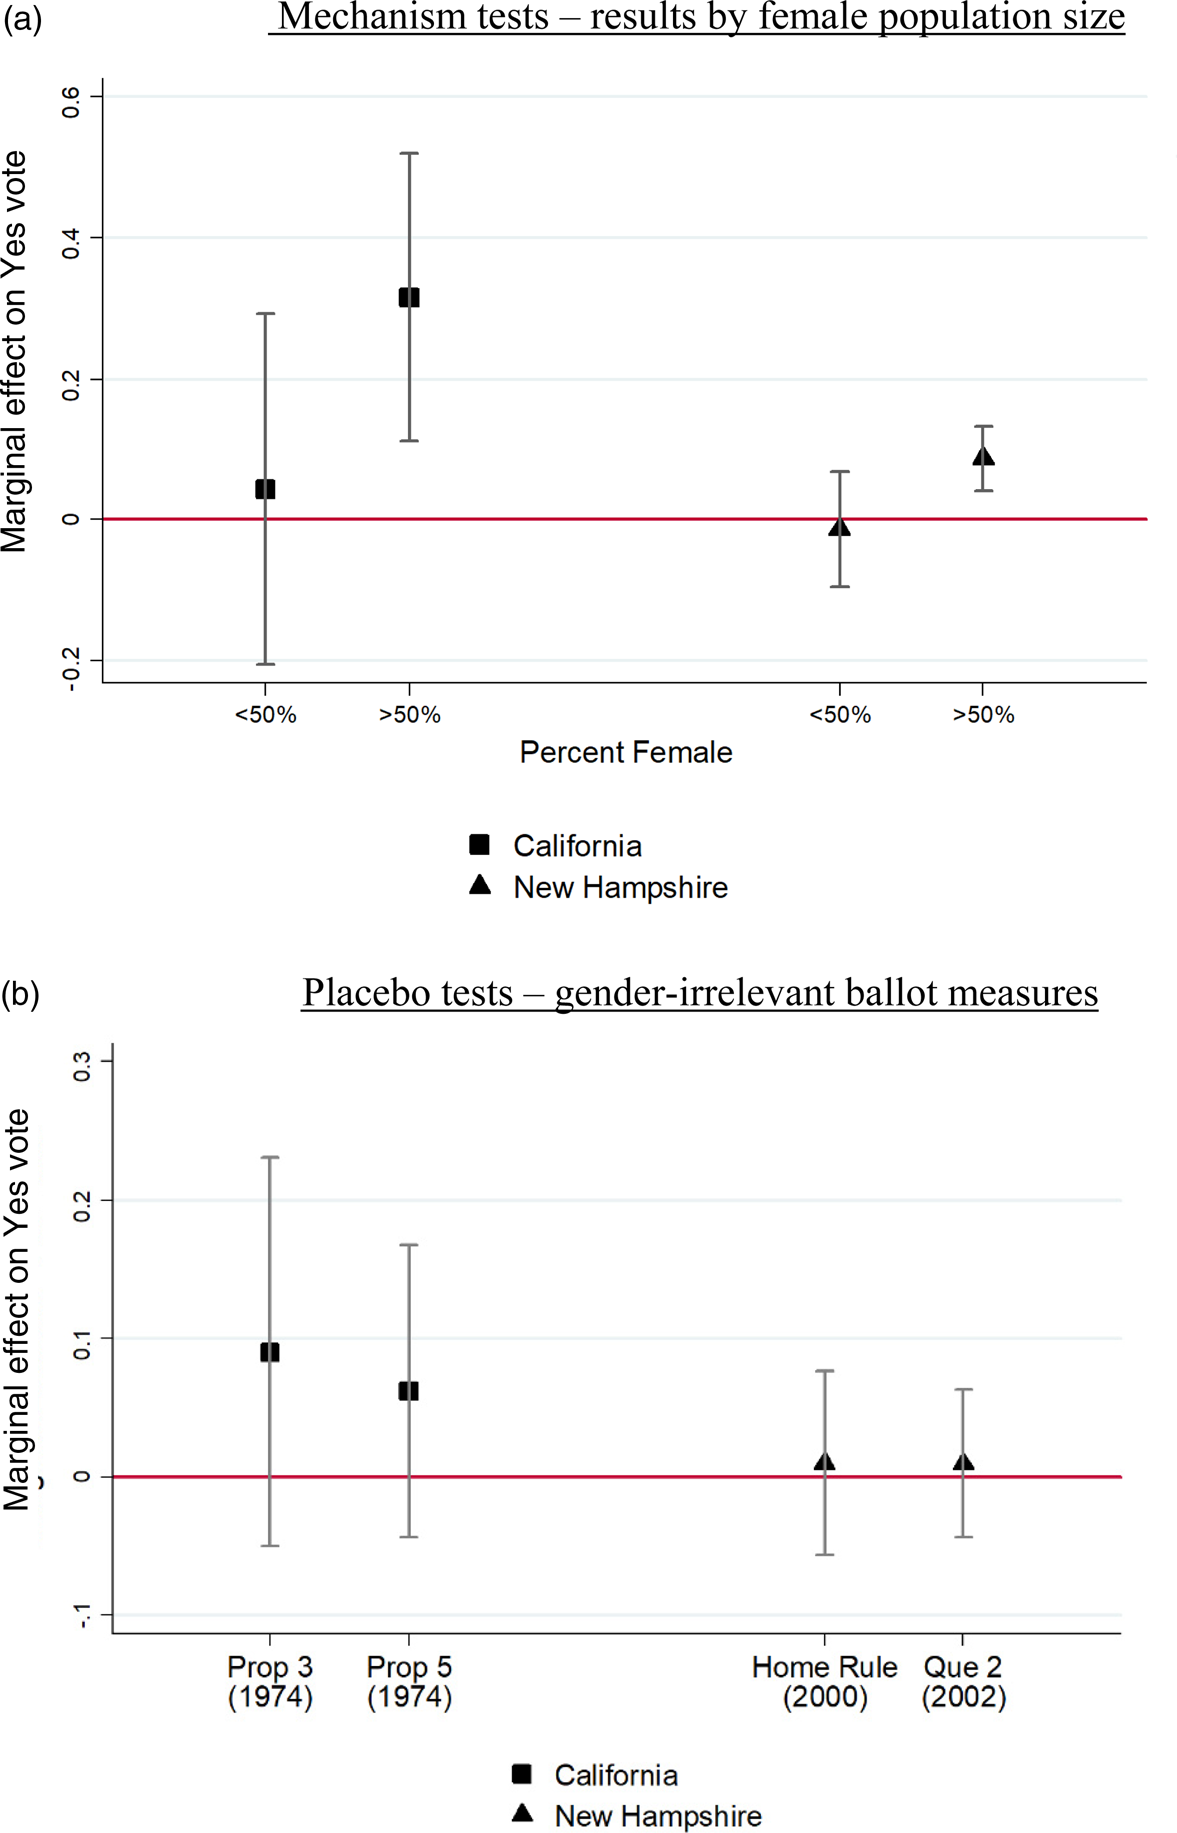
Importantly, our results hold when using robust standard errors (Table C3), beta regression (Table C4), controlling for absolute differences across cities in income (Table C5), and when missing data – due to absent census tract data – is imputed using county-level census data (Table C6). Additionally, when excluding the city of Yountville, which is a notable outlier with a value of 1.66 for the F:M Income Ratio, the estimated effect of the ratio is even larger (β = 0.27, se = 0.11, p < 0.05) (Table C7). Our use of aggregate data prevents us from inferring whether our main findings are driven by female voters, and ecological inference methods are inapplicable due to the lack of needed variation in the gender composition of cities. One available method is to conduct subsample analyses by the size of a city's female population; Figure 2, Panel A reveals that the F:M Income Ratio only exerts significant effects in cities with a greater share of women, suggesting that the results are likely driven by female voters. Finally, as a placebo test, we analyze the effect of the income ratio on gender-irrelevant ballot measures in the 1974 election – Proposition 3 involving a civil service exemption for specific government employees and Proposition 5 involving residency requirements for local government employees. Figure 2, Panel B illustrates that there is no systematic relationship between F:M Income Ratio and support for these gender-irrelevant measures.
Mechanism and placebo tests on main results in CA and NH
Note: (a) Mechanism tests – results by female population size (b) Placebo tests – gender-irrelevant ballot measures. Plots display unstandardized coefficient estimates for F:M Income Ratio on predicted Yes vote for each ballot measure from OLS regression models with 90 per cent confidence intervals. Panel A presents the estimated effects of F:M Income Ratio on the predicted Yes vote for gender-neutral ballot measures in CA and NH using subsamples where Percent Female in a city is set to be either below or above 50 per cent of the total city population. Panel B presents the estimated effects of F:M Income Ratio on the predicted Yes vote for gender-irrelevant ballot measures in CA (Propositions 3 and 5 in 1974) and NH (Home Rule in 2000 and Question 2 in 2002). Full regression results in Tables C2 and C9.

Replication: New Hampshire in 1998
To ensure that our results are not unique to CA, we offer a replication test using Question 2 in New Hampshire (NH), which was on the ballot in the 1998 general election. Question 2 presented voters with the option to amend the state constitution to ‘make it more inclusive by changing specific references to the governor and other people to gender-neutral terms’. While varying slightly in language and length, the substance of Question 2 is nearly identical to CA's Prop 11 (full language for ballot propositions is available in Appendix B). In contrast to Prop 11, however, Question 2 failed to pass: the Yes vote was 56.7 per cent, leaving it short of the two-thirds required for voters to pass constitutional amendments in NH.
Administrative election results at the city level for the 1998 election in NH are publicly available on the Secretary of State's Election Division website.Footnote 4 The dependent variable in this analysis is city-level percent Yes vote on Question 2, and we use the same model and controls used for the CA analysis.Footnote 5 We present the results from this analysis in Figure 1, Panel B (Table C9). The figure shows that nearly two decades after Proposition 11 in CA and on the opposite side of the continent, we find that an increase in F:M Income Ratio is associated with a significant increase in support for amending the state constitution to contain gender-neutral language. As we did with Prop 11, we demonstrate in Figure 2 that the F:M Income Ratio across cities in NH (1) only exerts significant effects in cities with a larger female population (Panel A) and (2) fails to impact gender-irrelevant state ballot measures – a constitutional amendment to provide NH municipalities with home rule authority (November 2000 general election) and a measure (Question 2) on holding a statewide constitutional convention (November 2002 general election) (Panel B).
Replication: Amending Municipal Charters
Our analyses of gender-neutral language amendments in CA and NH rely on data collected for relatively large units of geographic aggregation (cities). We attempt to hone in on the mechanism driving our results by demonstrating that the F:M Income Ratio only exerts significant effects in cities with more women, which suggests that our results are driven by female voters who are economically empowered relative to the men around them. However, it would be valuable to demonstrate that our results hold when using additional cases offering finer-grained data, as this would potentially offer greater variation in the F:M Income Ratio and increase the generalizability of our findings by replicating the results across different units of aggregation and political and temporal contexts.
We therefore perform additional replication tests using precinct-level election results data from two American cities (Lincoln, NE and Philadelphia, PA) that subjected to popular vote measures to amend their municipal charters to promote gender-neutral language. While both cases illustrate the robustness of our state-level findings, the analysis in Lincoln demonstrates that our findings may extend beyond liberal coastal states to a city located in a very conservative midwestern American state. A principal benefit of our analysis in Philadelphia is the public availability of the Philadelphia county administrative voter file and its inclusion of data on voter sex, which enables us to gain precision on the role that female voters play in generating our findings by estimating the effect of the F:M Income Ratio conditional on the number of female voters across election precincts.
Charter Amendment 5 in Lincoln, Nebraska
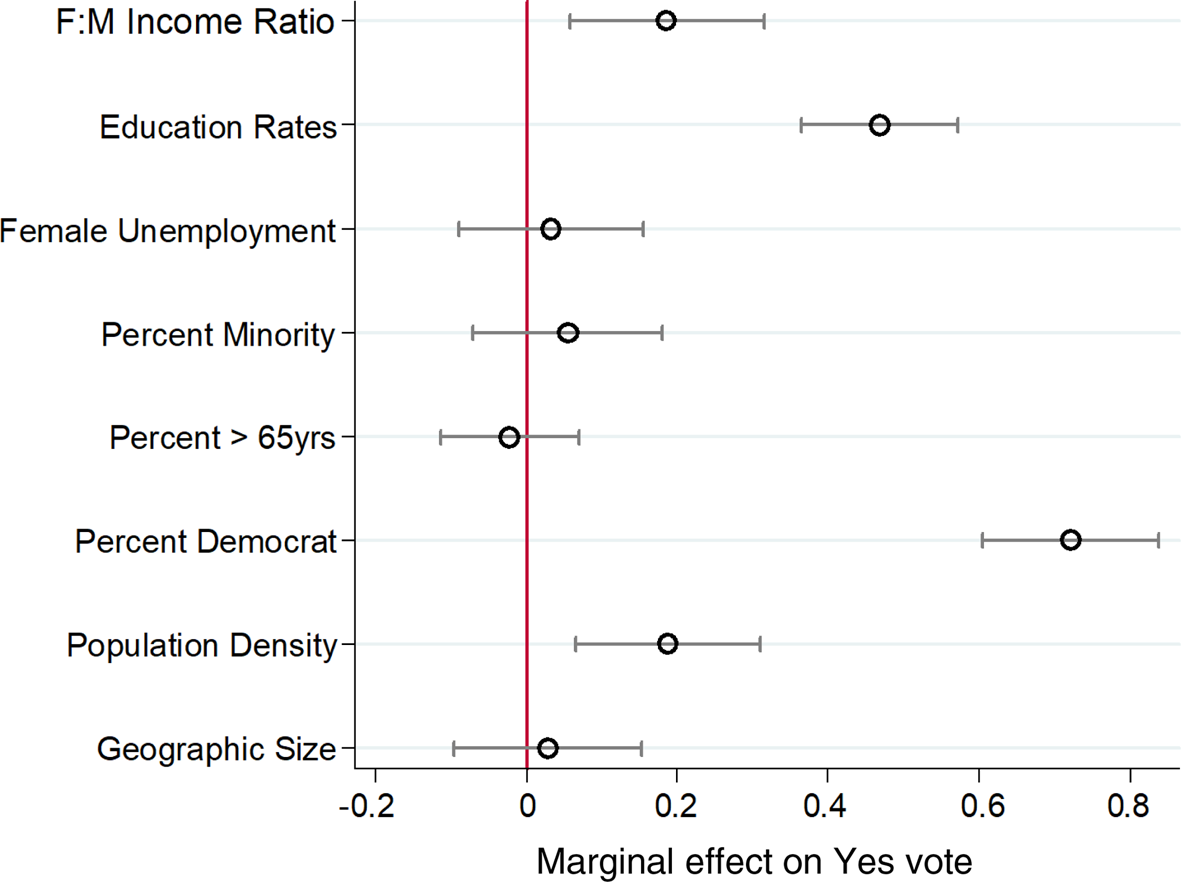
On 7 May 2019, the residents of the city of Lincoln, NE in Lancaster County voted on five charter amendments, including one aimed at gendered language in the city charter. This ballot initiative added a new Article (XII) clarifying that language in the city charter referring to ‘he’ or ‘his’ is intended to be interpreted as gender neutral. The measure passed with over 70 per cent support. The dependent variable in this analysis is precinct-level support (the percent Yes vote) in Lincoln's 183 election precincts. We retrieved election results from the Lancaster County election commissioner's website. We use the same model and control variables used in previous analysesFootnote 6 and present the results from this analysis in Figure 3 (Table C10). Consistent with previous cases, we find that an increase in the F:M Income Ratio is associated with a significant increase in precinct-level voter support for amending the city charter. As with previous cases, we find that the F:M Income Ratio (1) only exerts significant effects in precincts with a larger female population and (2) fails to impact other gender-irrelevant charter amendments voted on in the May 2019 election (Table C10).
The effect of precinct female-to-male income ratio on voter support for gender-neutral amendment to city charter in Lincoln in 2019
Note: plots display unstandardized coefficient estimates from OLS regression models with 90 per cent confidence intervals. All covariates have been recoded to range from 0–1. F:M Income Ratio is the estimated ratio of median earnings of females to males in each precinct. Full regression results in Table C10.

Question 1 in Philadelphia, Pennsylvania
The city of Philadelphia presented voters with Question 1 on the ballot during the municipal primary election held on 21 May 2019. Question 1, titled Gender-Neutral References for City Council Charter Amendment, gave voters in the city the opportunity to vote in favor of altering gendered references in the city charter (for example, councilman) to gender-neutral terms (for example, councilmember). The measure passed, with a Yes vote of 67.8 per cent. We retrieved precinct-levelFootnote 7 election results from the Office of the Philadelphia City Commissioners. Our analysis includes the percent Yes vote on Question 1 for 1,692 precincts, which is reduced to 1,527 once we include the set of controls used in the previous two analyses.Footnote 8 The average precinct in Philadelphia contained 621 registered voters in 2019, with an average of 143 turning out to vote in the May primary. In addition to improving the precision of our unit of analysis from the city to the precinct level, we were able to increase the precision of the moderating variable in the previous analyses (that is, percent female) by using the Pennsylvania state voter file to calculate the percent female of registered voters in each precinct in Philadelphia County.Footnote 9 This enables us to estimate the effect of the F:M Income Ratio conditional on the density of female voters.
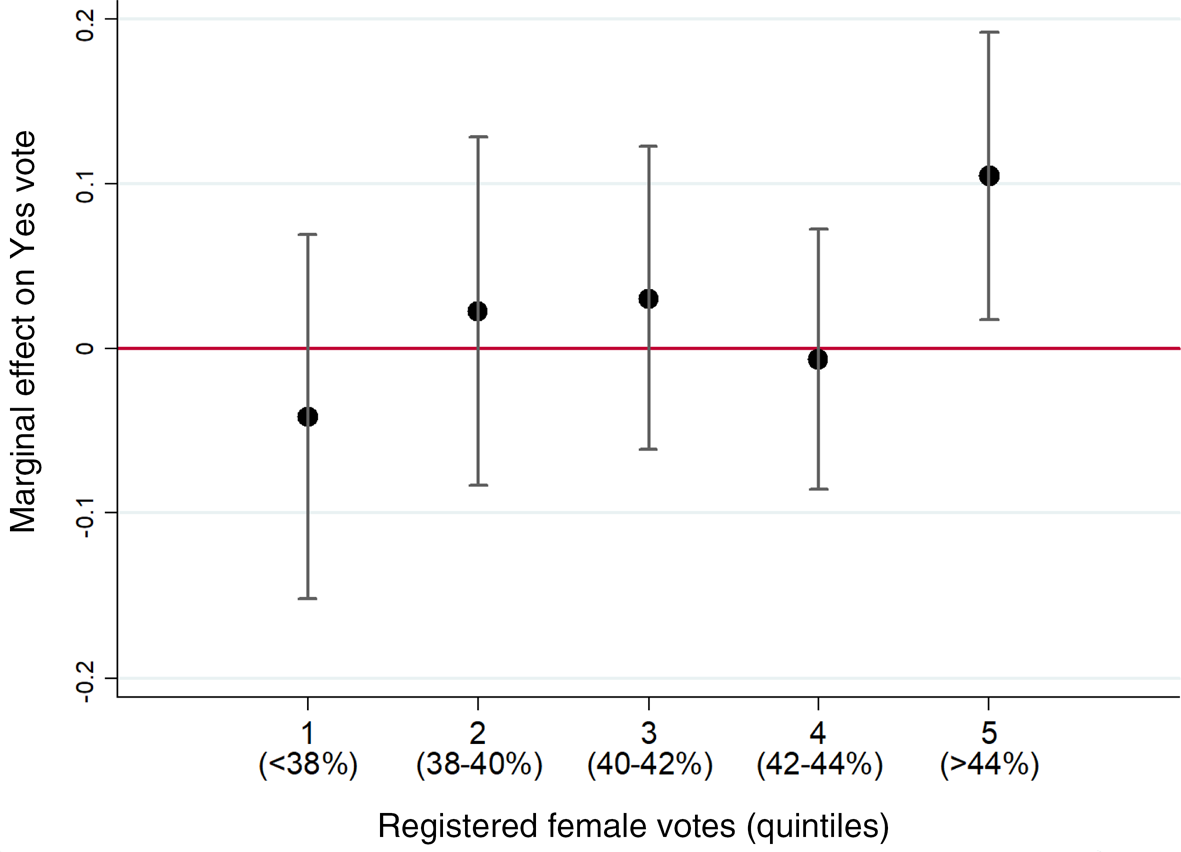
As our primary interest is increasing the precision of our analysis by honing in on female voters, we present the results from an analysis of the effect of precinct-level F:M Income Ratio by quintiles of the percent of registered voters that are female within precincts. The results, presented in Figure 4 (Table C11), reveal that only in precincts with a higher density of female voters do we observe a positive and statistically significant effect of the income ratio. These results are a critical addition to our previous findings: using a drastically smaller unit of geographic aggregation and a moderator focusing specifically on the density of female voters allows us to more precisely infer that our results are driven by female voters who are economically empowered relative to the men immediately surrounding them (that is, in their neighborhood of residence). Finally, as in our previous analyses, we demonstrate that our findings are confined to Question 1 and do not manifest when analyzing a measure on the ballot that has nothing to do with gender politics – in this case, Question 4, which proposed creating a new class of unarmed police officer in the city tasked with regulating traffic and enforcing code violations. Support for this measure is entirely unrelated to precinct differences in the ratio of female-to-male earnings across all quintiles of percent female voters (Table C12).
The effect of precinct female-to-male income ratio on voter support for gender-neutral amendment to city charter (Question 1) in Philadelphia in 2019
Note: plot displays unstandardized coefficient estimates for F:M Income Ratio on predicted Yes vote for each ballot measure from OLS regression models with 90 per cent confidence intervals. Full regression results in Table C11.

Conclusion
It may be tempting to view debates over gendered language as trivial. Existing research, however, demonstrates that the use of gendered language can have deleterious effects for women (Jakiela and Ozer Reference Jakiela and Ozer2018; Prewitt-Freilino, Andrew Caswell and Laakso Reference Prewitt-Freilino, Andrew Caswell and Laakso2012; Stahlberg, et al. Reference Stahlberg and Fiedler2007). In response, global organizations such as the World Bank are moving to use gender-inclusive language to avoid limiting the opportunities for women globally (World Bank 2019). In the United States, efforts to implement gender-neutral language remain politically salient: states and localities continue to adopt amendments to remove gendered language from their constitutions and official documents (Associated Press 2003).
This letter explores historic and recent examples of such amendments and reveals that voter support for implementing gender-neutral language is systematically associated with women's economic resources relative to men. Specifically, our findings suggest that women's economic empowerment is an important factor behind the success of these amendments. One limitation of our study is its reliance on aggregate election results data, which limits our ability to draw firm inferences about the behavior of individual (female) voters. However, we offer ancillary analyses demonstrating that our findings are confined to contexts in which women comprise a larger share of the population, or a larger share of registered voters (such as the Philadelphia analysis), which suggests our findings are driven by female voters. Moreover, we demonstrate that our city-level results in CA and NH hold when analyzing recent municipal ballot measures and using the finest-grained elections results data available (precinct level). The findings across our four cases increase our confidence that our results are generalizable across level of aggregation (city vs. precinct), level of government (state vs. municipal ballot measure), political context (liberal coastal vs. conservative Midwestern state) and time (1974–2019).
There are several possible directions for further research. For example, future studies could investigate popular support for gender-neutral language amendments in other states and localities (for example, New York in 2001), the effect of language changes on other marginalized groups (for example, changing ‘Latino’ to ‘Latinx’), and crucially, how the passage of such amendments shape norms and mass attitudes. On this latter issue, one clear follow-up to our research would be an investigation of whether or not the adoption of gender-neutral language in official state documents affects mass discourse, gender relations or public attitudes concerning gender. Existing research suggests it might. Tankard and Paluck (Reference Tankard and Paluck2017), for example, show that the Supreme Court ruling on gay marriage, an institutional endorsement codified in legal documents, can shape social norms and mass attitudes toward gay marriage and gay people. Other work has shown similar effects of Supreme Court actions on affirmative action and flag burning (Bartels and Mutz Reference Bartels and Mutz2009; Clawson, Kegler and Waltenburg Reference Clawson, Kegler and Waltenburg2001). Further, a vote that results in the successful passage of a ballot proposition is not just a sign of institutional endorsement but of mass public opinion and shared social norms, which can themselves change attitudes, a process that Mutz (Reference Mutz1998) calls ‘impersonal influence’ (see also Paluck and Chwe Reference Paluck and Chwe2017). Thus, it is possible that governmental implementation of gender-neutral language in symbolically important founding documents could have similar effects, though we leave exploration of this possibility to future research.
Supplementary material
Data replication sets are available in Harvard Dataverse at: https://doi.org/10.7910/DVN/RZRIK5 and online appendices are available at https://doi.org/10.1017/S0007123420000332.