Introduction
The user's gaze can provide important information for human–machine interaction, but the analysis of gaze data is very time-consuming (Kurzhals et al., Reference Kurzhals, Hlawatsch and Seeger2017), inhibiting wide adoption in usability studies (Essig et al., Reference Essig, Sand and Schack2010). Mobile eye trackers are wearable head-mounted systems that track the user's gaze and record their field of vision (Duchowski, Reference Duchowski2007) and are also used for usability analysis (Mussgnug et al., Reference Mussgnug, Waldern and Meboldt2017). Important metrics for usability analysis can be established using areas of interest (AOI) analysis (Holmqvist and Andersson, Reference Holmqvist and Andersson2017), where the user's gaze is mapped onto predefined AOIs. Lohmeyer et al. (Reference Lohmeyer, Schneider and Jordi2019) showed that mobile eye-tracking data can bring more insights into the usability engineering process, and usability indicators derived from eye-tracking data allow the assessment of the evolution of not only a product's effectiveness and efficiency but also of its ease of use. However, the standard contemporary process of mapping gaze fixations from an eye-tracking video to AOIs on a static user interface (UI) representation typically has to be done manually (Vansteenkiste et al., Reference Vansteenkiste, Cardon and Philippaerts2015).
The incorporation of automated AOI analysis in usability studies has the potential to make the usability engineering process driven by quantitative metrics. Traditionally, usability engineering relies on qualitative methods such as observations, interviews, questionnaires, and expert opinions, or quantitative metrics such as task completion or time on tasks, which are derived manually from an evaluator present during testing, or from video data. The usage ofeye tracking could potentially automate the analysis of usability studies, as both the collection and analysis of data do not require specific input by the user (Malan et al., Reference Malan, Eloff and De Bruin2018). Based on AOI analysis, metrics related to the ease of use can be computed automatically, independent of an evaluator's bias. This could potentially lead to more data-driven usability engineering process, as it is currently employed in the UI and user experience (UX) design of mobile phone apps and websites.
Several methods for automating gaze object mapping for mobile eye tracking have been proposed, based on the advances in object detection in the field of computer vision. Automated gaze object mapping methods aim to map gaze fixations automatically to AOIs. These approaches can be divided into three categories. First, marker-based approaches for the automatic computation of AOIs have been proposed (Kiefer et al., Reference Kiefer, Giannopoulos and Kremer2014; Zhang et al., Reference Zhang, Zheng and Hong2015). However, these marker constitute an unwanted distraction for the user and are only limited to specific applications. Second, based on feature point detectors such as SIFT (Lowe, Reference Lowe2004), methods have been proposed to either detect whole objects (De Beugher et al., Reference De Beugher, Ichiche, Brône and Goedemé2012; Toyama et al., Reference Toyama, Kieninger and Shafait2012) or to map the gaze coordinate from a planar artistic painting in a geometrically correct fashion on to a reference view of that painting (MacInnes, Reference MacInnes2018). Third, object detection based on convolutional neuronal networks (Garcia-Garcia et al., Reference Garcia-Garcia, Orts-Escolano and Oprea2018) was used by Wolf et al. (Reference Wolf, Hess and Bachmann2018) for computational gaze object mapping (cGOM). This approach automatically maps gaze data to AOIs using the object detection and instance segmentation algorithm provided by Mask R-CNN (He et al., Reference He, Gkioxari and Dollar2017).
Unfortunately, existing methods for automated AOI analysis cannot be applied to the tangible products with a screen-based UI that have become so ubiquitous in everyday life. Screen interfaces are no longer bound to static settings such as desktop PCs, which inhibits the use of the static screen-mounted eye-tracking system as the head of the participant moves freely relative to the screen but are integrated into an increasing number of consumer and medical devices that feature (touch) screens, which can be interacted with and manipulated by hand. These include smartphones, tablets, ATMs, and coffee machines, which we refer to as tangible screen-based UIs. For AOI analysis, it is essential to define the screen's outline as an AOI. However, though the geometric contour of the screen is preserved over time, the content displayed on the screen – the focal point of the interaction – often changes over time, making the screen a dynamic AOI. This limits the application of existing methods such as cGOM (Wolf et al., Reference Wolf, Hess and Bachmann2018), which only detects an entire object but not the content of the screen, and dynamic mapping by MacInnes (Reference MacInnes2018), which requires the mapped plane to contain static high-spatial frequency information.
The objective of this paper is to present and evaluate a method to automatically map the user's gaze on dynamic AOIs to tangible screen-based UIs based on computer vision and deep learning. This paper presents an algorithm for automated Dynamic AOI Mapping (aDAM), which allows the automated mapping of gaze data recorded with mobile eye tracking to the predefined AOIs on tangible screen-based UIs. We evaluate the accuracy and robustness of each individual component of aDAM using two devices with distinct features and geometric properties using data from usability studies. We then compare the time required by an analyst for the automated analysis with aDAM to the current manual analysis.
Algorithm
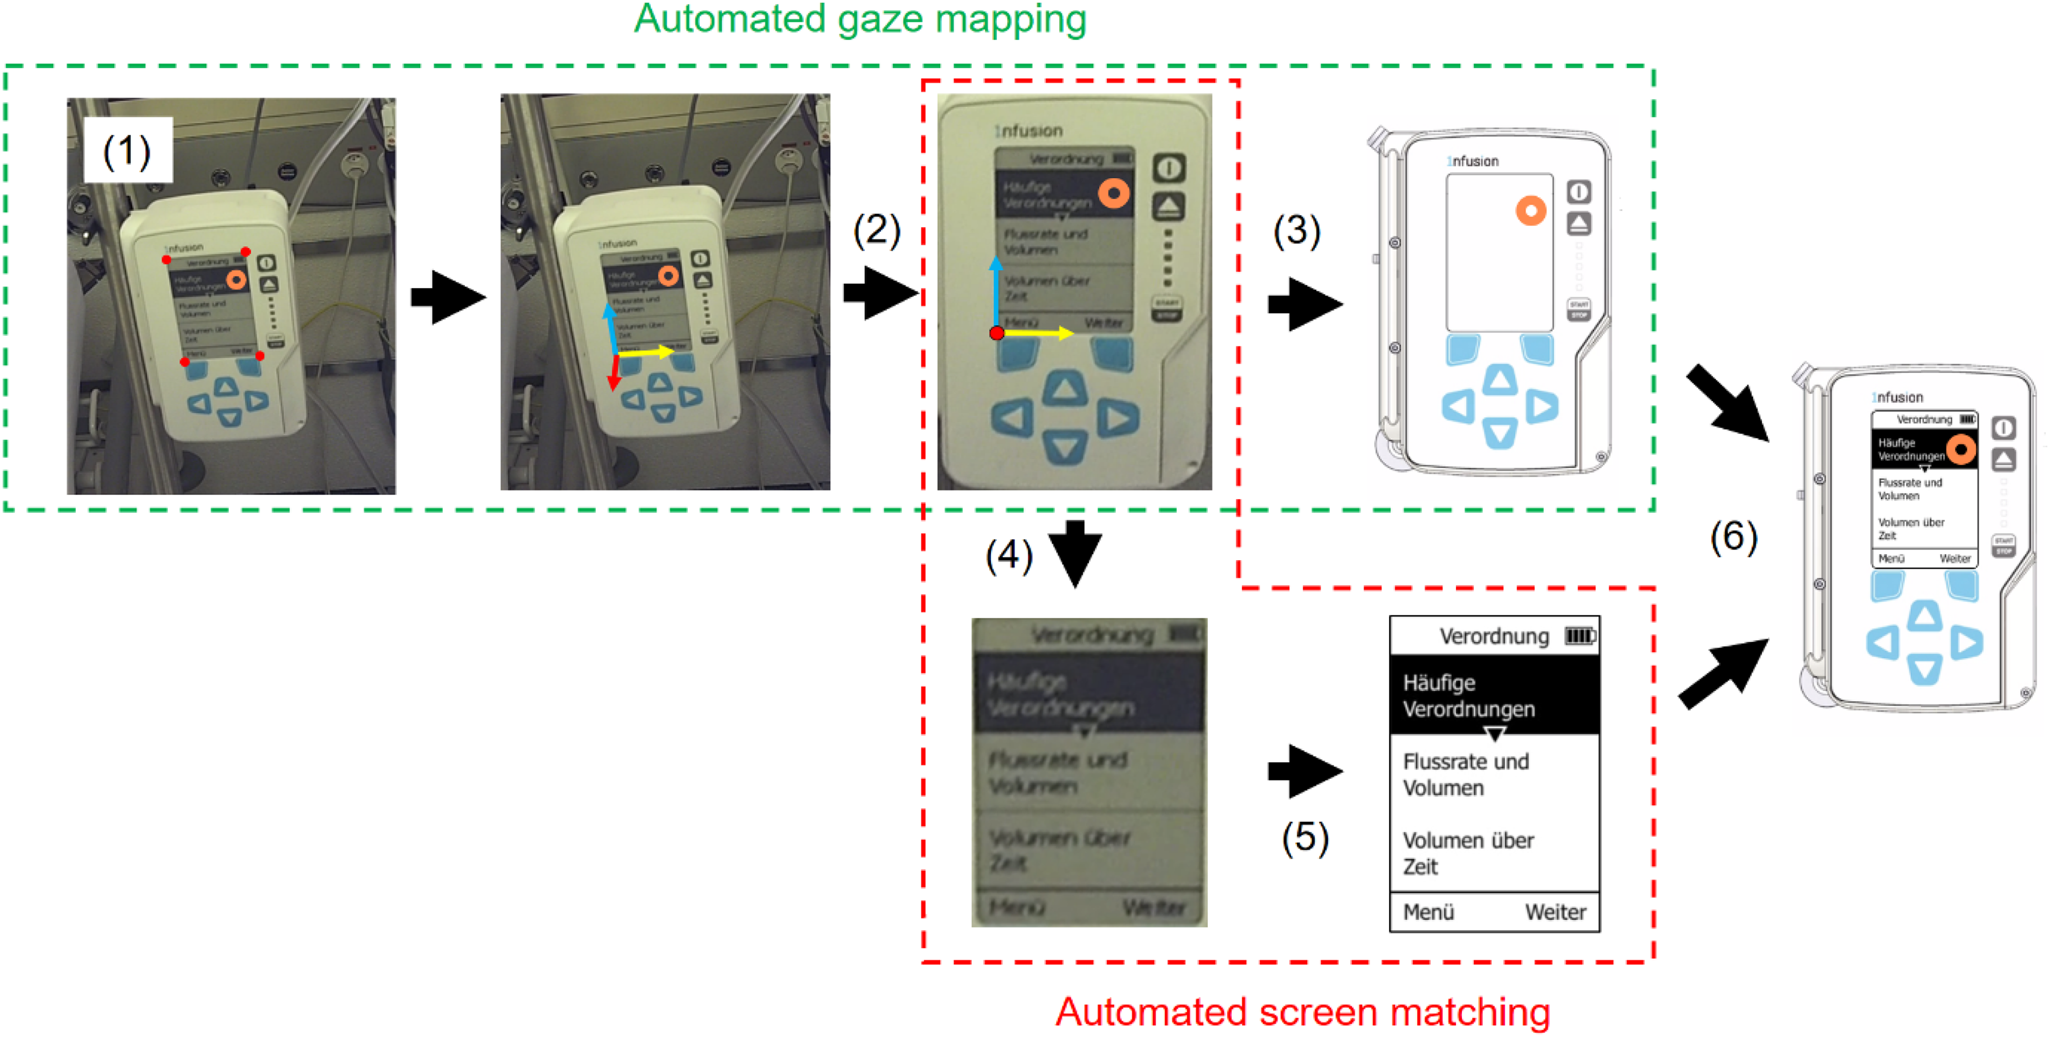
The basic algorithm of aDAM requires two main elements – automated gaze mapping and automated screen matching – which together form the aDAM. Figure 1 shows an overview of the steps required by aDAM, with the gaze mapping element outlined in green and the screen matching element outlined in red. Input is a frame from an eye-tracking scene video with the gaze point coordinate (orange circle). The output of the gaze mapping is the coordinate of the gaze point on a static representation of the UI. The input to the screen matching is the cropped and straightened image of the screen from the frame and the output is the correctly identified screen content for each frame. Combined, they make it possible to map the gaze to a reference view with the dynamic AOI of the screen. To achieve this, aDAM relies on two geometric properties of the screen interface: a planar surface and the rectangular shape of the screen. Overall, the input to the automated AOI mapping is a sequence of frames with a respective gaze point coordinates, formulated in pixel coordinates for each frame and a set of reference screens. The output is the gaze coordinate in the reference UI representation and the screen content for every frame.
Overview of the detailed steps of aDAM, for automated gaze mapping (green) and automated screen matching (red). (1) Tracking of screen outline. (2) Calculation of perspective transformation and mapping onto the static reference UI representation. (3) Application of transformation on gaze point. (4) Isolation of screen. (5) Extraction of screen information through look up in database. (6) Fusion of data for dynamic AOI mapping.

Automated gaze mapping
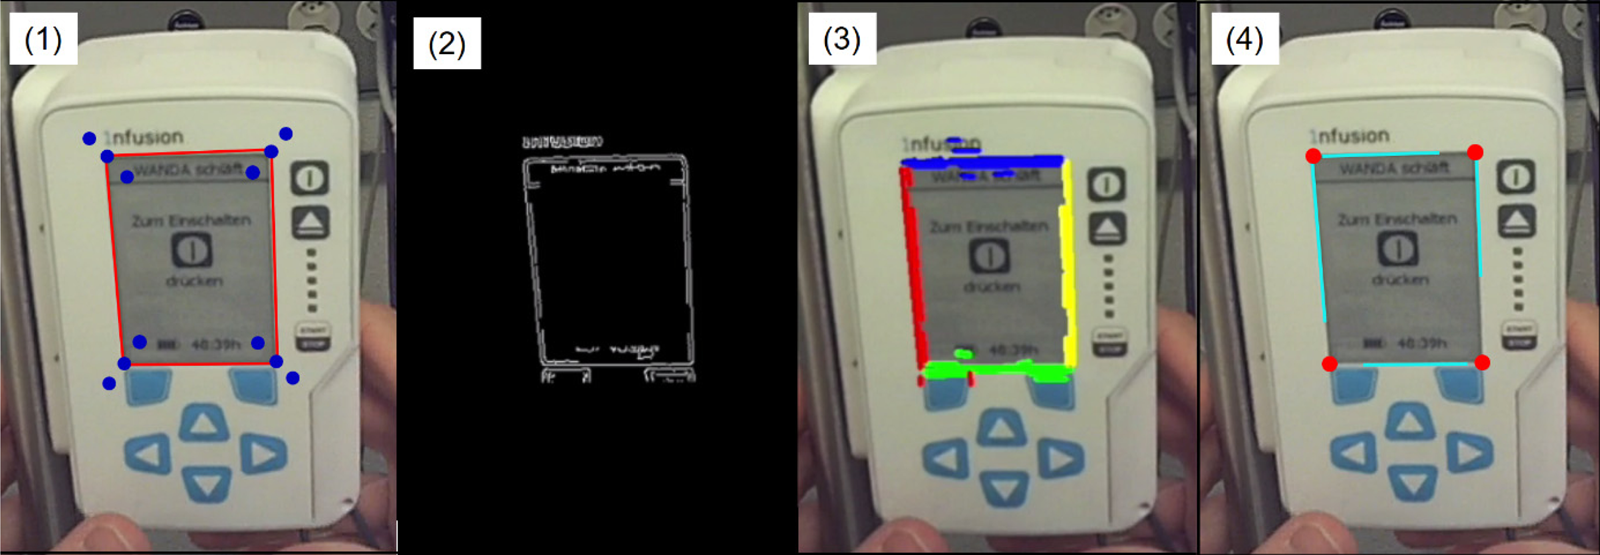
Building on an initial approximation of the location of the screen corners, the exact outline of the screen is determined by using state-of-the-art computer vision algorithms. The starting point of the algorithm, an initial guess for the four corners of the screen (1), is shown in Figure 2. Given the starting point, a region is defined, and a canny edge detector (Canny, Reference Canny1986) is applied (2). A line segment detector (LSD) is used (Grompone von Gioi et al., Reference Grompone von Gioi, Jakubowicz and Morel2012) on the black and white image, and the dominant lines are normalized, weighted, and arranged into four distinct groups. The dominant line in each of the four groups is determined and the intersections between the four lines are calculated (4). This step outputs the coordinates of the corner points in the video frame, which are calculated even if the screen has rounded corners. This algorithm is also robust to a corner point being concealed, for instance by the hand of the user.
Steps for screen edge detection from an initial guess. (1) Initial guess with search region. (2) Canny edge detection in search region. (3) Grouping of line segments. (4) Intersection of dominant line segments which form corner points.

The basis for the automated gaze mapping and the automated screen matching is a perspective transformation of the surface plane of the device. The screen surface can be transformed into a reference coordinate framework by means of a perspective transformation based on the corner points tracked on the screen, step (1)–(4) in Figure 1. Perspective transformation is a non-affine geometric transformation often used to map points or lines from one plane to another (Hartley and Zisserman, Reference Hartley and Zisserman2003). The planar surface of the screen constitutes one plane; a static UI representation of the device with geometrically predefined AOIs, such as the screen outline and/or elements like buttons on the bezel forms a second plane with reference coordinates.
With the perspective transformation, the gaze point coordinate from the video can be mapped to the reference coordinates of the reference image. The output of the eye-tracking glasses provides the coordinates of the gaze in the video, as marked by the orange circle in Figure 1. They are then transformed into the reference coordinate system. The output of this step is the gaze point coordinates in the coordinate system of the reference image. In the coordinate system of the reference layout, AOIs can now be defined geometrically. The hits of the gaze point on AOIs can then be computed: this procedure is called semantic gaze mapping. The AOIs are not limited to the screen but can also incorporate other geometrically fixed elements, such as buttons and instructions on safety labels.
Automated screen matching
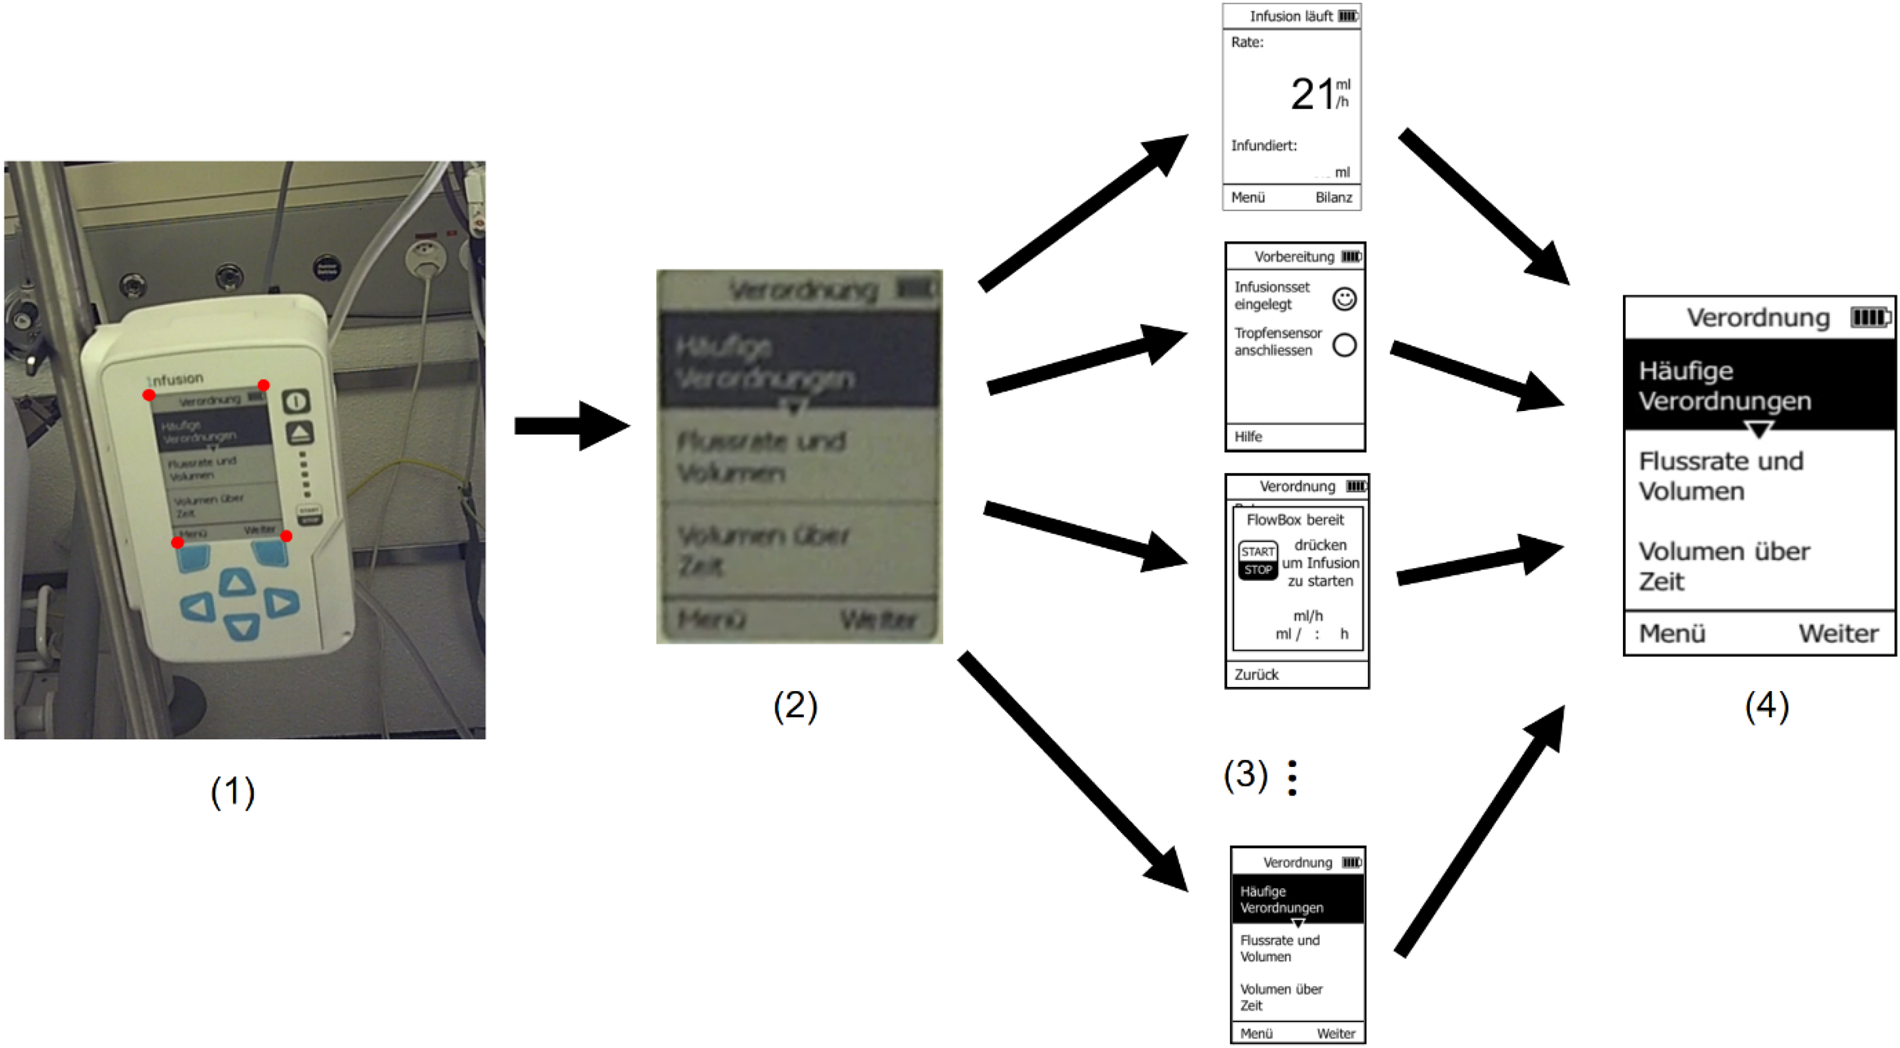
The screen content can be determined with feature point matching by comparing it to a database of given reference screens, as shown in Figure 3. The perspective corrected screen is isolated and compared to all existing screens, in order to find the most matching feature points. We chose the binary robust invariant scalable keypoints (BRISK) algorithm for detecting and computing feature points (Leutenegger et al., Reference Leutenegger, Chli and Siegwart2011) as a license-free alternative to the SIFT detector (Lowe, Reference Lowe2004). The feature points were then matched to their counterparts in the reference screen using a brute-force matcher. All reference screens or screen segments have to be available before this step. Also, the matching can be applied to a predefined section of the screen. Due to the high frame rate of the video, ambiguous screens can appear during transitions between two screens. This is handled by applying a moving average filter to exclude false matches during transitions. Every screen is consequently matched with a time stamp. The output is a time-series with the content of the screen information. This information can then be combined with the predefined static AOIs; for instance, the AOI “screen” is replaced with the dynamic screen from the corresponding frame.
Screen matching. (1) The original frame from the video. (2) Extracted and straightened screen image. (3) Matching of screen to predefined screens. (4) Identified screen content.

Automated screen corner recovery
The location of the corner points of one frame can be used as the first estimate of the corner points of a subsequent image using optical flow, such that no manual input is required. Since a video does not examine isolated frames, but a series of frames, the information of the prior frame can be used to estimate the approximate position of the current corner points for screen outline detection. In case that the prior image contains information that can be used for the estimate of the current image, we use Lucas–Kanade optical flow (Lucas and Kanade, Reference Lucas and Kanade1981) to track the motion of the corner points in the next image. This estimate is then used for the initial guess of the gaze mapping algorithm of the next image. However, this assumes that both frames contain the device and that only a limited relative movement of the screen contour has occurred. Typically, relatively long periods of interaction can be handled in this way.
In case that the prior image contains no exploitable information, the initial guess is reconstructed either by a manual input or with an object detection and instance segmentation approach. If the screen being tracked is not in the frame, for example, because the user is looking away, frames have to be skipped until the screen reappears. In this case, the outline of the screen has to be located and detected. We refer to this as recovery, as we are not using the information of the previous frame. This can be done using a manual input, where the user selects the approximate position of the corner points manually. However, this requires continuous input by the user every time the user looks away from the screen. To avoid this, we employ an object detection algorithm to estimate the location of the device screen.
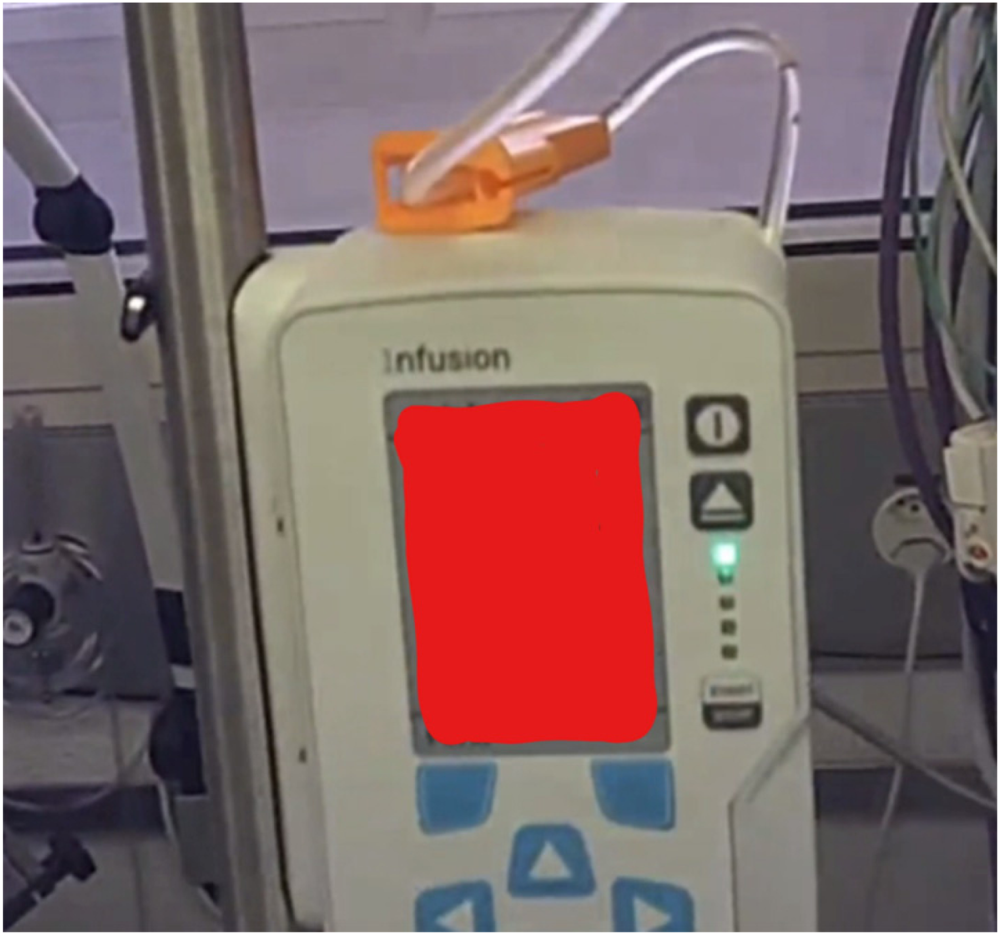
For object detection and instance segmentation, Mask R-CNN is used to estimate the location of the screen outline, which is then used as the initial guess for the line segment detection. Mask R-CNN provides not only a bounding box around an object in an image, as for example Faster R-CNN (Ren et al., Reference Ren, He and Girshick2017), but also a mask that outlines the contour of the object (Fig. 4). In the case of the screen, it outputs a binary mask that covers the screen's contour. However, the mask provided by Mask R-CNN is not precise enough in detecting the screen corners to apply the perspective transformation (see Section “Automated screen matching”), and only provides a good initial guess, much better than just with the rectangular bounding box provided by Faster R-CNN, which is unable to incorporate a perspective tilt. We therefore use the screen outline detection to determine the exact corner points of the screen. Mask R-CNN is trained using a data set generated from the video, which has to be labeled accordingly for every type of device used in a usability study.
Output of mask R-CNN: a binary mask, which approximates the screen contour (in red). The outermost edges of the mask are then used as an initial guess for screen outline detection and subsequent gaze mapping.

The data generated by the screen outline detection can later be used for the training of the neural network. The collection of data for a training data set requires images where the device is present and where the coordinates of the screen outline are known. Implicitly, this is provided by the screen outline detection for every frame. Running the screen outline detection with occasional manual input until enough training data is collected is a time-efficient method at this preparatory step. At a later stage, even larger data sets can be used to re-train the neural network if required.
Methods
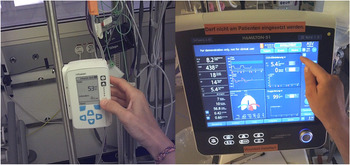
The evaluation of the algorithm is performed using two medical devices, which serve as two extreme examples of tangible screen-based UIs. Figure 5 shows the two devices used for the evaluation: an infusion device (FlowBox, Onefusion AG, Zurich, Switzerland) on the left and a ventilation monitor (S1, Hamilton Medical AG, Bonaduz, Switzerland) on the right. The infusion device has a 3″’ screen with no touch capability and various buttons on the front for interaction and can be easily moved and attached to a pole. The ventilation monitor has a 15″ touch screen, buttons on the bezel and is permanently connected to a stand. They differ considerably in use, size, and functionality, but both feature a rectangular screen. Both devices are typically used in a hospital at the bedside of a patient, and the user, usually a nurse or doctor, interacts with both the device and the patient. In addition, the user can move freely around the bed to examine the patient or to connect or adjust medical devices such as a hose from the device to the patient. In this setting, the user's head moves freely and the perspective of the screen can change with each image. This prevents the use of screen-mounted eye-tracking systems.
The two tangible screen-based UIs used for evaluation. (Left) Infusion device and (right) ventilation monitor.

The different elements of aDAM, such as automated gaze mapping, automated screen matching, and automated recovery, are examined for their accuracy and robustness, as well as the time saved when using aDAM instead of manual mapping. The gaze and scene data used in this study come from separate usability studies conducted with the infusion device and the ventilation monitor, each used by healthcare professionals in a simulated hospital environment. The eye-tracking data was recorded with SMI Eye Tracking Glasses 2w (SensorMotoric Instruments, Teltow, Germany). These mobile eye-tracking glasses track the user's gaze at 60 Hz with a reported gaze accuracy of 0.5°. The scene video is recorded at a resolution of 1280 × 960 at 24 fps. The data were processed and exported from BeGaze 3.7 (SensorMotoric Instruments, Teltow, Germany). The ground truth for the accuracy and robustness evaluation is provided by the evaluation of one analyst.
Automated gaze mapping
An experiment was conducted to compare the geometric accuracy of the automated gaze mapping to a manual mapping done by an analyst. For this purpose, the mapping of the gaze from the video frame to the coordinates in a static UI representation was performed by aDAM and an analyst separately, similar to steps (1)–(3) in Figure 1. The geometric distance (in pixels) between the two coordinates was then calculated and converted to the absolute distance on the device in millimeters. This was done for 100 images for both the infusion device and the ventilation monitor.
Automated screen matching
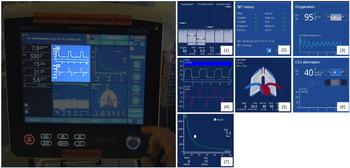
For evaluation, automated screen matching is applied to sample frames from a video sequence and then compared to a manual evaluation. For the infusion device, this is done for the entire screen, as shown in Figure 3, and the screens were sorted according to the sequence they would appear in an actual interaction. However, the ventilation monitor has a more complex interface: for instance, it has four tiles in the main view, which can be configured by the user. As these elements are possible AOIs, we evaluate the screen matching for these sub-screen segments. As the tiles are geometrically well-defined, one can apply a mask, as shown in Figure 6, for each position of the four tiles. To evaluate the automated screen matching for the ventilation device, we took 150 samples frames from four layouts (combinations of screens) and identified the seven individual screen segments present in these four layouts, and which are shown in Figure 6 (on the right).
Matching of predefined sub-screens. (Left) The main screen with the four main tiles, which are masked out individually for the matching process. (Right) The sub-screens that can be configured to take different positions of tiles on the main screen.

Automated screen recovery
An experiment was conducted to evaluate the automated screen recovery depending on the size of different training data sets. This involved collecting 100 images of scenes in the videos when automated screen recovery was required. For these frames, automated screen recovery was applied and checked to see if the screen contour found with Mask R-CNN and the subsequent line segment detection was correct. Both frames with and without a screen present were used. This was done for both the infusion device and the ventilator monitor using independent training data of different sizes (10, 50, 150, 200, 250, and 300 images). They were split into training and validation sets at a 9:1 ratio.
Time analysis
To compare the effort required for manual mapping and automated mapping with aDAM, the times required were compared for both aDAM and five expert analysts. Both manual mapping and aDAM require a fixed effort to prepare and export data at the beginning and end of an analysis, regardless of the video size. For the mapping process, we define a mapping rate: how many minutes of gaze data are mapped per minute. For manual mapping, both the fixed effort and the mapping effort require constant attention and interaction by the user. For aDAM, we differentiate between the required user effort and the pure computation time, which does not require any interaction on the part of the analyst. For aDAM, there is a fixed user effort and a fixed computing effort for preparation and export. No effort for the analyst is required for the mapping since it is a pure computational process.
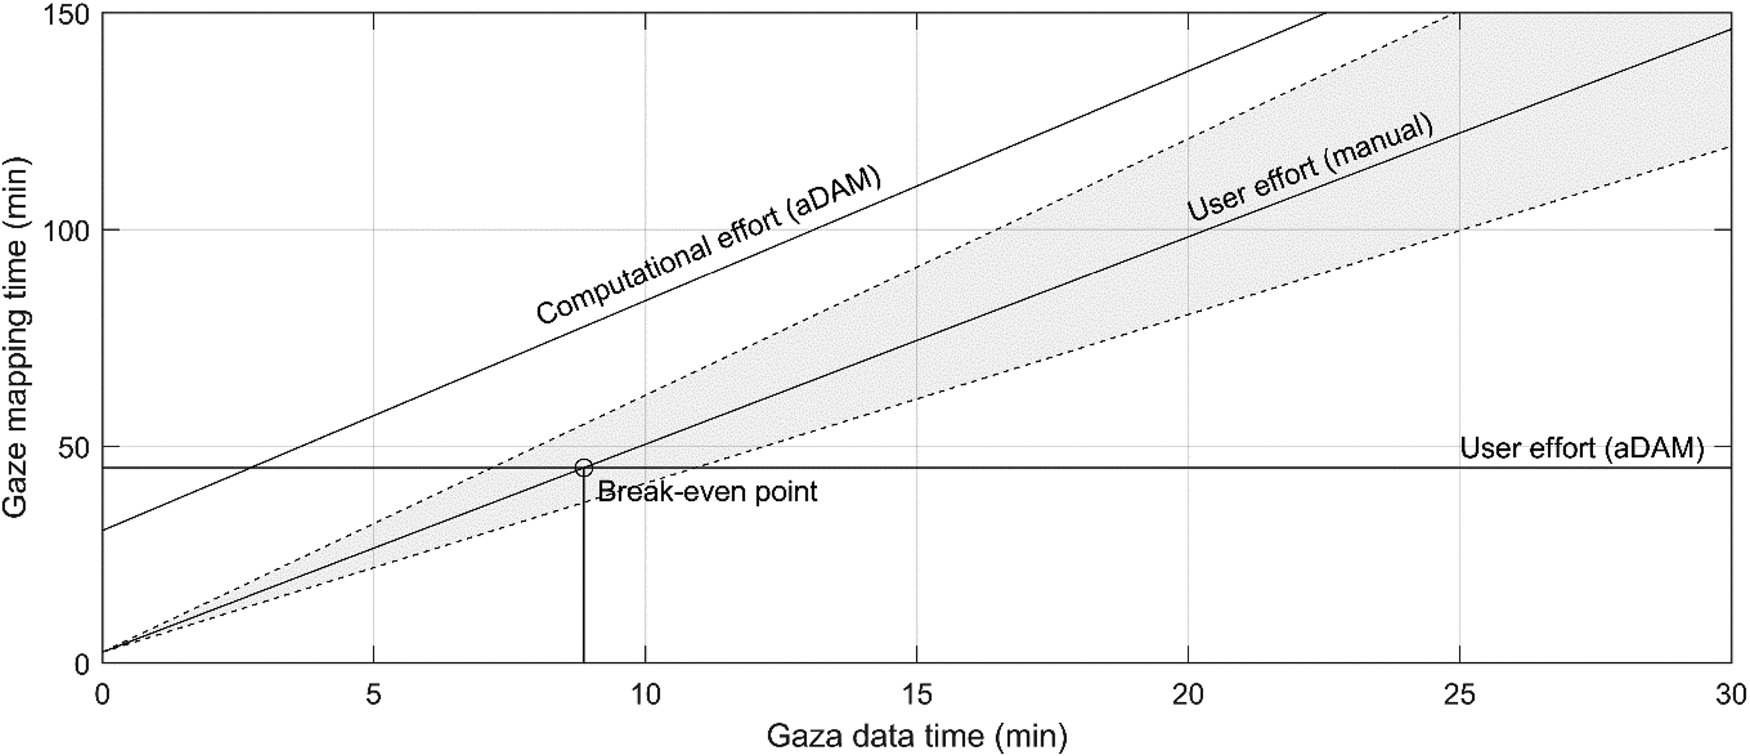
From the recorded efforts we calculate the break-even point, which is the gaze data sample size for which aDAM's fully automated approach requires less effort on the part of the analyst than the manual mapping. To do this, we used 2-minute video segments from five different eye-tracking videos from the usability study with the infusion device to have five expert analysts carry out the manual mapping and one analyst carry out the mapping using aDAM. The five expert analysts had multiple years of experience and analyzed eye-tracking data on a daily basis. The analyst using aDAM was intensively trained to use the algorithm. We recorded the time required by both the analysts and aDAM to calculate the fixed effort per user, the computational effort, and the mapping rates, similar to Wolf et al. (Reference Wolf, Hess and Bachmann2018). The mapping rate is the ratio of the mapping time and the data sample size. The evaluation of the runtime and training of data with aDAM were performed using an NVIDEA Tesla V100 (Graphics Processing Unit) via Amazon Web Services (AWS) cloud computing. Semantic Gaze Mapping by the experts was performed using BeGaze 3.7.
Results
Automated gaze mapping
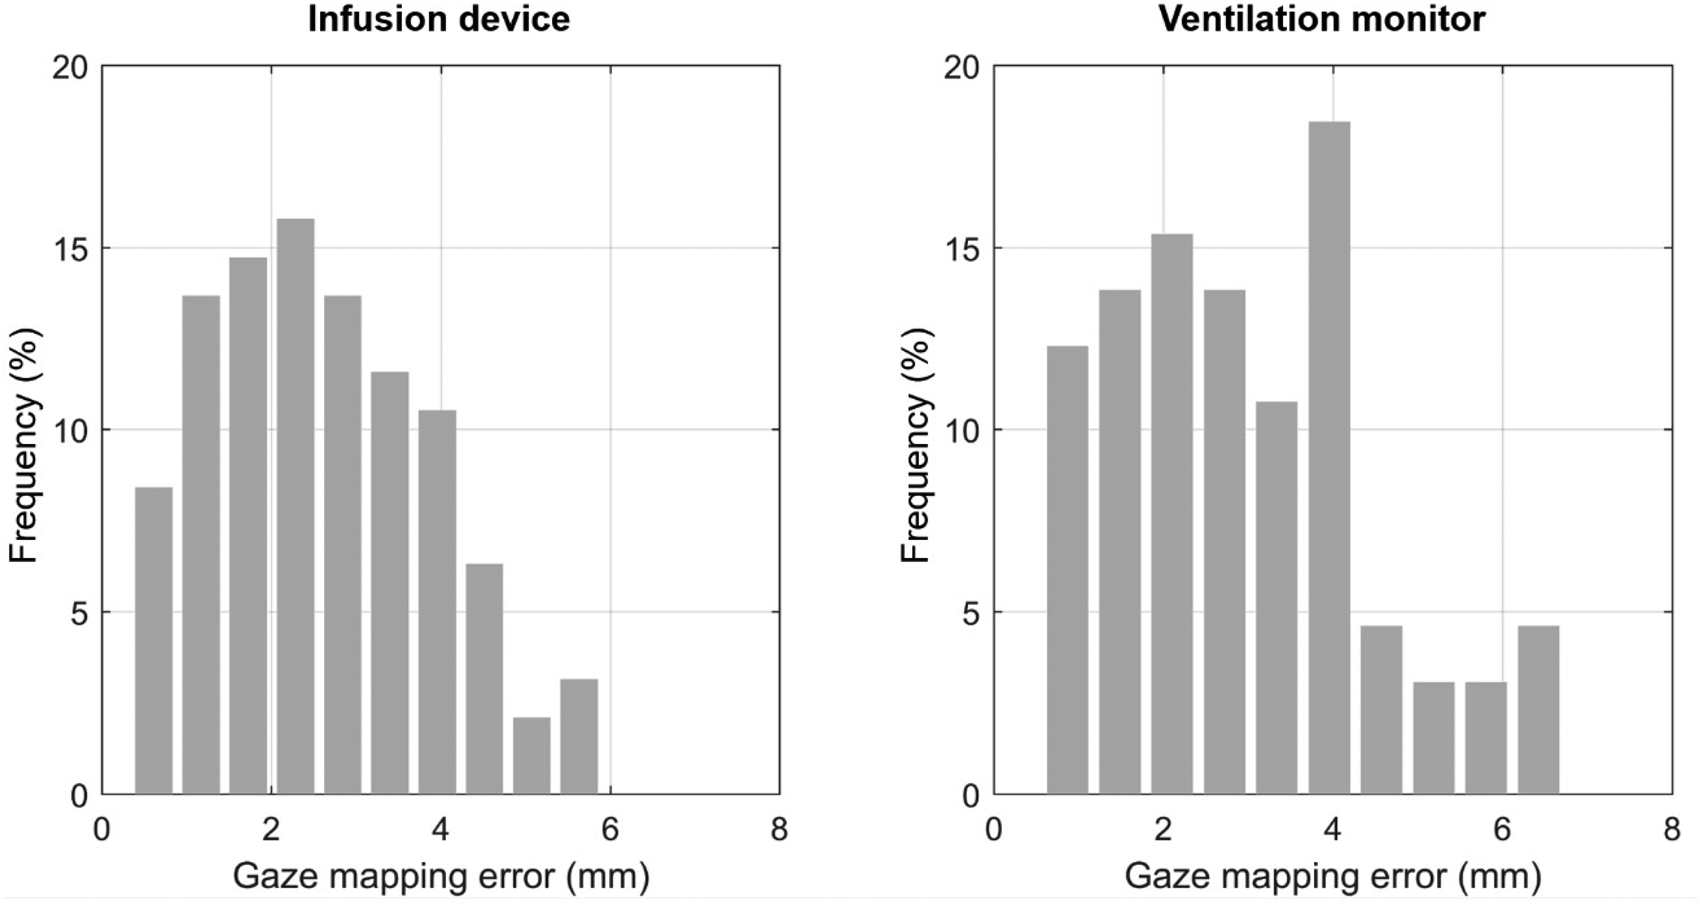
The mapping is robust for both the infusion device and the ventilation monitor, as 95% of all mapped points have less than 5.4 and 6 mm error, respectively, which corresponds to 0.62° and 0.69° error in visual angle (degree) at a distance of 50 cm between eye and the object. Figure 7 shows the results for the mapping error for both the infusion device and the ventilation monitor. The narrow distribution of the mapping error for both devices points to the robustness of the mapping.
Error distance between manual gaze mapping of an analyst compared to aDAM for the infusion device (left) and the ventilation monitor (right). The error indicated corresponds to the absolute distance on the surface of the device.

Automated screen matching
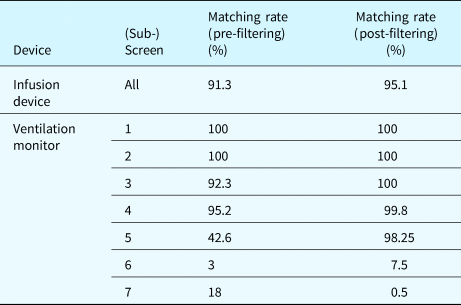
aDAM achieves a 95% overall matching rate for the infusion device and 98% for most screens of the ventilation device. Table 1 shows the results for matching success of both the infusion device and the ventilation monitor without gaze mapping. For the infusion device, a matching rate of 95.1% was achieved when using the filter. Without the filter, the matching rate was 91.3%. The screen matching remained at the same rate even for one screen where the number on the screen changed due to a user input (manual input to set the infusion flow rate). For the ventilation device, the result for each of the seven sub-screens is presented in Table 1. For screens 1–5, the matching rate is over 98% when using the filter. However, for screens 6 and 7, that can be seen in Figure 6, the matching rate is 7.5% and 0.5% after filtering and 3% and 18% before filtering. Screen 6 was often misattributed to screen 3, which has a quite similar arrangement of features. Screen 7 was misattributed to different screens, which may be the reason that the screen seems to have the least features.
The matching rate for the infusion screens and the ventilation sub-screens with the filter applied (post-filtering) and without the filter (pre-filtering)

Automated screen recovery
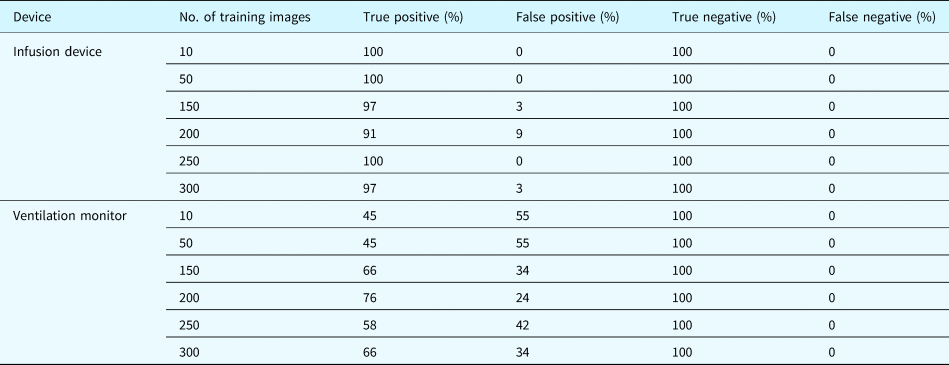
The best recovery rate that is achieved with the data sets available is at 100% for the infusion device and 76% for the ventilation monitor. For both the infusion device and the ventilation monitor, the true negative rate is 100%, meaning that no “screen” was detected in the frames in which no device is present. The true positive rate (the frames where the device is present and a recovery should be possible) for the infusion device is above 90% for the entire range of data size, as shown in Table 2. For the ventilation monitor, the true positive rate ranges from 45% for 10 images in the training set to 76% for 200 images. The true positive rate decreases to 66% when the number of images in the training set is increased to 300.
True positive rate for the screen recovery of both the infusion device and the ventilation monitor for different numbers of training images

Time analysis
The break-even point for an analyst's effort for aDAM compared to manual analysis is 8.9 min gaze data time. The manual analysis requires a fixed effort of 2.5 min for preparation and export. The mapping rate ranges from 3.89 to 5.92 with a mean mapping rate of 4.79 min for the five analyst. For aDAM, the fixed user effort is at approximately 45 min for the assisted labeling of the data. Another 30 min of computation time are required for the training of the weights for Mask R-CNN. The mapping rate, which consists of pure computational effort, is 5.3 min per min gaze data. The break-even point for the analyst's effort, as shown in Figure 8, does not include the computation time.
User effort for ADAM and manual analysis. For the user effort of the manual analysis, the minimal and maximally measured mapping rate are also depicted. The intersection of user effort for aDAM and manual analysis occurs at 8.9 min gaze data time.

Discussion
We presented a method to automatically map a user's gaze point on dynamic AOIs on tangible screen-based UIs using computer vision and deep learning, and evaluated it with data from two use case examples. The goal of the evaluation was to assess the accuracy and robustness of the different elements of aDAM and to compare an analyst's effort analyzing data with aDAM to the current standard of manual analysis with a usability study.
The accuracy and robustness of both the automated gaze mapping and the screen matching indicate that aDAM can be applied to a wide range of products. The two medical devices selected for evaluation represent very different types of interfaces with different screen sizes and cover a wide range of applications such as tablets, ticket vending machines, and many other industrial and medical UIs. The screen outline detection required for perspective transformation and subsequent gaze mapping has proved to be robust and was able to handle partial occlusions, for example, the obstruction of the screen by a user's hand. In addition, the screen matching rate was encouragingly high and robust for all screens displayed by the infusion device and for most of the screens displayed by the ventilator monitor. The resulting errors result either from the inaccuracy of the screen outline detection, which leads to a slightly distorted perspective transformation, or from the mapping of the reference that was performed manually. The screens that had a low matching rate had fewer feature points that could be used for the matching. This indicates that for screens featuring no unique characteristics, the extraction of screen content must be more elaborate and may include optical character recognition or incorporate prior knowledge on the screens for a spatially more specific approach.
The screen recovery allows for the automated operation of aDAM and works with relatively little training data. For the infusion device the automatic recovery works well, with a true positive rate (TPR) of above 90% for 10–300 images in the training data – a surprisingly low number. For different training data, the mask provided by Mask R-CNN may vary and may not allow for successful initialization of the LSD, so recovery for that frame fails. For the ventilation monitor, the TPR peaks at 76% and does not reach quite the same result as the infusion device. We assume that larger data sets would be required. One has to consider that the sizes of data sets used for training are very low compared to other applications. Using the newest MS COCO (Lin et al., Reference Lin, Maire and Belongie2014) weights, trained with hundreds of thousands of labeled images, transfer learning can be applied, allowing the model to work with less input data. Furthermore, the training images stem from the very same environment that the Mask R-CNN is applied to. We, therefore, assume that when the environmental conditions change, but the stimulus remains constant, a re-training would be necessary based on images taken under the changed environmental conditions, resulting in a larger data set. Especially with more complex interfaces such as the ventilation monitor, the risk of overfitting is higher when using small data.
aDAM allows, for the first time, the automated AOI analysis of tangible screen-based UIs with AOIs that change dynamically over time. With aDAM, the automatic mapping of the gaze from the tangible screen-based UI is independent of the (changing) screen content, which would be a problem for the purely feature point matching approach as proposed by MacInnes (Reference MacInnes2018). The AOI on the UI representation can be static over time, if the UI includes buttons, for instance, but with the screen matching approach, the AOIs can change over time: aDAM can explicitly taking into account dynamically changing screen content. aDAM is the first approach that allows the automated AOI analysis on tangible screen-based interfaces while taking into account temporally dynamic changing surface conditions. However, the mapping is currently limited to 2D planar surfaces. Extending the mapping of gaze to 3D objects, such as UI with AOIs on a second surface, would require computationally expensive 3D reconstruction algorithms (Lepetit and Fua, Reference Lepetit and Fua2005; Moons et al., Reference Moons, Van Gool and Vergauwene2008) combined with methods for gaze depth estimation (Mansouryar et al., Reference Mansouryar, Steil, Sugano and Bulling2016).
The algorithm requires a minimal input by the analyst for setup and training, whereas the analyzed gaze data duration and effort is only determined by computation time. For every experimental setup where the stimulus and the environment change, such as a new usability study, aDAM requires additional initial setup time. Time is required by an analyst to collect training data and to train the convolutional neural network model based on the Mask R-CNN approach, which is used later for screen corner recovery in aDAM. However, this setup can be used for any number of participants thereafter, as the analysis effort with aDAM is then determined by computation time, with no interaction on the part of the analyst. The collection of training data and labeling of the screen outline can also be assisted by the methods presented in this paper. The efficiency of the approach for data analysis could increase the viability of mobile eye tracking in usability testing for a wider audience. Although there is some variability in the analysis time by the experts, and a potentially even higher analysis time for non-experts, in the future the computational power increase, this will only make aDAM more viable. Furthermore, cluster-based analysis (Saluja et al., Reference Saluja, Jeevithashree and Arjun2019) could be used to further process the data.
The following limitations must be addressed: First, though the two devices for the evaluation were chosen to represent two extremes on the spectrum, the applicability to other types of the devices must still be demonstrated. Second, we extrapolated from 10 min mapped gaze data per analyst for the time analysis. However, we argue that the mapping rate of an analyst effectively decreases over time, due to factors such as required breaks and fatigue, which would favor our algorithmic approach even more. Third, the computations were done using cloud computing. aDAM also runs on normal desktop computer, but much more slowly, due to computational limitations. However, we argue that cloud computing services are already publicly available at a low cost (3$/h) and should not limit the application. Fourth, we hypothesize that when multiple screens are too similar or that do not contain enough features, it can lead to a decreased performance of the screen matching algorithm. Finally, the aDAM is currently limited to settings where there is only one screen present. The method could be extended in the future to handle multiple screens.
Conclusion
We presented and evaluated a method, aDAM, to automate AOI analysis for mobile eye tracking on tangible screen-based UIs. The efficiency of the approach offers the potential for a broader adoption of mobile eye tracking in usability testing for the development of new products and may contribute to a more data-driven usability engineering process in the future.
Acknowledgment
Code and a video example have been made available at https://gitlab.ethz.ch/pdz/aDAM.git.
Martin Batliner is a PhD student at the Product Development Group Zurich at ETH Zurich. His research focuses on the role of testing and iterations in the product development process of medical devices at the interface of device, user and patient. He holds an MSc in mechanical engineering.
Stephan Hess is a PhD student at the Product Development Group Zurich at ETH Zurich. He holds an MSc in mechanical engineering. His research focuses on the usability testing of medical devices and the automation of usability test analysis methods.
Constantin Ehrlich-Adám is a master student at the Product Development Group Zurich at ETH Zurich. He is interested in human computer interaction and user experience and holds a BSc in mechanical engineering from ETH Zurich.
Quentin Lohmeyer is a post-doctoral researcher and lecturer at the Product Development Group at ETH Zurich. He is interested in how mechanical systems and human thinking processes work. In his research, he uses eye-tracking to investigate cognitive strategies of novice and expert in order to reveal successful behavioral patterns.
Mirko Meboldt is a professor of product development and engineering design at ETH Zurich. He started his industrial career at Hilti AG, Liechtenstein, where he was responsible for global technology and product development processes. He is interested in human-centered product development and regards the connection of research and education as the key to excellence in training. His main research focuses on the development of new products in the field of mechanical engineering, biomedical applications, and associated technologies. He holds an MSc and a PhD in mechanical engineering from the University of Karlsruhe (KIT), Germany.