


Introduction
Though several types of crystals form weak layers in the snowpack, surface-hoar layers are particularly persistent and dangerous. Surface hoar forms in all snow climates and, once buried, sometimes persists for months. Even experienced avalanche professionals find judging the stability of surface hoar layers to be difficult; in Canada, surface-hoar layers are responsible for more avalanches involving professionals than any other weak layer (Reference JamiesonJamieson, 1995, p. 18). An improved knowledge of the strength and hardness changes in surface hoar through time will improve our understanding of this critical weak layer.
A number of past studies investigated surface hoar. Reference Lang, Leo and BrownLang and others (1984) and Reference Hachikubo and AkitayaHachikubo and Akitaya (1997) documented the necessary conditions for surface-hoar formation. Extensive field campaigns in Canada demonstrated changes in surface-hoar layers through time, their persistence and their contribution to avalanche formation (e.g. Reference JamiesonJamieson, 1995; Reference Jamieson and SchweizerJamieson and Johnston, 1999; Reference Jamieson and JohnstonJamieson and Schweizer, 2000; Reference Chalmers and JamiesonChalmers and Jamieson, 2001, Reference Chalmers and Jamieson2003). The best field indication for surface-hoar strengthening, other than direct strength measurements, is the thinning of the surface-hoar layer and a decrease in the maximum-size crystals in the layer (Reference Jamieson and SchweizerJamieson and Schweizer, 2000). Less research has focused on microstructure, though Davis and others (Reference Davis, Jamieson, Hughes and Johnston1997, Reference Davis, Jamieson and Johnston1998) used thin sections to carefully analyze changes in surface hoar through time. Reference Jamieson and SchweizerJamieson and Schweizer, 2000 proposed a conceptual model of changes in surface-hoar microstructure over time that encourages strengthening. In essence, in their model strengthening occurs due to weak-layer thinning, which allows the surface-hoar crystals to penetrate the layers above and below and thereby strengthens the contacts with those layers.
This paper builds on previous research by analyzing a surface-hoar layer on two different days on two parts of a single slope with a new instrument. We made detailed measurements of penetration resistance with the SnowMicroPen (SMP; Reference SchneebeliSchneebeli and others, 1999), and supplemented those data with quantified loaded column tests (QLCTs; Reference Landry, Borkowski and BrownLandry and others, 2001) which allowed the calculation of a shear strength index. The primary purpose of our research is to investigate changes in the penetration resistance, as measured by the SMP, of a buried surface-hoar layer.
Field Area and Methods
Field area and weak-layer formation
For sampling, we utilized a slope in the Lionhead area, located about 15 km west of West Yellowstone, Montana, U.S.A. (approximately 44°45’ N, 111°15’W). The slope is northeast-facing, generally planar, and protected from ridge-top winds, and the areas sampled have slope angles of 25–28°. A layer of 15–20mm surface hoar formed on the slope from 21 to 26 December 2001. This layer was buried on 27 December, and we sampled areas on the slope on 9 and 15 January. No remote instrumentation is available at this site, so we can only roughly reconstruct the evolution of the weak layer and slab. After deposition, a thin slab of snow (28 cm) buried the surface hoar before the 9 January sampling day. Between the 9th and the 15th little new snow fell and the measured shear stress on the weak layer−calculated from the slope angle, slab density and slab thickness−increased from 148 to 170Nm–2 between the two days. It is important to note that we sampled two different areas on the same slope. Though the slope appeared to be relatively uniform, we cannot be sure that the initial conditions for each of our sampling areas were exactly the same.
Data collection
We used the QLCT to measure changes in an index of shear strength of the targeted surface-hoar layer. Reference Landry, Borkowski and BrownLandry and others (2001) provide a detailed description of the method and the calculation of the index. The SMP provided the hardness measurements. The SMP is a motor-driven, constant-speed micropenetrometer which generates high-resolution data, sampling 250 measurements of hardness (penetration resistance) per mm. Previous work with the SMP demonstrates its effectiveness for discriminating between different crystal types and different layers (Reference Johnson and SchneebeliJohnson and Schneebeli, 1999; Reference SchneebeliSchneebeli, 1999; Reference Schneebeli, Pielmeier and JohnsonSchneebeli and others, 1999; Reference Pielmeier, Schneebeli and StuckiPielmeier and others, 2001; Pielmeier and Schneebeli, in press), though none of this research has investigated the characteristics of a particular weak layer.
We sampled two 900 m2 areas (30 by 30 m) located with-in 50 m of each other. On each day, we collected the following: (1) a manual snow profile (Reference ColbeckColbeck and others, 1990); (2) 50 QLCTs (Reference Landry, Borkowski and BrownLandry and others, 2001), which provided a shear strength index and shear stress data; and (3) a number of SMP profiles. Within each 900 m2 sampling area there were five snow pits, and we conducted ten QLCTs in each pit (for a diagram of the pit layout, see Reference LandryLandry and others, 2002). We took our SMP measurements in a grid with 3 m spacing throughout the area, being careful not to disturb the QLCT snow pits. We conducted a finer grid, with 1 m spacing, around the central QLCT pit in the middle of the sampling area, and adjacent to that area we conducted a small grid with 0.5 m spacing. A total of 86 SMP profiles were collected on the first day and 129 on the second day; equipment difficulties on the first day prevented the collection of additional data, so no 0.5 mgridwas sampled on that day.
Data analysis
For the QLCT data, we pooled the measurements of the shear strength index for each day and tested the data for normality using the Lilliefors test (Statsoft, 1994). Both days had normally distributed data (p>0.05), so we used a standard t test to test for differences in the index of shear strength between the two days.
For the SMP data, no adequate algorithms currently exist for layer identification. Therefore, we manually located the surface-hoar layer boundaries in each SMP profile (Fig. 1). Boundaries in the SMP signal are not discrete like those often plotted in manual snow-pit profiles. Instead, there is a gradation from layer to layer that is caused both by an actual gradation of the snow hardness and by the size of the tip of the SMP. The tip of the SMP is 5 mm in diameter and about 5 mm long, and the upper third of the tip has about two-thirds of the surface area. For these profiles we defined the top of the layer as the location where the baseline of the signal stopped dropping and became consistent, while the bottom of the layer was where the baseline of the signal began to increase again (Fig. 1). This helped assure that the probe tip was within the weak layer for the distance we defined as the surface-hoar layer thickness and that our statistical measures reflected what was happening within the layer. In spite of the complications involved, for most profiles the manual delineation of the weak layer was relatively straightforward.
ASMP profile from 15 January 2002 showing (a) the location of the surface-hoar layer, (b) our manual delineation of the exact boundaries of the surface-hoar layer for our analyses, and (c) a detailed view of some of the SMP signal within the surface-hoar layer.

We then used Interactive Data Language (IDL) data analysis software (RSI, 1998) to calculate the layer thickness and a variety of statistical measures for the force signal for each profile. Since the average weak-layer thickness was about 8 mm, the statistics for the weak layer of an average profile were based on about 2000 force measurements. From these force measurements we calculated a variety of statistical measures for each profile including parametric and non-parametric measures for central tendency and spread (mean, median, minimum, maximum and a variety of quartile measures) and for measures of dispersion (standard deviation, the semi-interquartile range and the quartile coefficient of variation). Since our goal was to compare these statistical measures between the two days, we tested each day’s data for normality. Most variables did not pass the Lilliefors test for normality, so we used the non-parametric Mann–Whitney U test to compare the two days (Statsoft, 1994).
To test the effect of small inconsistencies in our manual delineation procedure for the layer identification, we took the delineated layers and added 5% of the total layer thickness to each boundary to form a hypothetical thicker layer. We also subtracted 5% of the layer thickness from our original boundaries to form a hypothetical thinner layer. We then ran our statistical analyses on our manually delineated layer, and on the thicker and thinner layers, and compared results to make sure that small differences in the manual delineation of the layer would not affect our results. We tested the significance of the differences with the Mann–Whitney U test.
Results and Discussion
Measurements with the QLCT demonstrated a significant (p<10–4) increase in the shear strength index from 375 to 523 Nm–2, and slightly increasing shear stress (from 148 to 170 N m–2) between the two days and the two parts of the slope (Table 1; Fig. 2). Reference LandryLandry (2002) notes that these two sampling days provided the most consistent QLCT results observed in a 2 year study of slope-scale spatial variability in a variety of locations, with coefficients of variation of about 10%. See Reference Birkeland and LandryBirkeland and Landry (2002) and Reference Landry, Birkeland, Hansen, Borkowski, Brown and AspinallLandry (2002) for a more complete discussion of these data. Though in this paper we correlate some changes in the QLCTshear strength index to the SMP signal within the weak layer, the two tests are quite different. The QLCT is a test whereby a vertical load is rapidly applied to an isolated column until the weak layer fails, and each test covers approximately 8×10⁻² m2 (Reference Landry, Borkowski and BrownLandry and others, 2001). This is more than three orders of magnitude larger than the area covered by a single SMP penetration test, which covers about 2×10⁻⁵ m2 as the probe is inserted perpendicular to the snowpack.
Box plots of selected variables showing the changes in (a) QLCTshear strength index, (b) layer thickness, (c) median of the SMP signal, and (d) the maximum of the SMP signal between 9 and 15 January. The thickness and the median signal do not statistically differ between the two days, while the shear strength index and the maximum signal increased. Outliers are 41.5 times the interquartile range (height of the box) away from the edge of the box, and the extreme values are 43 times the interquartile range away from the edge of the box.
Results from measurements with the QLCT (n = 50 for 9 January and n = 48 for 15 January 2002)

Our manual snow-pit measurements are consistent with a strengthening surface-hoar layer. On 9 January 2002 the maximum crystal size in the layer was 15 mm, while on 15 January the maximum size was 10 mm. We measured the thickness of the surface-hoar layer at only one point in the snow pit and rounded it to the nearest cm. Thickness decreased from 2 cm on the first day to 1cm on the second day. Even though these data are from two points about 100m apart, the decreases in maximum crystal size and the thinning of the layer are consistent with other observations of surface-hoar strengthening (Reference Jamieson and SchweizerJamieson and Schweizer, 2000).We do not have continuous snowpack temperature measurements, but air temperatures remained cold between the two sampling days, which should have resulted in reasonably strong temperature gradients through the layer and thereby inhibited sintering between the surface hoar and the adjacent layers. The temperature gradient through the surface-hoar layer was 8°Cm–1 on 9 January and 16°Cm–1 on 15 January.
The SMP data provide interesting results. First, in contrast to our limited manual measurements, the larger number of spatially distributed SMP measurements showed weak-layer thickness did not significantly change between the two days and sites (p = 0.58), remaining roughly constant at about 8 mm (Table 2; Fig. 2). The variance of the thickness decreased between the two days. This is consistent with, but at an entirely different scale than, results reported by Reference Davis, Jamieson and JohnstonDavis and others (1998) for thin-section measurements of surface-hoar layers. There is no discernible linear spatial trend in the data for either day; a multiple regression analysis using layer thickness as the dependent variable and the x and y coordinates as the independent variables resulted in coefficients of determination less than 0.07. Our results appear to contradict the conceptual model for surface-hoar strengthening through weak-layer thinning, as well as research investigating strength changes in surface-hoar layers that have correlated weak-layer thinning with increasing strength (Reference Jamieson and SchweizerJamieson and Schweizer, 2000). However, our research is much more limited and involves two different parts of the same slope. Though we chose the research site for consistency, and the lack of a linear spatial trend for each day suggests a relatively consistent weak-layer thickness across the slope, it is possible that our two sampling areas started with weak layers of differing thickness. Further, we collected our datasets only 6 days apart, the slab was relatively thin (about 25 cm), and little additional load was added to the snowpack between the two days. Even given these limitations, it is interesting that our data demonstrate sizable weak-layer strengthening associated with no, or perhaps only limited, weak-layer thinning.
Results from SMP measurements (n=86 on 9 January; n =129 on 15 January)
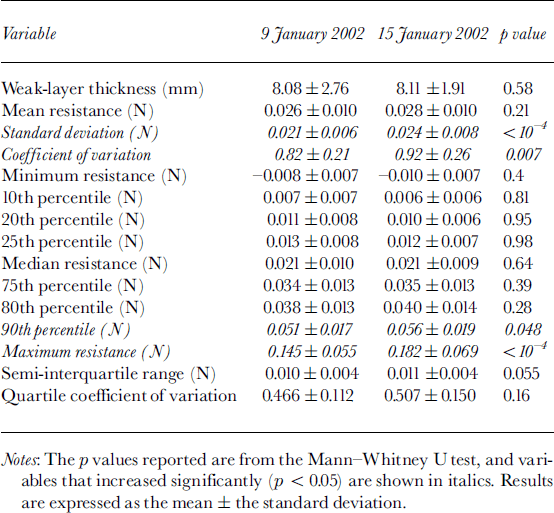
Another interesting finding is that there is no statistical difference in the mean or median of the SMP force signal within the weak layer between the two days and the two sampling areas (Table 2; Fig. 2). Further, all of the percentile measurements up to the 90th percentile do not significantly differ. The p values of the percentiles consistently decrease with increasing percentile (Table 2). A similar minimum value is expected since much of the SMP signal on both days through the weak layer is within either extremely weak snow or pore space (Fig. 1b and c). The small negative values observed for the minimum force measurements are a result of the offset of the SMP, which is calculated as the mean of the SMP signal in the air, thereby leading to some small negative values in the air, or in the voids of our surface-hoar layer. Though similar minimum measurements for the two days make sense, in a strengthening weak layer we might anticipate an increase in the mean or median of the force signal. There must be more important measures that quantify changes in the strength of buried surface-hoar layers.
The values that do statistically differ (p<0.05) between the first and second day are the variance, coefficient of variation and 90th percentile measurement of the SMP signal, and maximum penetration resistance within the weak layer (Table 2; Fig. 2). All of these parameters increase between the two days. Not surprisingly, the variance and maximum signal are highly correlated on both days (Spear-man r 40.83), indicating that our high variance measures are occurring at locations with a high maximum. Our results suggest that a key value of the SMP force signal with-in a buried surface-hoar layer may be the maximum penetration resistance, or perhaps the variance of the signal. Since there are relatively few bonds between a surface-hoar layer and the adjacent layers, perhaps only one or a couple of these bonds are ruptured as the small SMP tip passes through the layer. We hypothesize that the breaking of the most significant bond encountered by the SMP tipmay give the maximum signal, while smaller signal spikes may be due to other bonds being broken or crystals getting pushed aside (Fig. 1c). Thus, the maximum signal may give us the best indication of how the bonds and the layer are strengthening. Subsequently, we tried to discern the part of the weak layer (upper, middle or lower) most commonly associated with the maximum signal, but our analyses indicated that the maximum SMP signal could occur at any level. We believe this is because the small tip can interact with the widely spaced surface-hoar crystals in any part of the layer.
We compared the statistics for our manually delineated layers with the statistics for the layer plus 5% of the layer thickness on each side and minus 5% of the layer on each side. For both days, and for all our statistical measures, we found no statistically significant differences (all p>0.20 and most p>0.50) between our manually delineated layer and either the thicker or thinner layer. This demonstrates that our manual delineation technique is reasonably robust for these data; small differences in how the layer boundaries are delineated do not affect our results.
Summary
The shear strength index associated with a buried surface-hoar layer increased between 9 and 15 January 2002 at our two sites (Table 1; Fig. 2), and our SMP measurements also show changes in the SMP signal. Perhaps somewhat surprisingly, layer thickness, as well as the mean, median, minimum and most percentile measurements of the penetration resistance within the weak layer, did not change significantly (Table 2; Fig. 2). However, the variance, coefficient of variation, 90th percentile and the maximum signal all increased between the two days and sites (Table 2; Fig. 2). Though we cannot provide a direct link between QLCT results and SMP measurements, our results suggest that the maximum penetration resistance might be important for predicting changes in shear strength. This may be because the SMP is breaking relatively few bonds within the weak layer, but those few bonds that it does break have become stronger.
The data for this research came from two parts of the same slope located about 45 m apart. Thus, we cannot be sure whether the changes we measured are temporal or spatial, or a combination of both. This is always a problem with field studies of snow, a highly spatially variable material which is also typically destroyed at a specific location during the sampling process. In our case, neither of the two parts of the slope we tested displayed linear spatial trends in any of our primary variables such as weak-layer thickness, mean penetration resistance or maximum penetration resistance. The lack of such trends on two closely related parts of the same slope suggests relatively uniform conditions across the slope. Though not absolutely conclusive, this provides evidence that the trends we observed were primarily temporal changes rather than spatial changes.
Our results have implications for how we view weak layers and bond strength. To interpret the SMP signal, we cannot simply think of a weak layer as being homogeneous; instead, we need to visualize a more complex weak layer with a corresponding distribution of bond strengths. Our data show that the center of the distribution of the penetration resistance measurements within our surface-hoar layer (as measured by the mean and median) did not change between the two days. However, our maximum signal increased, demonstrating that the strongest bonds in the layer have become stronger between the two sampling days at our two sites.
Clearly, our work is only a first step toward quantifying the changes in the SMP signal within a strengthening weak layer. Further research is needed to more definitively correlate changes in the SMP signal within buried surface-hoar layers, and other weak layers, to changing shear strength, stability and avalanche conditions on specific slopes.
Acknowledgements
We are grateful to C. Landry, who helped coordinate field days, provided field data and engaged in useful discussions about this work. Montana State University TechLink funded the purchase of the SMP. Special thanks go to B. Brown, D. Chabot, J. Deems, R. Johnson, D. Miller and M. Cooperstein for their great help in the field. B. Jamieson (editor) and two anonymous reviewers provided constructive criticism that greatly improved this paper. This work was supported in part by the U. S. National Science Foundation (BCS-0240310) and the Swiss National Science Foundation (2000-066643.01).



