


Introduction
Red deer (Cervus elaphus L.) are seen as the ‘principal grazing animal in the Scottish Highlands’ (Fryday Reference Fryday2001) and numbers have more than doubled since the 1960s, according to figures cited in Clutton-Brock et al. (Reference Clutton-Brock, Coulson and Milner2004). Exclosure is considered necessary for woodland regeneration in areas where there is a high deer density (Warren Reference Warren2009). This investigation examined how an absence of red deer from exclosed areas of wet heath vegetation, at three estates in Wester Ross, affects bryophyte and lichen communities associated with siliceous rock outcrops and boulders, at altitudes below the tree-line. The results of this study will be relevant to other sites in the Highlands. This is important considering that non-maritime rocks, at altitudes below 400 m, are the habitat for 12% of the lichens on the Red List (Church et al. Reference Church, Coppins, Gilbert, James and Stewart1996). More species of lichen occur on siliceous rock than on any other substratum in the British Isles (Gilbert Reference Gilbert2000; Porley & Hodgetts Reference Porley and Hodgetts2005).
Vascular plants and bryophytes threaten to engulf and shade-out lichen communities on small rock outcrops and boulders if grazing is reduced (Fletcher Reference Fletcher, Fletcher, Wolseley and Woods2001; Orange Reference Orange2009). Fryday (Reference Fryday1996) described how tall-herb communities out-competed lichen vegetation at low to moderate altitudes in Snowdonia causing an impoverishment of lichen diversity. Further anecdotal evidence in support of this threat was reported from Inchnadamph, where calcifuge vegetation had grown over limestone boulders and outcrops inside exclosures (Fryday Reference Fryday2001). Coppins (Reference Coppins2003) reported rocks that had been overgrown by ivy within an exclosure at Rassal Ashwood National Nature Reserve and Orange (Reference Orange2009) noted similar effects where grazing animals had been excluded from woodlands in North Wales. A taller canopy is also thought to inhibit those lichens that must dry rapidly after episodes of wetting (Fletcher Reference Fletcher, Fletcher, Wolseley and Woods2001). Burial of saxicolous lichen communities beneath leaf-litter from scrub development, in the absence of grazing, is also discussed by Fletcher (Reference Fletcher, Fletcher, Wolseley and Woods2001) along with other potential threats.
Saxicolous cryptogam communities are considered less affected by grazing animals compared to terricolous bryophytes and lichens (Orange Reference Orange2009). However, intensive animal husbandry poses a threat to saxicolous lichens from the raised nutrient levels associated with herbivore dung and urine, particularly from the large quantities produced by cattle and horses (Fletcher Reference Fletcher, Fletcher, Wolseley and Woods2001). Only those lichens which can tolerate or are favoured by the enhanced nutrient status of the rock are able to persist. There is also anecdotal evidence for direct predation of lichens from rocks by large herbivores (Gilbert Reference Gilbert2000; Fryday Reference Fryday2001).
The impact of red deer exclusion on saxicolous cryptogam communities below the tree line has not previously been quantified. The existence of exclosures of a range of ages at the Gruinard, Letterewe and Little Gruinard estates provided an opportunity to tackle this very question. Fryday (Reference Fryday2001) found fewer crustose lichens on small rocks and pebbles within higher altitude exclosures across Great Britain compared to adjacent habitat that was grazed. However, the impact of sheep grazing was not separated from red deer activity in this study and the experimental design gave no information about the variation in the data due to locational effects, for example.
The removal of vegetation is one of the main impacts of a high density of grazing animals (Thompson et al. Reference Thompson, Galbraith, Horsfield, Bell and Bunce1987). This reduces the light competition imposed by vascular plants and prevents the accumulation of leaf-litter that might otherwise smother smaller photosynthetic organisms (Rydin Reference Rydin, Goffinet and Shaw2009). Disturbance to the habitat caused by large herbivores also results in small-scale gaps that are suitable for cryptogam colonization (Rydin Reference Rydin, Goffinet and Shaw2009) and keeps the habitat open. In the absence of red deer, humidity is likely to increase below a developing scrub canopy which will favour the growth of large bryophytes. Therefore, we hypothesized that lichen diversity and cover would be reduced inside the deer exclosures at Letterewe and neighbouring estates. Orange (Reference Orange2009) postulated a similar hypothesis concerning the absence of grazing in general.
Methods
Site description
Gruinard, Letterewe and Little Gruinard are privately owned estates in north-west Scotland. They are managed for deer stalking and fishing interests but they also have a commitment to encourage woodland regeneration. It was advantageous to study the impact of red deer management on saxicolous lichen communities at these estates since there has been no sheep grazing (during the existence of the exclosures) that might otherwise confound the results. According to the keepers at the Letterewe and Gruinard estates, average red deer density is currently estimated at 9 km–2. Previously, Milner et al. (Reference Milner, Alexander and Griffin2002) estimated an average of 14·5 red deer km–2 in the study area.
There is no difference in the mean annual temperature range at each site (Table 1) owing to the relatively short geographical distances between the exclosures (Fig. 1). However, Little Gruinard differs from the other sites by having fewer wet days (those in receipt of >1 mm of rain per year). This will influence net photosynthesis and growth in lichens which is depressed when they are suprasaturated (Lange et al. Reference Lange, Green and Heber2001). There is variation in the nitrogen loading at each exclosure (Table 1) but all are below the critical threshold of 10 kg N ha–1 yr–1 for northern wet heath (Bobbink et al. Reference Bobbink, Braun, Nordin, Power, Schütz, Strengbom, Weitjers and Tomassen2011). Mitchell et al. (Reference Mitchell, Truscot, Leith, Cape, Van Duk, Tang, Fowler and Sutton2005) also reported a low loading of nitrogen pollution for the Loch Maree area. Nonetheless, nitrogen loading has generally increased in the Northern Hemisphere since the mid-19th century as a result of fossil fuel driven industry, intensive agriculture and biomass burning (Karlsson et al. Reference Karlsson, Ferm, Tømmervik, Hole, Pihl Karlsson, Ruoho-Airola, Aas, Hellsten, Akselsson and Nørgaard Mikkelsen2013). Caution is advised regarding the nitrogen deposition data since it has a low resolution (5 km) and comes with large uncertainties (Air Pollution Information System 2013). Other site details are given in Table 1.
Site details for each exclosure within the study area. Information concerning the geology at each exclosure was derived from a map produced by the British Geological Survey (1962). Thirty-year average climatic data came from the Meteorological Office (2013) and three-year average nitrogen deposition data were sourced from the Air Pollution Information System (2013)

Map showing location of the exclosures (drawn to approximate scale) in the study area, Wester Ross, Scotland.

The exclosures at all three estates were placed within vegetation primarily of the M15 Trichophorum cespitosum-Erica tetralix wet heath community (according to the National Vegetation Classification, Rodwell Reference Rodwell1991). Proximity to extant woodland varied between locations and this will have influenced speed of regeneration.
All the rocks studied were of a hard, siliceous nature and resistant to weathering, but there were differences in their origin and composition (Table 1). The Parmelietum omphalodis DR. association of the Umbilicarion cylindricae (Frey) Frey alliance (James et al. Reference James, Hawksworth, Rose and Seaward1977) best describes the main lichen community of the upper surfaces of siliceous rocks within the study area. There is an abundance of Parmelia omphalodes (L.) Ach. on many boulders, along with other lichens characteristic of this association such as, for example, Ochrolechia androgyna (Hoffm.) Arnold, O. tartarea (L.) A. Massal., Ophioparma ventosum (L.) Norman, Parmelia saxatilis (L.) Ach., Pertusaria corallina (L.) Arnold and Sphaerophorous globosus (Huds.) Vain. Bryophytes are also prominent with Hypnum andoi A. J. E. Sm. and species of Racomitrium Brid. the most frequent. Orange (Reference Orange2009) refers to this association as the SS F2 Parmelia saxatilis–Parmelia omphalodes community.
On well-drained but more rain-exposed surfaces of rocks in the study area, the Umbilicarietum cylindricae association (James et al. Reference James, Hawksworth, Rose and Seaward1977) was common. Within this association, the SS A1 Rhizocarpon geographicum (L.) DC–Fuscidea lygaea (Ach.) V. Wirth & Vĕzda, SS B3 Fuscidea lygaea–Porpidia tuberculosa (Sm.) Hertel & Knoph, in Hertel and SS F1 Rhizocarpon geographicum–Umbilicaria cylindrica (L.) Delise ex Duby communities (Orange Reference Orange2009) were recognized. On vertical surfaces of rocks, with a slightly higher base status, the SS C1 Pertusaria corallina–Pertusaria pseudocorallina (Lilj.) Arnold community (Orange Reference Orange2009) was encountered. This community is synonymous with the Pertusarietum corallinae Frey p.p. (James et al. Reference James, Hawksworth, Rose and Seaward1977). There were also occasional stands of the species-poor SS D4 Lecidea lithophila (Ach.) Ach. community (Orange Reference Orange2009) on recently exposed siliceous rock. In more sheltered or wetter situations, rocks were covered with Racomitrium lanuginosum (Hedw.) Brid. Wet heath vegetation was also colonizing from the slope on several rocks in the study area.
Procedure
Fieldwork was carried out in 2011 and 2012. All suitable exclosures with comparable rocky slopes and an aspect facing south-west (to maximize the number of exclosures available to study) were selected. Potential blocks were identified following a site visit and then selected at random. A block consisted of two plots (one either side of the deer fence) and each contained five suitable rocks selected at random. A 0·2×0·2 m quadrat was placed centrally on the south-west, topmost and north-east facet of each rock, since we were interested in seeing whether lichen communities associated with these facets responded differently to the absence of red deer. Time constraints limited us to the three facets with greatest contrast. Data were collected from 22 blocks in total, corresponding to 220 rocks and 660 quadrats, which was just in excess of the recommended sample number based on a power analysis for an effect size of 50% (using data from a pilot study).
Rocks were deemed suitable if they were between 0·2 and 1·1 m in height (easily accessible to red deer) and over 0·2 m in width and breadth. Lichen communities on rocks are influenced by abiotic factors associated with the substratum such as texture, hardness, aspect and especially the chemical composition (Gilbert Reference Gilbert2000). Therefore, the rocks had to be of the same geology either side of the exclosure at each block, on a slope of similar altitude, aspect (facing south-west), gradient, and situated in wet heath vegetation prior to the erection of the exclosure. By attempting to control for these possible confounding factors, it was hoped that the presence/absence of red deer would become the main effect operating on the saxicolous cryptogam communities at each block. Other obvious abiotic factors which could not be controlled, such as micro-gradient, were measured in some way (see below).
An acetate overlay with 100 circles of 20 mm diameter, as described for estimating epiphytes at Loch Sunart (Bates Reference Bates1992), was used to estimate the percentage cover of each bryophyte and lichen species within quadrats. Many taxa were identified in the field but small subsamples were collected where a microscope was necessary for their determination and a few of these required a referee. It was impossible to identify certain crustose lichens that were sterile, mollusc-grazed or otherwise in poor condition. These were recorded as unknowns on the data sheet and distinguished if there were more than one in a quadrat. Non-cryptogam vegetation was also recorded from each quadrat, providing it grew from the facet (if overgrowing the facet then the foliage was lifted up to facilitate recording of the rock surface).
Micro-gradient for each facet was scored on a scale of 1 (horizontal) to 5 (vertical) with 3 representing a 45° angle. Roughness of the rock was scored on a scale of 1 (smooth) to 3 (very rough) and 2 (intermediate). Litter cover in each quadrat was also scored on a scale of 1 (0%), 2 (≤25%) and 3 (>25%) devised by Weibull & Rydin (Reference Weibull and Rydin2005). Approximate size of each rock was calculated from the combined area of all visible facets. Mean height of the rock above soil surface was determined using a tape measure. At a randomly selected distance (≤1 m) from each rock, vegetation height was measured at 0·1 m intervals using a metre rule, along a 1 m length of tape laid perpendicular to a compass bearing chosen at random. Thus, mean vegetation height was obtained quickly from 10 measurements in the close vicinity of each rock.
Analysis
The percentage cover data from the 0·04 m2 quadrats were arcsine transformed before analysis. Bryophyte and lichen diversity within each quadrat was determined using the Shannon index as a measure for evenness of species cover. Dominance is a measure that focuses on identity and was calculated by dividing the cover of the most abundant species within a quadrat by the total cover of all species within the same taxonomic group (i.e. bryophyte or lichen) in that quadrat. These data were analyzed using a linear mixed effects model (LMER) that was fitted in R version 2.11.1 (R Development Core Team 2010), to test the null hypothesis that an absence of red deer has had no impact on bryophyte and lichen species cover, diversity and dominance within quadrats on a specific facet of rocks, inside the exclosures within the study area. The fixed effect in this model was the presence or absence of red deer either side of the exclosure and the random effects represented the hierarchical sample design (quadrats on a particular facet of rock within plots of 5 rocks within blocks of 10 rocks within exclosure locations). In this way, differences caused by the fixed effect in each model should not be influenced by a disparity in the nitrogen loading at each location, for example. If locational differences were important then this would be manifest in the random effects. Variance components analysis (VCA) of the random effects revealed where most of the unexplained variation in the data was generated (after the fixed effect had been removed) and is expressed as a percentage (Crawley Reference Crawley2013). Mean vegetation height by each rock and non-cryptogam vegetation cover within quadrats were analyzed in a similar way. A generalized LMER (with a Poisson error structure specified to take account of the non-constant variance associated with count data) was used to analyze bryophyte and lichen species richness within quadrats.
Model simplification in ANCOVA was conducted for total lichen cover and lichen diversity to establish which of the measured explanatory variables were most important. The explanatory variables considered for inclusion in the maximum models included the categorical variables: treatment, aspect, micro-gradient, litter cover and roughness, and the continuous variables: mean vegetation height, non-cryptogam vegetation cover, total bryophyte cover, age of exclosure, rock height and approximate rock area. Tree models were generated to gain an initial idea of the importance of the main effects and scatter graphs and box plots assisted with the initial parameterization of the maximum models. The maximum model was constructed according to the guidelines in Crawley (Reference Crawley2013) to avoid the problems associated with over-parameterization. Successive models were compared using ANOVA to justify removal or retention of variables. In order to account for the random effects and the pseudoreplication inherent with the sampling design, each minimum adequate model (MAM) was fitted to an LMER. The goodness of fit for each MAM was assessed by plotting the residuals against the fitted values (to check for heteroscedasticity) and looking for normality in the normal error plots. This was important for determining how well our data were described by each model.
Results
Vegetation height
The mean height of vegetation inside the exclosures was significantly higher (t= 8·688) at 0·53 m compared to 0·33 m in the grazed treatment (standard error of the difference between means was 0·02 m). The fixed effect in this model accounted for 32·5% of the variation in the data. Variance components analysis (VCA) of the remaining unexplained variation showed that most of this (32·7%) occurred at the level of the individual measurement. The greatest difference in vegetation height either side of the exclosures was at Strathnasheallag (Table 2).
Mean vegetation height (+SE) within and outside the exclosure at each location in the study area

Non-cryptogam vegetation cover
Calluna vulgaris (L.) Hull and Molinia caerulea (L.) Moench were the most common species comprising the non-cryptogam vegetation cover in quadrats on the rocks (see , available online). There was no significant difference in mean non-cryptogam vegetation cover between the exclosed and grazed treatment for quadrats placed on the south-west aspect of rocks. For those quadrats placed on the top facet of rocks, there was a significantly greater mean arcsine non-cryptogam vegetation cover (t=4·002) within the exclosed treatment (0·354 radians or 12·0%) compared to the grazed treatment (0·180 radians or 3·2%). The standard error of the difference between means was 0·044 radians. Presence or absence of red deer accounted for 22·3% of the variance in this model. Mean arcsine non-cryptogam vegetation cover (radians) was also significantly greater (t=2·708) in quadrats from the north-east aspect of rocks within the exclosures at 0·379 (13·7% cover) compared to those outside at 0·238 (5·5% cover). The standard error of the difference between means was 0·051 radians. Red deer presence or absence explained 37·8% of the variation in the data in this model. Two thirds of the remaining unexplained variance in the non-cryptogam vegetation cover data was at the level of the quadrat for the topmost facet and the other third was between locations. Variance components analysis on the non-cryptogam vegetation cover data for the north-east aspect of rocks showed that 44·5% of the variation occurred at the level of the quadrat, and 55% was between locations. The north-east aspect of rocks was more prone to being overgrown and shaded by vegetation since it faced into the slope. Hence, the high variability at the level of location is likely a function of exclosure age rather than location.
Cryptogam cover
Of the 155 named cryptogam taxa from the 660 quadrats (see , available online), 13 species were shown to have significant differences in abundance between the two levels of treatment for at least one of the aspects of rock under question. Only Rhizocarpon geographicum was significantly affected by exclosure in quadrats on the south-west aspect of the rocks (t=2·082) with mean arcsine cover (radians) of 0·177 (3·1% cover) in the grazed treatment compared to 0·138 (1·8% cover) in the exclosed treatment (standard error of the difference between means was ±0·019). Of the unexplained variance in this instance, 66·0% was at the level of the quadrat, 18·4% was between different locations and 15·6% was between different blocks. There was minimal unexplained variation between plots.
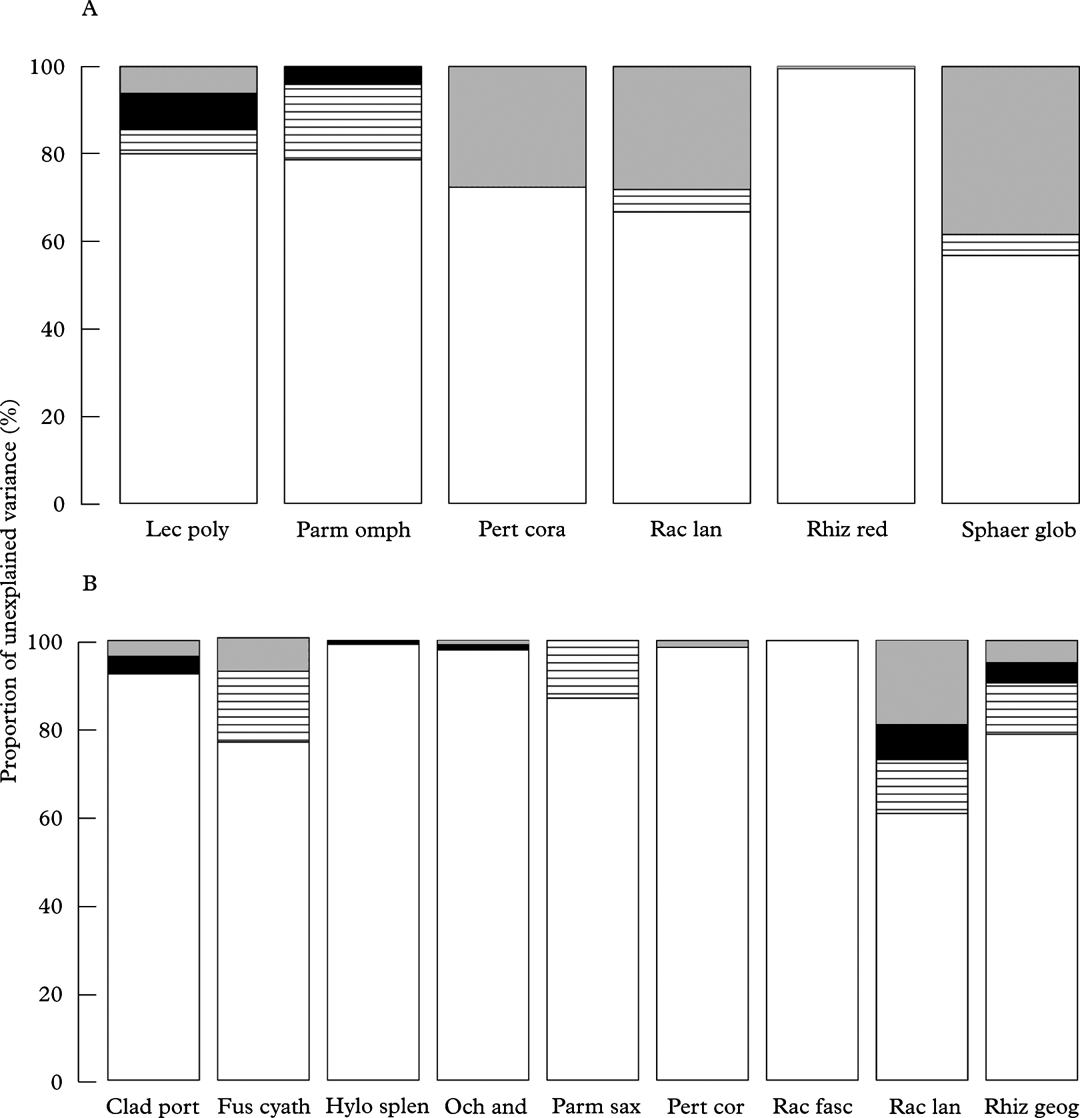
Mean arcsine cover of Fuscidea cyathoides (Ach.) V. Wirth & Vĕzda, Lecanora polytropa (Hoffm.) Rabenh., Ochrolechia androgyna, Parmelia omphalodes, P. saxatilis, Racomitrium fasciculare (Hedw.) Brid., Rhizocarpon geographicum, R. reductum Th. Fr. and Sphaerophorus globosus was significantly reduced in quadrats within the exclosed treatment on the topmost and/or north-east aspect of rocks (Table 3). Cladonia portentosa (Dufour) Coem., together with the mosses Hylocomium splendens (Hedw.) Schimp. and Racomitrium lanuginosum, was significantly more abundant in quadrats within exclosures on at least one of these facets. The greatest amount of variability in these data occurred at the level of the individual quadrat, although location was another important random effect (Fig. 2). Porpidia tuberculosa and Stereocaulon vesuvianum Pers. were present in significantly greater cover on the south-west aspect (t=4·918 and 2·489, respectively) compared to the other facets but neither species, together with the moss Hypnum andoi, showed a significant difference in cover between the exclosed and grazed treatment for any of the aspects.
Mean arcsine cover values of selected bryophyte and lichen species between exclosed and grazed levels of red deer treatment following analysis of data from 220 0·04 m2 quadrats on A, the topmost facet, and B, north-east aspect of rocks in a linear mixed effects model. Numbers in brackets correspond to the raw cover data. Significant t values are in bold type

* standard error for the difference between means.
Variance components analysis showing the percentage unexplained variance, attributable to each of the random effects, following LMER analysis of cryptogam species cover data from quadrats; A, topmost facet of rocks; the fixed effect (deer presence/absence) in the model had already accounted for 44·1% (Lecanora polytropa), 41·2% (Parmelia omphalodes), 24·7% (Pertusaria corallina), 23·8% (Racomitrium lanuginosum), 67·3% (Rhizocarpon reductum) and 50·3% (Sphaerophorus globosus) of the variation (species names are abbreviated from those listed in Table 3A); B, the north-east aspect of rocks, the fixed effect (deer presence/absence) in the model had already accounted for 49·6% (Cladonia portentosa), 50·1% (Fuscidea cyathoides), 58·8% (Hylocomium splendens), 62·6% (Ochrolechia androgyna), 70·7% (Parmelia saxatilis), 62·0% (Pertusaria corallina), 70·7% (Racomitrium fasciculare), 33·6% (Racomitrium lanuginosum) and 50·8% (Rhizocarpon geographicum) of the variation (species names are abbreviated from those listed in Table 3B).  , location,
 , block,
 , plot,
 , quadrat.
Total bryophyte cover was significantly higher in quadrats within exclosures for all three facets of the rocks in this study, but cover on the south-west aspect of rocks was only a third of that from the other aspects (Table 4). Total lichen cover was significantly greater on the topmost and north-east aspects of rock outside the exclosures (Table 4B & C).
Differences in cryptogam arcsine cover, diversity and dominance values between exclosed and grazed levels of red deer treatment following analysis of data from 220 0·04 m2 in a linear mixed effects model. A, quadrats on the south-west aspect, B, top-most facet, and C, north-east aspect of rocks. Numbers in brackets correspond to the raw cover data. Significant t values are in bold type

* standard errors for the difference between means
Measures of bryophyte and lichen diversity
The output from the LMER analysis for cryptogam diversity, dominance and species richness, and separately for the diversity, dominance and species richness of bryophytes and lichens, for each aspect, is shown in Table 4. Lichen diversity was significantly higher in the grazed treatment for all three aspects of the rocks that were sampled. Cryptogam diversity as a whole was significantly higher outside of exclosures for the topmost and north-east aspects of rocks. Cryptogam diversity was nullified by a significantly higher bryophyte diversity countering significantly reduced lichen diversity on the south-west aspect of rocks within the exclosed treatment. It was only on the north-east aspect of rocks that measures of mean bryophyte and cryptogam dominance were significantly greater within exclosures. This was manifest in the field by a greater cover of Racomitrium lanuginosum on rocks within the exclosures.
Mean lichen species richness within quadrats was significantly higher in the grazed treatment on all three aspects of the rocks and this resulted in a similar pattern for mean cryptogam species richness as a whole. Presence or absence of red deer accounted for 40·8% (south-west facet), 47·3% (topmost facet) and 61·0% (north-east facet) of the variance for each lichen species richness model in turn. Differences between quadrats accounted for the greatest amount of unexplained variance in the diversity and dominance data (Figs 3 & 4), and also for the species richness data from the north-east and top facets. This reflects the sensitivity of bryophytes and lichens to differences in their microhabitat. However, differences between locations accounted for 59·4% (cryptogam species richness) and 44·0% (lichen species richness) of the unexplained variance for the south-west aspect of rocks.
Variance components analysis showing the percentage unexplained variance, attributable to each of the random effects, following LMER analysis of selected response variable data from quadrats on the south-west aspect of rocks. The fixed effect (deer presence/absence) in the model had already accounted for 33·1% (total bryophyte cover), 58·0% (bryophyte diversity) and 37·2% (lichen diversity) of the variation. , location, , block, , plot, , quadrat.

Variance components analysis showing the percentage unexplained variance, attributable to each of the random effects, following LMER analysis of selected response variable data from quadrats; A, topmost facet of rocks, the fixed effect (deer presence/absence) in the model had already accounted for 39·1% (cryptogam diversity), 30·3% (total bryophyte cover), 31·6% (total lichen cover) and 37·2% (lichen diversity) of the variation; B, on the north-east aspect of rocks, the fixed effect (deer presence/absence) in the model had already accounted for 52·7% (cryptogam diversity), 53·2% (cryptogam dominance), 38·6% (total bryophyte cover), 53·6% (bryophyte dominance), 47·9% (total lichen cover) and 47·9% (lichen diversity) of the variation. , location, , block, , plot, , quadrat.

Explanatory variables influencing total lichen cover
The MAM for total lichen cover accounted for 70·5% of the variation in the data (Table 5). The model suggests there was a significant negative relationship with bryophyte cover (P<0·001) and non-cryptogam vegetation cover (P<0·001) (Fig. 5), as well as mean vegetation height (P<0·001). At litter levels exceeding 25% cover, there was significantly lower lichen cover (P<0·001). The lichen cover on the different aspects was influenced by significant interaction terms (P<0·05) with bryophyte cover (negative) and mean vegetation height (positive). Mean vegetation height had little effect on lichen cover in quadrats on the south-west aspect of rocks but there was a negative relationship between these two variables in quadrats from the other facets of the rock. Positive interaction terms also existed for bryophyte cover and litter cover, bryophyte cover and mean vegetation height, and vegetation cover and mean vegetation height. An increase in bryophyte cover had no effect on lichen cover at litter levels >25%, which contrasts with the negative relationship observed in quadrats with low quantities of leaf litter. Increasing bryophyte cover had a slightly reduced negative impact on lichen cover where mean vegetation height was greater. Lichen cover was little affected by increasing mean vegetation height in quadrats with a high vegetation cover. At low cover of non-cryptogam vegetation within quadrats, lichen cover was reduced by increasing mean vegetation height by each rock. The other variables were not significantly contributing to the amount of variance explained. Goodness of fit was poor for this model, with a great deal of heteroscedasticity indicating a non-constant variance and curvature in the normal errors. Transformation of the variables, where possible, did not result in any improvement. However, the high significance of the main effects and the straightforward interpretation of the MAM minimize cause for concern. Variance components analysis showed that 93·7% of the unexplained variance in this model was between individual quadrats.
The minimum adequate model for total lichen cover fitted to a linear mixed effects model using data from 660 0·04 m2 quadrats on rocks from 22 pairs of plots (blocks) and 6 exclosures. Selected variables shown. Significant t values are in bold type

Relationship between total lichen cover within quadrats and A, bryophyte cover, B, total non-cryptogam vegetation cover.

Explanatory variables influencing lichen diversity
The MAM for lichen diversity accounted for 49·5% of the variation in the data (Table 6). The model suggests there was a significant negative relationship between lichen diversity and non-cryptogam vegetation cover within quadrats (P<0·001) and also duration of exclosure (P<0·001). The topmost facet of rocks was shown to have a significantly lower lichen diversity (P<0·001) compared to the other aspects. The model also implies an unexpected positive relationship between lichen diversity and mean vegetation height (P<0·01). Bryophyte cover was in a weak positive relationship with lichen diversity to begin with [due to its role in providing habitat for species such as Cladonia P. Browne spp. and Micarea lignaria (Ach.) Hedl.], but the significant negative quadratic function for this explanatory term (P<0·001) suggested that saxicolous habitat within quadrats became scarce once bryophyte cover exceeded an optimum, resulting in reduced lichen diversity. Figure 6 illustrates these relationships. There was also a significantly lower lichen diversity at litter levels >25% cover (P<0·001).
The minimum adequate model for lichen diversity fitted to a linear mixed effects model using data from 660 0·04 m2 quadrats on rocks from 22 blocks and 6 exclosures. Selected variables shown. Significant t values are in bold type

Relationships between lichen diversity and total bryophyte cover (A), total vegetation cover (B), age of exclosure (C) and mean height of vegetation close to rock (D). A, B & D: ▵, quadrats inside the exclosure; • quadrats outside exclosure. C: +, quadrats on the south-west facet; ▵, quadrats from the north-east facet; •, quadrats from the topmost facet. (See Table 6 for more details).

Significant interaction terms remained in the MAM for lichen diversity between bryophyte cover and the amount of litter in each quadrat (P<0·001), bryophyte cover and aspect (P<0·001), aspect and duration of exclosure (P<0·05), and between aspect and treatment (P<0·01). At litter cover <25%, lichen diversity was reduced by increasing bryophyte cover, but at higher amounts of litter within a quadrat there appeared to be an increase in lichen diversity with greater cover of bryophytes. An optimum bryophyte cover for lichen diversity was apparent in the data for the north-east and top facets of rocks, but there was a negative relationship between these two variables on the south-west aspect. Lichen diversity generally decreased with age of exclosure but was higher than expected within quadrats from the oldest exclosure for the south-west and top facets of rocks. Mean diversity was also unexpectedly higher within quadrats from the north-east aspect of rocks inside the Little Gruinard exclosure (erected in 2000) compared to the general trend. This might be due to the relatively low mean height of vegetation around each rock compared to other exclosures. The grazing treatment had a positive effect on lichen diversity associated with the topmost facet. There was also a significant interaction between roughness of the rock and micro-gradient (P< 0·05), with lichen diversity higher on the steepest rock faces of intermediate roughness. There was good linearity in the normal errors but serious heteroscedasticity in the variance plot indicated a poor goodness of fit for this model. The high significance of the main effects again outweighs any cause for concern in this regard. Variance components analysis showed that 93·4% of the unexplained variance occurred at the level of individual quadrats.
Discussion
This investigation has shown that a complete absence of red deer, within exclosures established to encourage woodland regeneration, is detrimental to the species richness, diversity and cover of lichens on rocks in a matrix of wet heath vegetation. The data support observational and anecdotal evidence from other sites in Scotland (Fryday Reference Fryday2001; Coppins Reference Coppins2003; Orange Reference Orange2009) concerning the threat of reduced grazing, from both sheep and deer, on lichen communities associated with small rock outcrops and boulders. The increase in shading and litter accumulation from the surrounding vegetation, and the subsequent growth of bryophytes and wet heath vegetation on rocks within the exclosures, was particularly damaging to saxicolous lichen species. This is consistent with the prediction of Orange (Reference Orange2009). Outside of the exclosures, red deer have prevented succession and maintained an open habitat more conducive to lichens associated with siliceous rock.
There was no evidence of a detrimental effect on saxicolous lichen communities (such as the occurrence of species associated with a raised nutrient status on rocks) caused by red deer at an estimated density of 9 km–2 compared with an absence of red deer. Sphaerophorus globosus and Parmelia omphalodes are prone to grazing by reindeer (Gilbert Reference Gilbert2000), and sheep in the case of the former (Fryday Reference Fryday2001), but in this investigation they were found to be significantly more abundant on the tops of rocks outside the exclosures. Succession within exclosures would appear to be more detrimental to their survival than any browsing by red deer in the grazed treatment of this study.
The significant interaction terms in the model for total lichen cover are merely a reflection of their immediacy. Non-cryptogam vegetation cover within a quadrat was a more serious threat to lichen cover than the height of vegetation around the rock. When the former was sparse only then did mean height of vegetation near the rock impact on lichen cover. At litter levels high enough to be covering lichens within a quadrat, bryophyte cover became less important. Other interaction terms demonstrate the importance of aspect. The south-west aspect of rocks was more exposed to the elements and orientated away from the slope on which the matrix vegetation was growing. Therefore, it was more resistant to bryophyte and vegetation encroachment and generally stood above the vegetation downslope. Rock size was removed early on in the model simplification process but this may reflect the fact that the quadrat area was standardized. If a full inventory of species on each rock was recorded then there may have been a different outcome.
Discrepancies in the general trend of the data demonstrate how duration of exclosure is confounded to some extent by location. Natural variability must still account for some of the differences in observational studies such as that presented here, even when confounding factors have been reduced as far as possible (Pellerin et al. Reference Pellerin, Huot and Côté2006). Therefore, it is not impossible that site-related factors could be influencing the data more than the fixed effects in the model (Virtanen et al. Reference Virtanen, Edwards and Crawley2002). For example, Torridonian sandstone rocks were less favourable to the growth of bryophytes and higher plants than other rocks, and this may be the reason for higher than expected lichen diversity in quadrats from the topmost facet within the oldest exclosure at Strathnasheallag. This also accounts for the slight positive relationship between mean vegetation height and lichen diversity (Fig. 6). This problem would not have occurred if the experimental treatments could have been randomly assigned to homogeneous habitats from the beginning (Virtanen et al. Reference Virtanen, Edwards and Crawley2002), with exactly the same geology, nitrogen loading and climate. Nonetheless, power analysis ensured a suitable amount of replication, important for observational studies of this type to gain statistical power (Virtanen et al. Reference Virtanen, Edwards and Crawley2002). The LMER analysis accounted for differences in natural variation between each location, block, plot and quadrat. Despite the possible differences between locations described above, the greatest amount of unexplained variation in the data was generally between individual quadrats. Bryophyte and lichen communities can be very sensitive to changes in their microhabitat and although abiotic factors such as micro-gradient, aspect and roughness were recorded, other variables such as metal content of the rock, for example, went unmeasured, which may have accounted for some of this variation.
This study was not able to provide a critical duration of exclosure before lichen diversity decreased, since this very much depends on the nature of each location. For example, Mast exclosure (erected in 2010) had undergone rapid regeneration because of the proximity to existing woodland and better-drained soils. Meanwhile, there was minimal tree establishment in the exclosures at Little Gruinard and Lochan Beannach Mor (erected in 2000 and 1997 respectively). Consequently, lichen diversity would be expected to decline more quickly in the exclosure erected at Mast than in those erected away from woodland in more waterlogged conditions. This investigation can only report on the absence or presence of red deer at a density of 9 km–2. Densities of 2–6 red deer km–2 have been recommended for the natural regeneration of Atlantic oak wood without the use of exclosures (Ratcliffe & Staines Reference Ratcliffe and Staines2003). It is likely that saxicolous lichen communities below the tree line would be affected by the changing conditions brought about by these low densities of red deer. However, woodland regeneration would probably be patchy and occur over a much longer period of time compared to inside an exclosure.
Whilst no especially rare lichen communities associated with siliceous rocks were threatened by the exclosures within the study area, the data demonstrate the potential impact that exclosures can have elsewhere. Succession was no longer arrested in the absence of red deer inside the exclosures and subsequent modification of the environment has favoured the growth of bryophytes, and non-cryptogam vegetation cover on rocks, to the detriment of saxicolous lichen diversity. The authors wish to echo the warning expressed by Fryday (Reference Fryday2001) that a cessation of grazing (brought about by red deer exclosure) might have serious negative impacts in areas notable for their saxicolous lichen diversity.
We thank the owners of Letterewe Estate for their financial support and provision of accommodation. Bill Whyte and Graham Wilson kindly gave permission for fieldwork on the Gruinard and Little Gruinard estates, respectively. Brian Coppins is thanked for his help with identifying some of the more awkward lichen specimens. The logistical support given by the staff at Letterewe was appreciated. We are also grategul to the anonymous reviewers for their comments and suggestions on an earlier draft of this manuscript and to Taylor & Francis for permission to reproduce Fig. 1.
Supplementary Material
For supplementary material accompanying this paper visit http://dx.doi.org/10.1017/S0024282913000868



