Introduction
It has long been known that the number and type of photoreceptors in vertebrates can vary with retinal location. A typical example is the absence of S cones (containing an SWS1 opsin) from within ∼100 µm of the site of peak cone density in the human fovea in an otherwise trichromatic retina containing variable numbers of S, M, and L cones that give rise to variable spectral (color) sensitivity (Curcio et al., Reference Curcio, Allen, Sloan, Lerea, Hurley, Klock and Milam1991; Roorda & Williams, Reference Roorda and Williams1999; McKeefy et al., Reference McKeefy, Murray and Parry2007). Another species where intraretinal variation in cone photoreceptors leads to differential spectral sensitivity is the mouse. In this species, the majority of cones house two visual pigments, S (expressing an SWS1 opsin) and M (expressing an MWS/LWS opsin), and these are distributed along opposite dorso-ventral gradients wherein the S visual pigment dominates the ventral retina (Applebury et al., Reference Applebury, Antoch, Blaxter, Chun, Falk, Farhangfar, Kage, Krzystolik, Lyass and Robbins2000; Baden et al., Reference Baden, Schubert, Chang, Wei, Zaichuk, Wissinger and Euler2013). This variation in cone distributions underlies different spectral sensitivities, with higher sensitivity to ultraviolet (UV) and short wavelengths in the ventral retina (Calderone & Jacobs, Reference Calderone and Jacobs1995). In addition, by virtue of the stronger signal gain of the S cone and its preference for dark stimuli, the opsin gradient in this animal may primarily serve to improve achromatic contrasts in its surroundings (Baden et al., Reference Baden, Schubert, Chang, Wei, Zaichuk, Wissinger and Euler2013). Other examples where intraretinal variation in cones underlies different spectral sensitivities are found in two species of birds: pigeon and chicken (Wortel et al., Reference Wortel, Wubbels and Nuboer1984, Reference Wortel, Rugenbrink and Nuboer1987; Remy & Emmerton, Reference Remy and Emmerton1989). In these species, intraretinal variation in cone types was first assessed by quantifying the numbers of oil droplets, organelles that occur in the inner segments of cones and whose transparency varies with cone type (e.g., cones containing UV visual pigment are associated with colorless droplets). These studies showed enhanced UV sensitivity in retinal areas with greater numbers of colorless oil droplets.
Besides these four species (i.e., human, mouse, chicken, and pigeon), many other vertebrates also show morphological and/or spectral variation in photoreceptor types with retinal location (Calderone & Jacobs, Reference Calderone and Jacobs2003; Arrese et al., Reference Arrese, Oddy, Runham, Hart, Shand, Hunt and Beazley2005; Takechi & Kawamura, Reference Takechi and Kawamura2005; Lukáts et al., Reference Lukáts, Szabó, Röhlich, Vígh and Szél2005; Neitz et al., Reference Neitz, Balding, McMahon, Sjoberg and Neitz2006; Cheng & Novales Flamarique, Reference Cheng and Novales Flamarique2007; Chen et al., Reference Chen, Znoiko, DeGrip, Crouch and Ma2008; Temple et al., Reference Temple, Hart, Marshall and Collin2010; Hárosi & Novales Flamarique, Reference Hárosi and Novales Flamarique2012; Novales Flamarique et al., Reference Novales Flamarique, Cheng, Bergstrom and Reimchen2013; Isayama et al., Reference Isayama, Chen, Kono, Fabre, Slavsky, DeGrip, Ma, Crouch and Makino2014). This variation may be further amplified because photoreceptors can contain multiple visual pigments (Lukáts et al., Reference Lukáts, Szabó, Röhlich, Vígh and Szél2005; Cheng & Novales Flamarique, Reference Cheng and Novales Flamarique2007; Isayama et al., Reference Isayama, Chen, Kono, Fabre, Slavsky, DeGrip, Ma, Crouch and Makino2014; Savelli et al., Reference Savelli, Novales Flamarique, Iwanicki and Taylor2018), and visual pigments may be modulated throughout life and, potentially, as a function of retinal location (Sakai et al., Reference Sakai, Ohtsuki, Kasagi, Kawamura and Kawata2016; Dalton et al., Reference Dalton, de Busserolles, Marshall and Carleton2017). The functional implications of such intraretinal variation are unknown. Most studies comprising measurements of an animal’s spectral sensitivity have not investigated its retinal variation or associated topographical differences in cone distributions. Instead, these studies have analyzed intra- or interspecies differences in overall spectral sensitivity (McDonald & Hawryshyn, Reference McDonald and Hawryshyn1995; Leal & Fleishman, Reference Leal and Fleishman2002; Sabbah et al., Reference Sabbah, Lamela Laria, Gray and Hawryshyn2010; Fleishman et al., Reference Fleishman, Loew and Whiting2011), modeled cone contributions to general spectral sensitivity functions (DeMarco & Powers, Reference DeMarco and Powers1991; Hughes et al., Reference Hughes, Saszik, Bilotta, DeMarco and Patterson1998; Risner et al., Reference Risner, Lemerise, Vukmanic and Moore2006; Sabbah et al., Reference Sabbah, Lamela Laria, Gray and Hawryshyn2010), or investigated the implications of changes in cone phenotype or cone loss on spectral sensitivity (Novales Flamarique, Reference Novales Flamarique2013, Reference Novales Flamarique2016; Novales Flamarique & Wachowiak, Reference Novales Flamarique and Wachowiak2015).
Besides the lack of information on intraretinal variation in spectral sensitivity and its underlying photoreceptor basis, the source of visual pigment variability, whether caused by differential opsin expression or chromophore type (retinal, vitamin A1, or 3,4-dehydroretinal, vitamin A2), is rarely demonstrated. At best, the preponderance of one chromophore type over another is inferred, indirectly, from semi-empirical models based on visual pigment absorbance parameters (Temple et al., Reference Temple, Hart, Marshall and Collin2010; Novales Flamarique, Reference Novales Flamarique2013; Novales Flamarique et al., Reference Novales Flamarique, Cheng, Bergstrom and Reimchen2013), that is, maximum wavelength of absorbance, λ max, or bandwidth at half maximum absorbance, HBW (Hárosi, Reference Hárosi1994). It is only in rare cases that direct measurements of chromophore type have been obtained (Kondrashev et al., Reference Kondrashev, Miyazaki, Lamash and Tsuchiya2013; Iwanicki et al., Reference Iwanicki, Novales Flamarique, Ausió, Morris and Taylor2017; Savelli et al., Reference Savelli, Novales Flamarique, Iwanicki and Taylor2018), despite the importance of this parameter in evaluating visual pigment absorbance.
In this study, we examined the spectral sensitivity in the dorsal retina of the northern anchovy to provide, along with previously published results from the ventral retina (Novales Flamarique, Reference Novales Flamarique2017), an assessment of intraretinal variability in the animal’s spectral sensitivity. We then explored whether the variability in spectral sensitivity could be explained by differential expression of opsin or chromophore types. A previous study has shown that the ventral retina of this species can be divided into two functional regions: a ventro-temporal (VT) area that contains axially dichroic cones with two M visual pigments whose λ max, at 514 and 516 nm are statistically the same, and a ventro-nasal (VN) region with cones that are not axially dichroic and house either M (λ max ∼ 518 nm) or L (λ max ∼ 556 nm) visual pigments (Novales Flamarique, Reference Novales Flamarique2017). Spectral sensitivity results suggested that the VN, but not the VT, retina mediates color vision. This was based on the presence of one peak (at 520 nm) in the spectral sensitivity function of the VT retina and two peaks (at 500 and 540 nm) in that of the VN retina. Behavioral experiments with free-swimming anchovies further showed that the animal can discriminate color and the polarization of light using the ventral retina (Novales Flamarique, Reference Novales Flamarique2017). Here, we hypothesized that any differences in spectral sensitivity between retinal sectors should reflect corresponding variations in opsin and/or chromophore types that make up the visual pigments.
Materials and methods
Animals
Adult northern anchovies (Engraulis mordax) were obtained from ocean net pens kept by Westport Seafood Ltd (Westport, WA) and transported to the University of Victoria Aquatic Facility (Victoria, BC, Canada) where they remained during the experimental period. Anchovies were kept in outdoor 5000-l recirculating saltwater tanks, fed frozen mysid, and experienced the natural daylight cycle throughout the study. The mean weight and total length (±s.d.) of the animals used were 22.8 ± 2.03 g and 15.7 ± 0.34 cm (n = 30). All experiments were approved by the Animal Care Committees of Simon Fraser University (protocol # 1126B-10) and the University of Victoria (protocol # 2013-005), which abide by regulations set by the Canadian Council for Animal Care.
Electrophysiology
The electrophysiological set-up to acquire optic nerve responses has been documented in detail before (Novales Flamarique & Wachowiak, Reference Novales Flamarique and Wachowiak2015; Novales Flamarique, Reference Novales Flamarique2017) and will only be summarized here. The optical system for stimulus delivery consisted of a 150W xenon light source coupled to a monochromator whose output traversed a neutral density wheel and shutter before entering one end of a bifurcated liquid light guide. The other end of the light guide received input from a halogen source (Fiber-lite MI-150, Dolan-Jenner Industries, Boxborough, MA) whose output traversed a combination of barrier and neutral density filters; this was the background channel. The outputs of both channels overlapped, converging onto the common end of the liquid light guide. The latter fitted into a holder with ball-joint base that permitted its positioning at any angle with respect to the center of the fish’s pupil. Experiments involved stimulation of the mid dorso-nasal (DN) and mid dorso-temporal (DT) retina by adjusting the angle of the fiber with respect to vertical and horizontal markers.
To generate a spectral sensitivity function, the fish was adapted to either a diffuse “white” (irradiance: 1.87 × 10¹⁴ photons cm−2/s, λ range: 300–750 nm) or long wavelength (LW) (irradiance: 1.78 × 10¹⁴ photons cm−2/s, λ range: 500–750 nm) light through the background channel of the bifurcated guide (Novales Flamarique, Reference Novales Flamarique2017). The fish adapted to this background for 1 h following which compound action potential recordings from the optic nerve were acquired to a 500-ms flash stimulus. For a given wavelength, the stimulus intensity was increased incrementally and the response at threshold plotted against log (stimulus intensity) and fitted with a third degree polynomial. The threshold value (20 µV) was chosen to lie in the lower linear part of the fit, characterized by a single major peak contribution to the optic nerve response. Sensitivity (i.e., the reciprocal of irradiance at threshold) was calculated for 14 wavelengths across the spectrum 360–650 nm to generate a spectral sensitivity function. All light measurements were obtained with a UV-visible liquid light guide (600 µm diameter input, 0.22 NA) connected to a USB 2000 spectroradiometer under the command of Spectrasuite software (Ocean Optics, Largo, FLA).
Analysis of spectral sensitivity data
We used the Simplex algorithm (Caceci & Cacheris, Reference Caceci and Cacheris1984) to fit the spectral sensitivity data with a combination of visual pigment absorbance curves using the equation (Sirovich & Abramov, Reference Sirovich and Abramov1977):
 $$R = {\left[ {{k_i}{A_i}^p\left( \lambda \right)} \right]^{1{\rm{/}}p}},$$
where R is the response (sensitivity) function, A ip is the absorbance of pigment i at light of wavelength λ, and p is an exponent resulting from the mathematical requirement that the spectral sensitivity function be differentiable at the origin (Sirovich & Abramov, Reference Sirovich and Abramov1977). The variables k i are coupling constants resulting from the best fit of the model to the data. All response curves that are a function of one or multiple visual pigments must conform to the above equation. The coupling constants and the exponent p are determined by the inputs of each visual pigment to the spectral sensitivity function and the complex interactions between cone mechanisms (i.e., the cone photoreceptors which house the visual pigments and related circuitry) at the various levels of retinal processing. To compare spectral sensitivity between retinal quarters, we performed this analysis on data for the dorsal retina (from the present study) as well as previously published data for the ventral retina (Novales Flamarique, Reference Novales Flamarique2017).
The absorbance values used in the model were generated with an eighth-order polynomial template (Palacios et al., Reference Palacios, Goldsmith and Bernard1996) based on the λ max of visual pigments measured by microspectrophotometry (Novales Flamarique, Reference Novales Flamarique2017). The VT quarter of the northern anchovy retina has a preponderance of two axially dichroic cone types with statistically similar visual pigments of λ max at 514 nm (the short cone) and 516 nm (the long cone). The rest of the retina is primarily populated by nonaxially dichroic triple cones which have λ max at 518 nm (lateral cones) and 556 nm (central cone) (Novales Flamarique, Reference Novales Flamarique2017). Thus, the λ max of cone visual pigments used in the analysis of spectral sensitivity for the VT retina was 516 and 556 nm (the latter to account for any potential LW visual pigment presence), and for the rest of retinal quarters (i.e., VN, DN, and DT), the combination of 518 and 556 nm. To assess whether the spectral sensitivity results were best fitted by visual pigments based on retinal (vitamin A1) or 3-4-dehydroretinal (vitamin A2) chromophore, we performed the same analysis with the corresponding combinations of vitamin A2-based visual pigments. The latter were calculated using semi-empirical models (Hárosi, Reference Hárosi1994) to be 549 nm (for the 516 visual pigment), 552 nm (for the 518 nm visual pigment), and 617 nm (for the 556 nm visual pigment).
High performance liquid chromatography
Following dark-adaptation for 2 h, five anchovies were killed and the retinas were removed from the eyecups. Each retina was then placed in a 1.5-ml Eppendorf tube and frozen in liquid nitrogen until processing for the presence of chromophore types: retinal (vitamin A1) and 3,4-dehydroretinal (vitamin A2). Retinas were homogenized by sonication in a mixture containing 60 µl of 1.92 M hydroxylamine sulfate (neutralized with 1 N KOH) and 300 µl of methanol. The homogenate was cooled on ice, following which 300 µl of dichloromethane and 150 µl of ddH2O were added and the mixture shaken vigorously. After the addition of 600 µl of n-hexane, the solution was centrifuged at 1000 g for 5 min at 4°C. The dichloromethane/hexane (top) layer was removed and placed in a 1.5-ml Eppendorf tube. This procedure was then repeated on the remaining, lower layer, after which the second extract was combined with the first and evaporated under vacuum for 1 h. The resulting, dried extract was dissolved in 100 µl of n-hexane and injected into a 5 µm YMC-Pack Silica 2.1 × 250 mm column (YMC America) attached to a high performance liquid chromatography (HPLC) system. The mobile phase running through the column flowed at a rate of 0.8 ml per minute and contained 7% ether and 0.075% ethanol in n-hexane. The computer-driven detector monitored absorbance at 360 and 400 nm and produced chromatograms which permitted identification of vitamin A1 and A2 oximes based on retention time in comparison with results from an all-trans-retinal (A1) standard (Sigma-Aldrich, St. Louis, MO).
Reverse transcriptase quantitative polymerase chain reaction
Ten dark adapted anchovies were euthanized and the left eyeballs were removed. The retinas were then extracted from the eyeballs and each cut into quarters (i.e., ventro-nasal, VN; ventro-temporal, VT; dorso-nasal, DN; and dorso-temporal, DT sectors). Each quarter was put into an RNAse-free 1.5-ml Eppendorf tube, capped, and immediately immersed in liquid nitrogen. The retinal quarters, each in its own tube, were stored at −80°C until processing for RNA extraction. This was carried out using the illustra RNAspin Mini RNA Isolation Kit (GE Healthcare, Mississauga, Ontario, CA) according to the manufacturer’s instructions.
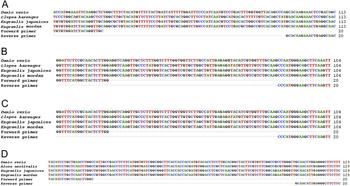
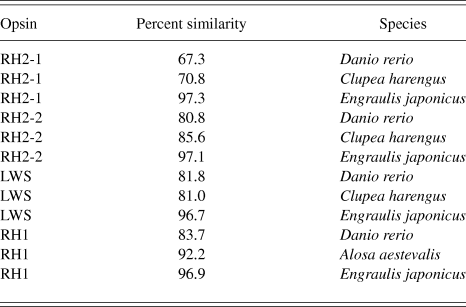
Primer pairs for amplification of RH1, RH2-1, RH2-2, and LWS opsin transcripts in the northern anchovy retina were designed based on sequences available in Genbank for the Japanese anchovy, Engraulis japonicus (Kondrashev et al., Reference Kondrashev, Miyazaki, Lamash and Tsuchiya2013), using the primer design software Primer3Plus. The accession numbers for the Japanese anchovy opsins are AB731902.1 (RH1), AB731899.1 (RH2-1), AB731900.1 (RH2-2), and AB731901.1 (LWS). The amplicons obtained were processed by agarose gel electrophoresis, sequenced (GENEWIZ Inc., South Plainfield, NJ), and aligned against published sequences for the Japanese anchovy (Engraulis japonicus), zebrafish (Danio rerio), and herring (Alosa aestivalis or Clupea harengus) using the multiple sequence alignment program ClustalW (Fig. 1). The RH1 partial sequence concurred with that reported previously for the northern anchovy (Van Nynatten et al., Reference Van Nynatten, Bloom, Chang and Lovejoy2015) and was ∼97% similar to the corresponding sequence from the Japanese anchovy (Fig. 1 and Table 1). Similarly, regardless of the opsin type, all partial sequences from the northern anchovy were >67% similar to corresponding ones from the other fishes analyzed, and ∼97% to those from the Japanese anchovy (Fig. 1 and Table 1). The high similarity with herring (Alosa aestivalis) opsins appears to be paralleled by the absorbance properties of visual pigments in the double cones and rod of the latter species (λ max of M: 517 nm, L: 556 nm, and rod: 510 nm) and the exclusive presence of A1 retinal chromophore, as assessed by microspectrophotometry (Novales Flamarique & Hárosi, Reference Novales Flamarique and Hárosi1999).
Alignment of northern anchovy (Engraulis mordax) partial opsin nucleotide sequences with those of the Japanese anchovy (Engraulis japonicus), zebrafish (Danio rerio), and herring (Alosa eastivalis or Clupea harengus). The alignment of primers is also indicated. (A) RH2-1, (B) RH2-2, (C) LWS, and (D) RH1.

Percent similarity between northern anchovy (Engraulis mordax) partial opsin nucleotide sequences and those of Japanese anchovy (Engraulis japonicus), zebrafish (Danio rerio), and herring (Alosa eastivalis or Clupea harengus). Sequences are presented in Fig. 1

Reverse transcriptase quantitative polymerase chain reactions were prepared in a 20 µl volume containing 4 ng of cDNA using the iTaq Universal SYBR Green Supermix (Bio-Rad, Hercules, CA). Thermal cycling conditions were 2 min denaturation at 95°C, followed by 40 cycles of 5 s denaturation at 95°C and 20 s of annealing-elongation at 58°C for RH1 and RH2-2 or at 59°C for RH2-1 and LWS. After amplification, a melting curve analysis was performed (65° to 95°C, with increment of 0.5°C every 5 s) to confirm the specificity of the amplicon. Non-template controls were used as negative controls. The relative expression of a given opsin mRNA was calculated using the ΔΔC t method (Livak & Schmittgen, Reference Livak and Schmittgen2001) with Cytochrome c oxidase I (coxI; accession number NC_003097.1) as the species-specific housekeeping gene, which showed stable expression throughout the retina. Each C t value (i.e., the cycle number at which the signal reaches the threshold of detection) used in the calculations is the mean of two replicates from the same reaction. The relative expression of each opsin gene (n = 10 per retinal sector) with respect to the housekeeping gene was compared between sectors by ANOVA followed by S–N–K and Tukey grouping tests with α = 0.05.
Results
Spectral sensitivities
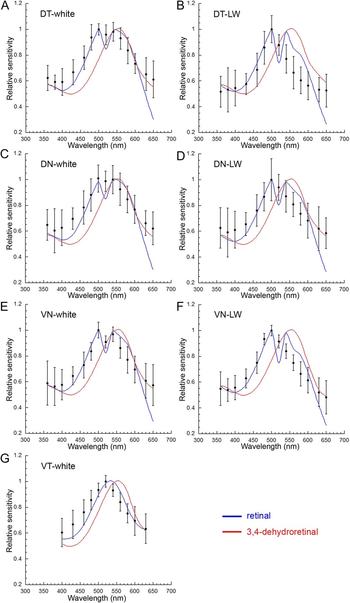
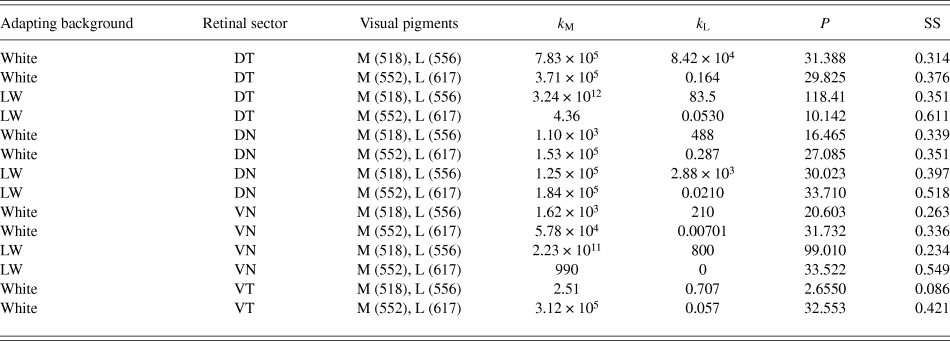
The spectral sensitivities of the DN, DT, and VN sectors of the retina were similar (Fig. 2 and Table 2). Under the white adaptation background, spectral sensitivity was characterized by two peaks, at 500 and 540 nm (Fig. 2A, 2C, and 2E) and decreased progressively beyond these wavelengths. The Simplex-derived coupling constants indicated that the M visual pigment was the primary input to the results (Table 2) and that a negative interaction should exist between the M and L cone mechanisms, as suggested by the dip between the 500 and 540 nm peaks when the curve fit involved vitamin A1-based visual pigments (Fig. 2A, 2C, and 2E). When these retinal sectors were subjected to the LW background, the spectral sensitivity functions became narrower and sensitivity decreased substantially for wavelengths above the single peak, located at 500 nm (Fig. 2B, 2D, and 2F). In accordance with these results, the Simplex-derived coupling constants indicated an even greater difference in input between the M and L cone mechanisms (compared with equivalent recordings under the white adaptation background, Table 2), and this was as expected from the suspected greater bleaching of the L visual pigment. The best fits to the data implied a negative interaction between the M and L cone mechanisms when vitamin A1-based visual pigments were used in the modeling (Fig. 2B, 2D, and 2F). By contrast, regardless of the retinal sector or adaptation background, curve fits involving the vitamin A2-based visual pigments were worse (greater sums of squares, Table 2) and could not reproduce the negative interaction between the M and L cone mechanisms suggested by the data (Fig. 2A–2F). The spectral sensitivity of the VT retina was unlike that from the other quarters in that it consisted of a single peak at 520 nm (Fig. 2G; Novales Flamarique, Reference Novales Flamarique2017). In line with this result, the Simplex-derived curve fit comprised a single peak and showed the main contribution to arise from the M visual pigment (Table 2).
Relative spectral sensitivities of the four retinal quarters in the northern anchovy. (A and B) Relative spectral sensitivity (±s.d., n = 4) of the DT retina under the white adapting background (A) and under the LW adapting background (B). (C and D) Relative spectral sensitivity (±s.d., n = 4) of the DN retina under the white adapting background (C) and under the LW adapting background (D). (E and F) Relative spectral sensitivity (±s.d.) of the VN retina under the white adapting background (E) (n = 6) and under the LW adapting background (F) (n = 5). (G) Relative spectral sensitivity (±s.d., n = 6) of the VT retina under the white adapting background. Panels E–G adapted from the data in Novales Flamarique (Reference Novales Flamarique2017). The functions are Simplex-derived best-fits to the data given combinations of visual pigments based on retinal (vitamin A1, in blue) or 3-4-dehydroretinal (vitamin A2, in red) chromophore. The model parameters are given in Table 2.

Best-fit Simplex-derived parameters and corresponding least sum of squares (SS) for the spectral functions depicted in Fig. 2. The k M and k L coupling constants are the inputs of the M and L visual pigments (or cone mechanisms) to the spectral sensitivity function. The λ max of the M and L visual pigment combinations used in the fitting process are indicated in the table. The SS statistic is derived from the sum of differences between mean spectral sensitivity data and the corresponding values predicted by the Simplex algorithm. Retinal sectors: DT, dorso-temporal; DN, dorso-nasal; VN, ventro-nasal; and VT, ventro-temporal

Chromophore type in the anchovy retina
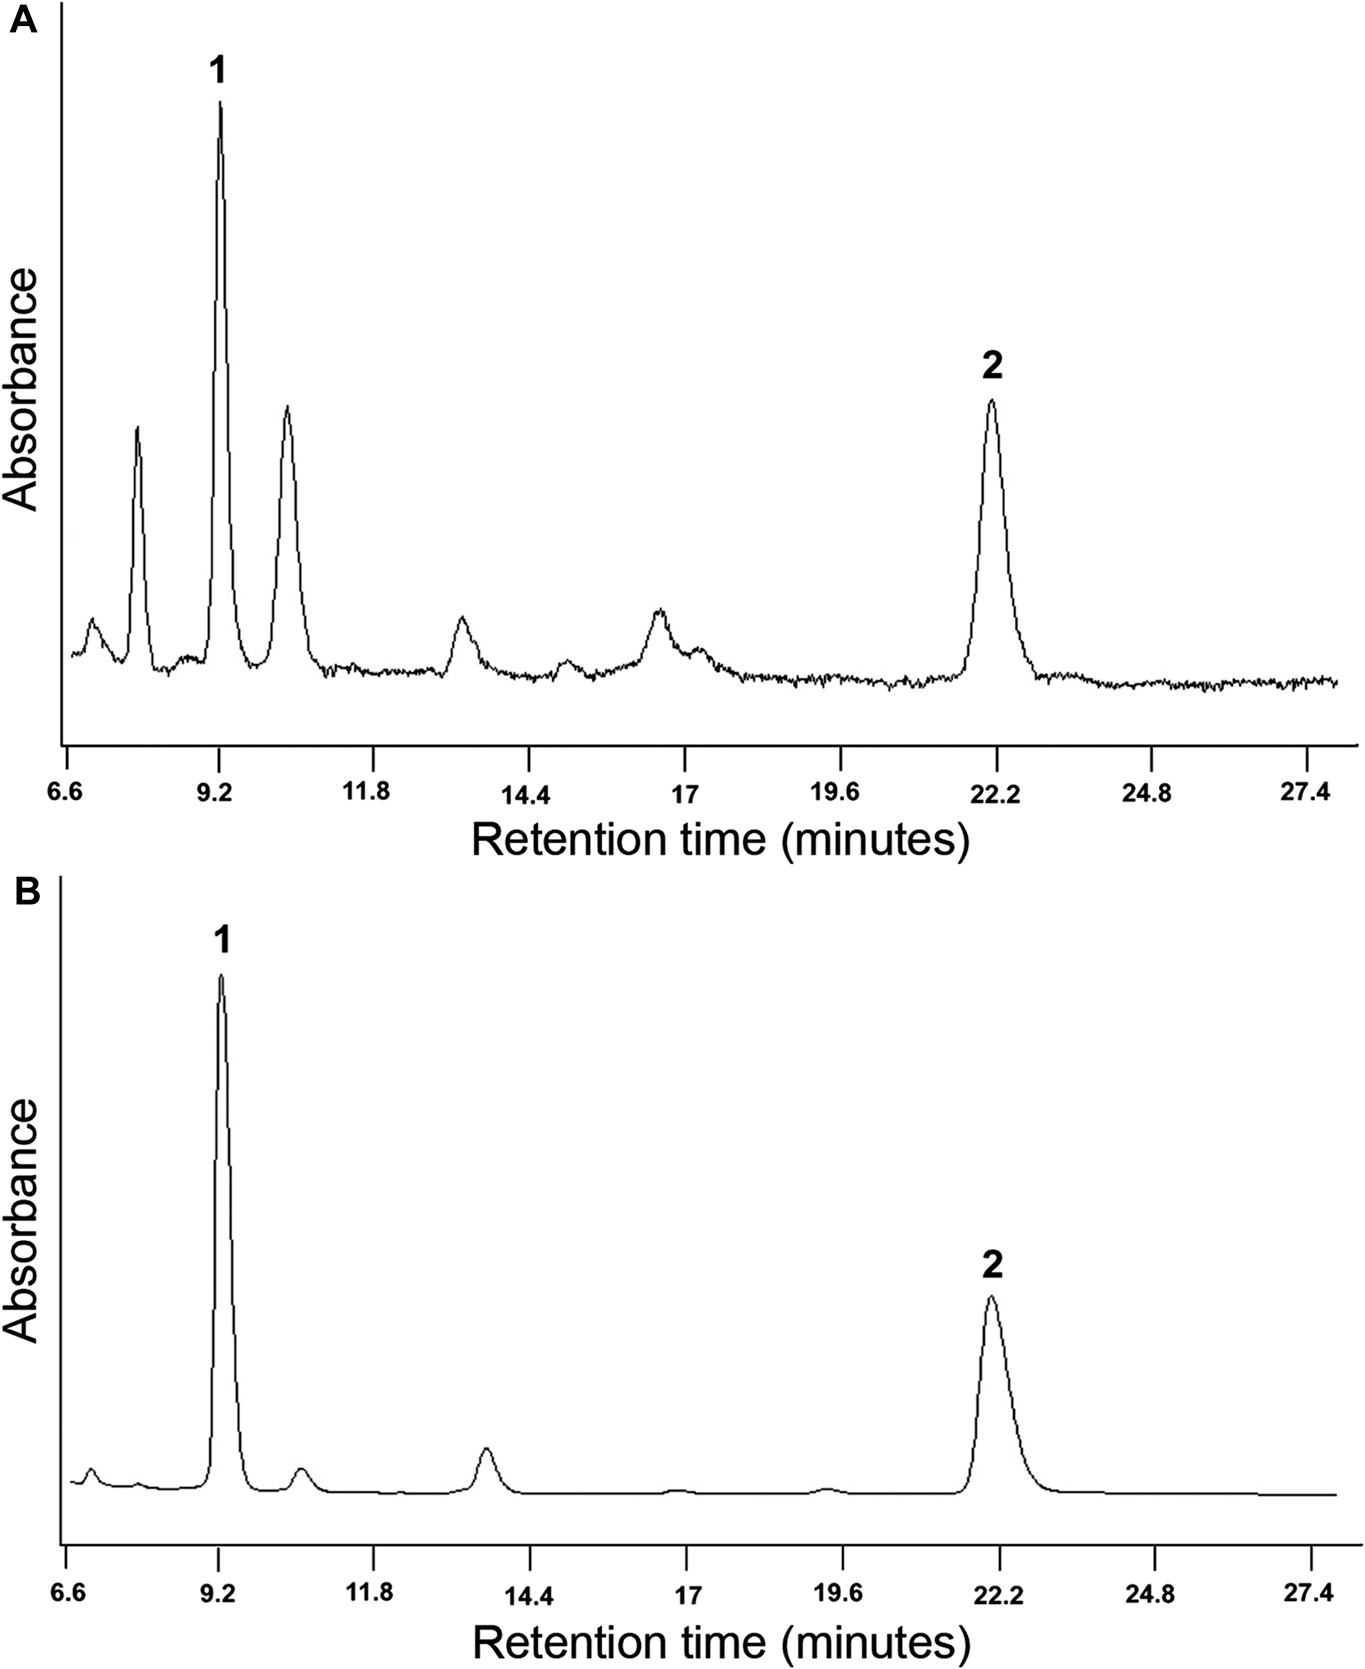
HPLC analyses of retinal extracts revealed the presence of a main absorbance peak at ∼9.2 min retention time and a secondary peak at ∼22.2 min retention time (Fig. 3A). These peaks were analogous to those exhibited by the all-trans A1 retinal standard (Fig. 3B) and corresponded to all-trans retinal oxime (peak 1) and to anti-all-trans retinal oxime (peak 2). As such, the retina of the northern anchovy only has all-trans A1 retinal as chromophore. Had there been any 3-4-dehydroretinal (vitamin A2) chromophore, the chromatogram from the retina would show additional peaks about 1 and 3 min following peaks 1 and 2, respectively, as has been demonstrated for the retinas of some freshwater fishes that contain vitamin A2 chromophore (Kondrashev et al., Reference Kondrashev, Miyazaki, Lamash and Tsuchiya2013; Iwanicki et al., Reference Iwanicki, Novales Flamarique, Ausió, Morris and Taylor2017).
Representative HPLC absorbance profiles of (A) northern anchovy retina extract and (B) the all-trans retinal (vitamin A1) standard. Peak 1 corresponds to all-trans retinal and peak 2 to anti-all-trans retinal.

Opsin transcript expression in different sectors of the retina
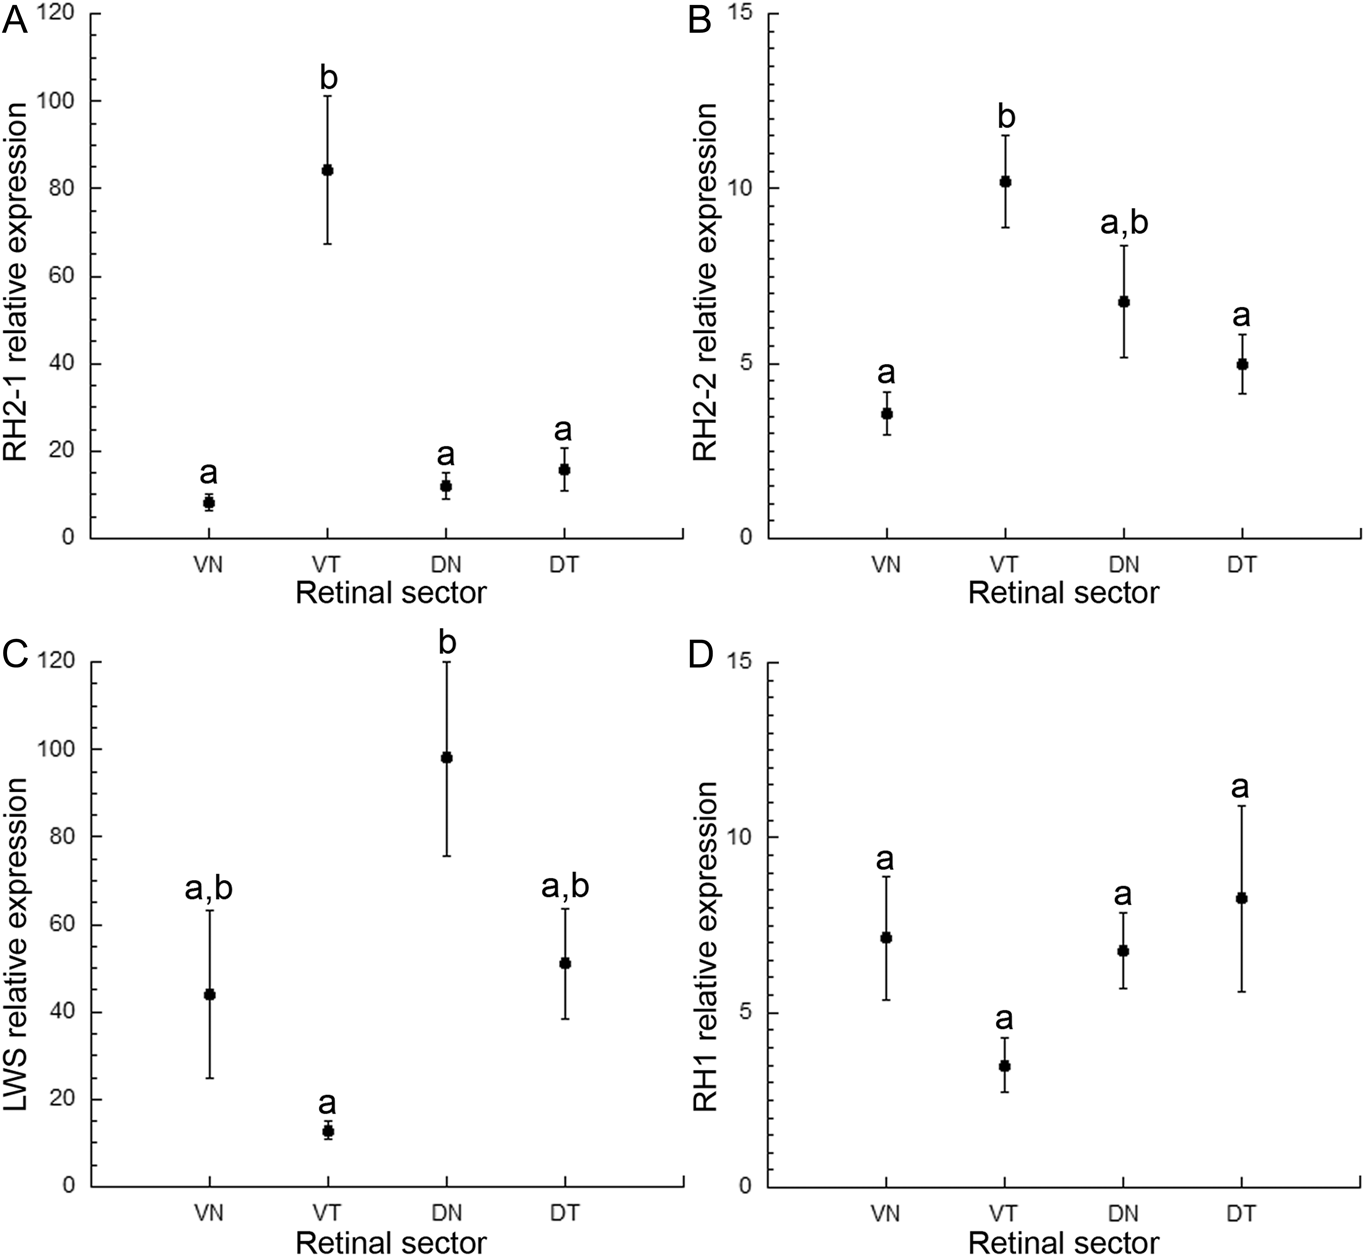
The expression of opsin transcripts was heterogeneous (Fig. 4). RH2-1 and RH2-2 showed the highest means in the VT sector (F = 21.29, P < 0.0001 for RH2-1 and F = 5.51, P = 0.0034 for RH2-2; Fig. 4A and 4B). The RH2-1 mean, in particular, was significantly different from those in other retinal sectors. Conversely, LWS had the lowest mean in the VT sector and was most abundant in the DN sector (F = 2.73, P = 0.0058; Fig. 4C). The RH1 transcript was, statistically, evenly distributed throughout the retina (F = 1.42, P = 0.254; Fig. 4D). These results indicate a preponderance of RH2 opsins, and lowest abundance of LWS opsin, in the VT sector of the retina.
Relative opsin transcript expression (mean ± s.e.) with respect to coxI as a function of retinal sector for (A) RH2-1, (B) RH2-2, (C) LWS, and (D) RH1 (n = 10 per sector). Means with the same letter (a or b) are statistically similar.

Discussion
Variable spectral sensitivities in a functionally compartmentalized retina
The retina of the northern anchovy, like that of other anchovies in the family Engraulididae (Fineran & Nicol, Reference Fineran and Nicol1978; Heß et al., Reference Heß, Melzer, Eser and Smola2006; Kondrashev et al., Reference Kondrashev, Gnyubkina and Zueva2012), is unusual among vertebrates in that it contains cones whose outer segment lamellae are oriented parallel to their lengths (Novales Flamarique, Reference Novales Flamarique2011). These cones are of two types, long (with cuneate outer segments) and short (with bilobed outer segments), are located in the VT retina, and alternate forming rows with lamellae that are orthogonal to each other. Such axially dichroic cones (Novales Flamarique & Hárosi, Reference Novales Flamarique and Hárosi2002) have been shown to possess the same visual pigment in multiple anchovy species (though the λ max varies between species; Kondrashev et al., Reference Kondrashev, Gnyubkina and Zueva2012, Reference Kondrashev, Miyazaki, Lamash and Tsuchiya2013; Novales Flamarique & Hárosi, Reference Novales Flamarique and Hárosi2002; Novales Flamarique, Reference Novales Flamarique2017) and, in the northern anchovy, mediate polarization sensitivity of the animal (Novales Flamarique & Hawryshyn, Reference Novales Flamarique and Hawryshyn1998; Novales Flamarique, Reference Novales Flamarique2017). The rest of the retina lacks these cone types and, instead, has single and triple cones with lamellae oriented perpendicular to their lengths, the latter as in other vertebrates studied (Hárosi & Novales Flamarique, Reference Hárosi and Novales Flamarique2012). In both the Japanese anchovy and the northern anchovy, the triple cones (Heß, Reference Heß2009; Novales Flamarique, Reference Novales Flamarique2011) contain two different visual pigments (Kondrashev et al., Reference Kondrashev, Miyazaki, Lamash and Tsuchiya2013; Novales Flamarique, Reference Novales Flamarique2017) and, in the northern anchovy, such cones in the VN retina have been proven to mediate spectral (color) discrimination (Novales Flamarique, Reference Novales Flamarique2017). Thus, in the northern anchovy, the ventral retina is not only structurally but functionally compartmentalized for color and polarization vision.
The results from this study show that spectral sensitivity is similar between the VN retina and the dorsal retina, regardless of the sector analyzed (DN or DT). Both dorsal quarters showed broad spectral sensitivity curves with two peaks in the middle wavelengths (at 500 and 540 nm), and a dip in between, indicating a negative interaction between a minimum of two cone mechanisms, and the potential for color vision. The presence of at least two cone mechanisms was further demonstrated by adaptation to a LW background resulting in a narrower sensitivity function peaking at 500 nm with greatly diminished sensitivity beyond this wavelength. These results (Fig. 2 and Table 2) indicate the presence of a long wavelength cone mechanism, which may be founded on the LWS visual pigment present in the central cone of triple cone units, located throughout the dorsal and nasal retina (Novales Flamarique, Reference Novales Flamarique2011). The short wavelength sensitivity could be mediated by the lateral cones of triple cone units, which house an M visual pigment (Novales Flamarique, Reference Novales Flamarique2017). It is noteworthy that the outer segment of the central cone is much smaller than that of the lateral cone (Heß, Reference Heß2009; Novales Flamarique, Reference Novales Flamarique2011; Kondrashev et al., Reference Kondrashev, Kornienko, Gnyubkina and Frolova2016), and this may explain, through a negative interaction between cone types, the diminished sensitivity at longer wavelengths (e.g., 560 nm) compared to that at shorter wavelengths (e.g., 500 nm). It is also possible that a short wavelength visual pigment may be present in anchovies (contributing, for instance, to the increased sensitivity at 480 nm in the DN retina, Fig. 2C) and may be housed in the single cones, whose absorbance is unknown. However, no SWS1 or SWS2 opsins, which would give rise to UV and short wavelength absorbing pigments, have been found in the retina of the Japanese anchovy (Kondrashev et al., Reference Kondrashev, Miyazaki, Lamash and Tsuchiya2013), even though an SWS1 opsin is present in the Japanese sardine (Miyazaki et al., Reference Miyazaki, Kondrashev, Kasagi, Mizusawa and Takahashi2017) and an S (447 nm) visual pigment is found in the blueback herring (Novales Flamarique & Hárosi, Reference Novales Flamarique and Hárosi1999), two close relatives. Together with previous results for the ventral retina, the present findings demonstrate a retina with variable spectral sensitivity and with the potential for color vision in all sectors except the VT region (Fig. 2), which is the only quarter known to mediate polarization vision (Novales Flamarique, Reference Novales Flamarique2017).
Differential opsin expression as the source of intraretinal variation in spectral sensitivity
As in the Japanese anchovy (Kondrashev et al., Reference Kondrashev, Miyazaki, Lamash and Tsuchiya2013), the retina of the northern anchovy contained only retinal (vitamin A1-based) chromophore. Thus, variability in the absorbance of visual pigments could only be due to differential expression of opsin types. RH2-1 expression was significantly greater in the VT retina, and the RH2-2 mean was 1.4 to 2.9 greater than corresponding means from other sectors. Conversely, the LWS mean associated with the VT sector was the lowest of all means; the ratio of means of LWS to the sum of RH2s was 0.13, 3.7, 2.5, and 5.2 for the VT, VN, DT, and DN sectors of the retina. These results show opposite trends in relative magnitude of RH2 and LWS expression between the VT sector and the rest of the retina.
The relative expression of the various opsin transcripts is in line with the results from visual pigment measurements and the variability in spectral sensitivity functions. Two, statistically similar, M visual pigments (with λ max at 514 and 516 nm) were found in the VT retina among the axially dichroic cone population (Novales Flamarique, Reference Novales Flamarique2017). Accordingly, the spectral sensitivity function showed a single peak at 520 nm with reduced sensitivity in the shorter and longer wavelengths (Fig. 2G; Novales Flamarique, Reference Novales Flamarique2017). The preponderance of RH2 opsin transcript expression and lowest LWS expression in the VT retina thus agrees with what would be expected from the physiological findings. In fact, it is possible that expression of LWS within this area of the retina is not due to the axially dichroic cone population. This is because the area occupied by these cones does not cover the entire VT quarter and the results were therefore likely influenced by adjacent cone populations, which contain triple cones whose central element houses an L (λ max ∼ 556 nm) visual pigment.
The remaining quarters of the retina had greater expression of LWS over RH2 opsin transcripts, and this is also as expected from the physiological results. These areas of the retina are populated by triple cones with comparatively lower, but variable, numbers of single cones, and with at least two distinct visual pigments (Novales Flamarique, Reference Novales Flamarique2011, Reference Novales Flamarique2017). Accordingly, the optic nerve-derived spectral sensitivity functions showed two peaks in the middle wavelengths and the capacity for color discrimination (Fig. 2A–2F). Together, our results describe the first fish retina with intraretinal variability in spectral sensitivity that can be explained by differential expression of opsin transcripts.
RH1 transcript expression was evenly distributed across the retina and this may be indicative of similar rows of rods (3–5 elements in width) that alternate with those of cones throughout the retina (Novales Flamarique, Reference Novales Flamarique2011). The expression of the rod opsin transcript was lower overall than that of the sum of cone opsins, which is unusual for a duplex retina. A potential explanation may reside in the minute outer segment volume of individual rods compared with those of cones (Novales Flamarique, Reference Novales Flamarique2011; Hárosi & Novales Flamarique, Reference Hárosi and Novales Flamarique2012).
Potential ecological correlates of the northern anchovy’s visual capabilities
The ecological advantages of a functionally segregated retina for color and polarization vision in the northern anchovy are unknown. It is likely that the polarization sensitive area, with its highly packed axially dichroic cones (Novales Flamarique, Reference Novales Flamarique2011), serves to detect small zooplankton prey that would disrupt the background polarization in the upper frontal field. Alternatively, it may also be used to detect avian predators against the downwelling polarized light field during crepuscular periods, when anchovies are commonly found near the water surface (Hayasi, Reference Hayasi1963; Weimerskirch et al., Reference Weimerskirch, Bertrand, Silva, Bost and Peraltilla2012). Such predators would be perceived as shadows diving downwards and survival of the anchovy may depend on their early detection, when they are but small objects in the sky. Other areas of the retina, with the capability for color vision, may be more apt to detect predators based on reflections whose wavelength content stand out against the longer wavelength background (Novales Flamarique & Hawryshyn, Reference Novales Flamarique and Hawryshyn1997; Novales Flamarique et al., Reference Novales Flamarique, Mueller, Cheng and Figiel2007), or to maintain cohesion with other fishes in the school whose quick turns would produce reflection flashes with high contrast against the background. However, having matching and offset visual pigments (and associated sensitivity) to the prevalent wavelengths in the background may not necessarily translate into visually mediated behaviors based on chromatic contrast. As is the mouse, whose dual-opsin expressing S cones in the ventral retina may be primarily devoted to achromatic detection of avian predators (Baden et al., Reference Baden, Schubert, Chang, Wei, Zaichuk, Wissinger and Euler2013), triple cones in the VN retina of the anchovy may have additional physiological properties that endow them with a functional preference for detection of achromatic contrasts.
Acknowledgments
We thank Mike Cornman (Westport Seafood Inc.) for donating the anchovies and Lisa Grebinsky for help with field collections and fish husbandry. This research was supported by Natural Sciences and Engineering Research Council of Canada (NSERC) grant # 238886 to INF.