Introduction
The rise in cause-oriented repertoires in political participation amongst young people, exemplified by the mobilizations of the anti-globalization or global justice movement, has included the widespread engagement of university students in costly modes of participation, such as demonstrations, strikes, and acts of political violence (Della Porta, Reference Della Porta2008). These modes of participation have become so widespread as to render the old distinction between ‘conventional’ and ‘protest’ politics as irrelevant (Bean, Reference Bean1991; Norris, Reference Norris2007: 639). Even though student movements can hardly be considered a homogeneous phenomenon, one central theme of research has been to explain why students participate in such protest activities. Ever since the experience of the civil rights movement, the demonstrations during the Vietnam War and the events in Europe that culminated with Paris 68, social scientists have been investigating the correlates of university students’ protest (for a review of the early literature see Levin and Spiegel, Reference Levin and Spiegel1977).
Empirically, the study of protest activity poses a serious challenge to conventional sampling methods as it has been generally difficult for researchers to survey individuals at the actual locations of protest. As a consequence, researchers have often resorted to proxies such as the propensity to protest (e.g. Psacharopoulos and Kazamias, Reference Psacharopoulos and Kazamias1980; Muller et al., Reference Muller, Dietz and Finkel1991; Heath, Reference Heath2008) or interaction variables between past protest and future propensity to protest (e.g. Muller and Opp, Reference Muller and Opp1986; Finkel et al., Reference Finkel, Muller and Opp1989; Bean, Reference Bean1991). However, as Finkel and Muller (Reference Finkel and Muller1998: 38) observe, the empirical evidence shows that ‘the relationship between behavioural intentions and actual behaviour is weak’. We address this problem by collecting our own data from a case of university student activism in Greece during 2006 and 2007. In so doing, we have assembled a sample containing important variation in terms of degree of protest involvement. Therefore, we are in a position to examine the role of process incentives through survey data relating to a real case of student protest (see also Möller et al., Reference Möller, Sander, Schäfer, Villányi and Witte2009). In this way, we solve the small-n problem of conventional survey studies without resorting to poor proxies for actual protest activity.
Theoretically, our paper focusses on the role of process incentives (i.e. incentives related to the act of participation) by evaluating their role in students’ decisions to take part in protest activities, in two important ways. First, we explore the unconditional effect of the expected gains from the act of protesting itself on students’ decisions to take part in protest activities. We do that by focusing on actual participation since our data come from a real case of a protest movement. Second and more importantly, we examine the extent to which process incentives qualify the weight attached to the primary elements of our empirical model based on a ‘wide’ view of rational choice theory (Opp, Reference Opp1999; Finkel, Reference Finkel2008). This model includes the effects of social norms, social identity, and entertainment. More specifically, we ask whether students who anticipate benefits will stem from the action itself perceive the acquisition of the public good as the most important factor in their decision-making process, or if, conversely, process incentives make concerns such as the perceived efficacy of one's marginal involvement or the costs associated with this action less important. The importance of process incentives becomes evident when we show that they constitute a first stage precondition for the elaboration of other potential determinants of protest activity. It is not only that the attributes associated with the process of protesting make participation more likely. Rather, the perception that the process of protesting will yield considerable benefits becomes a precondition for thinking about other parameters related to protesting. Unless there is anticipation of perceived benefits stemming from the act itself, other seemingly important concerns become less important.
Student protest, rational choice, and process incentives
Seen as a mode of political participation, protest activity has often been studied within the framework of rational choice theory (Opp, Reference Opp2009: 45–126). One crucial problem for rational choice theory in trying to explain protest activity is the presence of free-riders. Because protesters’ goals can be seen as a public good, which will become available to all regardless of participation, individuals have a tendency to free-ride. Collective action can thereby be seen as a situation akin to the ‘prisoner's dilemma’ in which each individual's self-interested rational behaviour will lead to a collective non-optimal result (Hardin, Reference Hardin1982: 25–28), in this case reflected by the decrease in the probability of obtaining the common goal. This makes protest paradoxical from a rational choice theory perspective where individuals make decisions by weighing the cost of participation against its potential benefits. Consequently, it has been typically difficult for rational choice theorists to account for costly modes of political participation based only on a cost–benefit equation.
Given this problem with pure rational choice models of protest behaviour, the focus of many studies has shifted to investigating and proposing different ways in which the problem of free-riding can be overcome (e.g. Lichbach, Reference Lichbach1995; Lichbach, Reference Lichbach1996; Kalyvas and Kocher, Reference Kalyvas and Kocher2007; Leeson, Reference Leeson2010). Since Olson's (Reference Olson1965) seminal work on the collective action problem, the key element for explaining the seeming paradox of collective action has been the use of selective incentives. Selective incentives are benefits, which in contrast to the public good whose acquisition constitutes the goal of the participants, are not disseminated to all interested members, but remain private and are only shared among participants. In explaining collective action, Olson (Reference Olson1965: 51) referred to incentives, which ‘will stimulate a rational individual in a latent group to act in a group-oriented way’. As mentioned, these incentives are selective inasmuch they remain private, distributed only to the participants of collective action. Selective incentives can be ‘negative’ or ‘positive’, typically taking different forms as punishments or rewards, respectively (Olson, Reference Olson1965; Oliver, Reference Oliver1980; Lichbach, Reference Lichbach1995: 216–244). In a protest activity context, negative selective incentives in political participation include compulsory membership or the threat of violence against non-participants, whereas positive selective incentives often include financial or office rewards.
Not all selective incentives have to be based on economic or strictly material underpinnings, however. As Olson (Reference Olson1965: 60) remarked, ‘people are sometimes also motivated by the desire to win prestige, respect, friendship, and other social and psychological objectives’. In this respect, researchers have theorized the role of family, friends, and ‘significant others’ in shaping the perceptions of benefit and cost through social norms, and other non-material psychological gains. Personal contacts and particular contextual influences might foster mobilization through a process of social networking. People might not hold strong feelings about the goals of the protesters but will still take part because they want to conform to the general trend within their personal environment, or to avoid being ostracized (Elster, Reference Elster1989b: 101; Olson, Reference Olson1965: 60–62).
In social movements non-material selective incentives often involve psychological gains stemming from the very act of participation. As Hardin (Reference Hardin1982: 123) argues, ‘the desire to participate in experiences of one's generation might lead one to participate in an action or movement whose purposes one does not support’. In the case of protest activities, selective incentives often relate to the process of protesting itself. In this sense, being a ‘student activist’ becomes a ‘prized social identity’, which supplies the ‘selective incentives to participate’ (Polletta, Reference Polletta1998: 143; Polletta and Jasper, Reference Polletta and Jasper2001: 290). Other explanations focus on the role of organizations and social networks in fostering collection action (Andrews and Biggs, Reference Andrews and Biggs2006). An important constituent of these explanations is the degree of solidarity (Wilson, Reference Wilson1973: 39–45), in the sense of ‘positive feelings toward others can lead to action on behalf of that group or category’ (Jasper, Reference Jasper1998: 406). Identity and solidarity, however, are interrelated as they both refer to the movement itself and to the pleasures associated with the act of protesting (Jasper, Reference Jasper1998: 417).
Another important but rather understudied kind of process incentive is entertainment. Tullock (Reference Tullock1971) was the first to include an entertainment indicator in the calculus of participating in rebellion. According to this reasoning, ‘free riders’ can be transformed to ‘joy riders’ when collective action attains an entertaining character (Lichbach, Reference Lichbach1996: 109). Entertainment can therefore be considered as a process incentive since it is directly related to the very process of protest activity. Tullock (Reference Tullock1971: 92) conceded that entertainment would not be ‘an important variable in serious revolutionary or counter-revolutionary activity’, but nevertheless admitted that it would be a more important determinant of student protest. Political protest often assumes ‘aspects of a festival’ (Elster, Reference Elster1989a: 45) and historians have researched how humour and music relate to social protest (see Eyerman, Reference Eyerman2002; Teune, Reference Teune2007). Entertaining activities such as concerts and parties are commonly associated with student protest activity, as exemplified by numerous cases in the 1960s where ‘folksingers rewarded anti-war demonstrators by singing at protest rallies’ (Oliver, Reference Oliver1980: 1356). Nevertheless, the entertainment value of protest need not be limited to such activities. The process of being engaged in protesting allows students to meet like-minded people, fraternize and get acquainted with strangers (Oberschall, Reference Oberschall1993: 12). Students often get ‘excited by the struggle and value the opportunity to match wits with their opponents’ (Lichbach, Reference Lichbach1996: 109), whereas social and political protest gives them a general sense of empowerment. As Lieberman (Reference Lieberman2004: 15) summarized the feelings of the 1960s Midwest American student protesters: ‘they were taking control of their lives – living out the ideal of participatory democracy – and having fun doing it’.
Our theoretical framework starts with the classic cost–benefit equation of rational choice theory (Opp, Reference Opp2009: 45–49) and expands it by including the social and psychological process incentives mentioned above. The degree to which such incentives can be incorporated in a ‘wide’ rational choice model without ‘adulterating’ rational choice theory has been discussed before and the answer has been positive in both broad theoretical terms (Chong, Reference Chong1995: 53–56; Opp, Reference Opp1999) and in more specific research contexts (Finkel, Reference Finkel2008; Goldfarb and Sigelman, Reference Goldfarb and Sigelman2010: 291–293). Moreover, past research has included such process incentives in systematic accounts of protest activity or the propensity to protest (Klandermans, Reference Klandermans1984; Muller and Opp, Reference Muller and Opp1986; Muller et al., Reference Muller, Dietz and Finkel1991; Finkel and Muller, Reference Finkel and Muller1998) and political participation in general (Finkel and Opp, Reference Finkel and Opp1991; Whiteley, Reference Whiteley1995; Bäck et al., Reference Bäck, Teorell and Westholm2011) and has concluded that they are important in understanding protest activity and political participation. However, the inclusion of indicators representing process incentives has thus far served either as a control to account for unobserved heterogeneity in examining the impact of other theoretically interesting variables, or as an attempt to evaluate its direct effect on the decision to participate in rebellions or violent protest.
Here, we take this existing evidence as our departure point. Unlike the aforementioned literature, we focus on the indirect effect of process incentives and explore their influence on the importance attributed either to cost–benefit considerations or to attitudinal characteristics that might lead to the decision to get involved into protest activities. Our contribution therefore lies in demonstrating the way in which process incentives interact with the core elements of rational choice theory in explaining protest activity. Accordingly, we do not simply argue that identity, solidarity, and entertainment are significant predictors of actual participation. Our argument is more important. We argue that such process incentives work as first stage preconditions for participating. Other considerations become much less important without these aspects. In other words, perceiving such benefits from the process of protest activity is a precondition for considering all other parameters entailed in this process. Further concerns, such as the perceived efficacy or the importance of obtaining the public good are important, but they are so only for those who believe that taking up this task is going to deliver some process benefits.
We test this claim by examining a recent case of university student protest in Greece. We believe that university students in Greece offer an interesting case to study since, historically, all the attempts of conservative governments to advance reforms in higher education (1979, 1991, and 2006) have been met by students with a dynamic pattern of protest: demonstrations, marches, rallies, sit-ins and, most importantly, campus building occupations. Most recently, protests involving young people in Greece have turned into large-scale riots (see Hugh-Jones et al., Reference Hugh-Jones, Katsanidou and Riener2011), so given the longevity, persistence, and broad appeal of costly and high-risk protest tactics, studying university students in Greece provides a fertile context for using a rational choice theory framework. Nevertheless, with the exception of Psacharopoulos and Kazamias (Reference Psacharopoulos and Kazamias1980) who investigated the correlates of student activism in Greece based on a survey conducted in 1977, empirical research using data from Greece has been limited.
Method and data
Our data come from a survey conducted in Greece amidst a series of university student protests. In April 2006, the Greek minister for education decided to move forward with the drafting of a new bill for higher education reform. Several of the proposed reforms, however, proved to be controversial among the higher education community. In particular, students felt that the proposed reforms would lead to the commercialization of higher education (see Psacharopoulos, Reference Psacharopoulos2003). Equally controversial was the proposal for limiting the time allowed for the completion of degrees (and thus expelling any students that failed to complete their degrees within the proposed time-limits), as well as the change in the law, which bans police from entering university grounds. This last point, in particular, was seen as a source of concern regarding academic freedom. Beginning in May 2006, Greek university students began to mobilize, and responded with a variety of protest tactics that included rallies, strikes, and marches aimed at preventing the Government from submitting the bill to the Parliament. Student mobilization soon escalated in clashes with the riot police and sit-ins that led to the effective occupation of the buildings of 429 (out of 454) departments in higher education institutions (Chronicle of Higher Education 2007, March 23). The Government decided to postpone the submission of the bill to September, and the crisis was reduced until the next academic year. In October 2006, however, when the issue was brought back, students resumed protesting in a second wave of rallies and building occupations (albeit on a smaller scale) that lasted until November. The bill was finally put to vote in March of the following year amidst a third wave of student protests.
Our data come from a survey that was implemented during the aforementioned turbulent period of university students’ activism. Although we tried to broaden our sampling frame so that it would be as inclusive (and thus as representative) as possible, we were forced to exclude a few small universities located in relatively remote areas. As the number of students in those institutions account for less than one tenth of the total student population in Greece, this can only marginally affect the general pattern. For practical reasons, we implemented two different sampling strategies.Footnote 1
First, we chose a two-stage stratified system using the classroom as the primary sampling unit and a random sample of individuals drawn within each classroom. A potential problem with this sampling strategy is that given that attendance to lectures is not compulsory, there may be systematic under-representation of a particular group of students that differ in participation levels from those who regularly attended lectures during the mobilization period. To address this problem we also engaged in snowball sampling. Given that in high-cost protest activities participation is skewed towards modes of participation, which do not assume much cost for the participant, we needed to engage in unconventional sampling procedures, which would ensure that students with a high level of participation in protests would also be present in our sample. In this sense, students participating in high-cost protest activities qualify as a ‘hidden-population’ for which snowball sampling (asking a participant to direct us to other participants) is an appropriate technique (see Spreen, Reference Spreen1992). Although technically better than simple convenience sampling, snowball sampling is biased towards more cooperative participants and referrals with large network links (Erickson, Reference Erickson1979: 299). In order to overcome these biases we engaged in a special method of snowball sampling, known as respondent-driven sampling (see Heckathorn, Reference Heckathorn1997). Respondent-driven sampling is effective due to the introduction of a dual incentives system. Respondents receive a reward for their own participation as well as for each participant they recruit. Using university students not only as referrals but also as effective recruiters enabled us to use their social influence to induce and effectively monitor respondents’ compliance (Heckathorn, Reference Heckathorn1997: 177). Moreover, peer pressure ensured that the offer of non-material rewards such as those employed in our survey would be effective in securing compliance (see Heckathorn, Reference Heckathorn1997: 177–179).
Mean sample differences between respondents from the two samples were not significant with respect to demographics (year of study and gender) and other characteristics regarding their relationship with the university (student union membership; field of studies; evaluations regarding the proposed law). To be sure, respondent-driven participants were significantly more active in protest activities than class-based respondents (mean participations 5.05 and 3.82, respectively). This was an anticipated outcome since one of the reasons respondent-driven sampling was introduced was to specifically target student activists. The final sample size was 505, with 364 participants from classroom sampling and 151 participants from respondent-driven sampling.
Model specification
The questionnaire focused on the impact of personal (egocentric) and general (sociotropic) benefits, costs, and selective incentives, distinguishing between social norms and process incentives. Following previous research, we model the core cost–benefit equation by an interaction between the public good and the perceived probability that individual participation will be important for the acquisition of this good. Perceived cost is then subtracted from the sum of the two perceived benefit products. We thus use the classical rational choice formula,
 $$)(-->$<>U\, = \,pB{\rm{ - }}C<$>
<!--$$
, as our departure point: U denotes the utility from engaging in some collective action, B stands for the utility obtained from acquiring the public good, weighted by the probability (p) that one's own contribution will be decisive for the final outcome. The perceived cost associated with this collective action is then subtracted from the final product. We further qualify this expression by distinguishing between egocentric and sociotropic concerns with regard to the acquisition of the public good and by including another term S, which stands for various types of selective incentives, that is, benefits that one can enjoy only as a result of taking part in the collective action:
 $$)(-->$<>U\, = \,pB{\rm{ - }}C\,{\rm{ + }}\,S<$>
<!--$$
. The following set of equations provide a generic representation of the models used to fit the data:
 $$Participatio{{n}_{ij}}\, = \,\alpha \, + {{\omega }_j}\, + \,\left( {{{\beta }_1}\, + {{\beta }_2}} \right){{p}_{ij}}\,\left( {P{{B}_{ij}}\, + \,G{{B}_{ij}}} \right){\rm{ - }}{{\beta }_{\rm{3}}}P{{C}_{ij}}$$
 $$ = \,\alpha \, + \,{{\omega }_j}\, + \,\mathop{\sum}\limits_{k\, = \,1}^2 {{{\gamma }_k}S{{N}_{ij}}} \quad\quad\quad\quad$$
 $$\matrix{ = \,\alpha \, + \,{{\omega }_{j\,}} + \,\delta P{{I}_{ij}} \hfill \quad\quad\cr \quad+ \mathop{\sum}\limits_{\lambda \, = \,1}^8 {{{\varphi }_\lambda }I{{C}_{ij}}\, + \,\mathop{\sum}\limits_{\mu \, = \,1}^5 {{{\tau }_\mu }C{{C}_{ij}}\, + \,{{e}_i}} } $$
where p is the perceived probability that one's own participation will significantly aid the movement; PB is a measure of personal (egocentric) benefit from abolishing the law; GB is a measure of general (sociotropic) benefit from abolishing the law; PC is a composite measure of the perceived cost of taking part in the students’ movement; SN stands for Social Norms, measured here, as will be further elaborated on below, with two indicators capturing the opinion of important others about the draft bill; PI stands for Process Incentives; IC and CC encapsulate individual- and context-level control variables; e denotes the random i.i.d. disturbance term and α, ω, β 1, β 2, β 3, γ, δ,  $$)(-->$<>\varphi <$>
<!--$$
and τ are constants to be estimated from the data.
The double subscript denotes individual i from faculty j, hence a series of two-level models with faculty-specific random intercepts (ωj) are estimated.
We shall briefly present the operationalization of all the variables shown in Equations (1)–(3). The online appendix offers more details about the measurement strategy followed in the analysis. The dependent variable comprises of several questions about the individual's level of participation during the period of occupations. These questions refer to whether the student participated and voted in the general assemblies of the faculty, took part in marches and demonstrations, and the extent to which the student participated in the occupation of their faculty or university. The resulting index, which has been recoded to range from 0 to 10, seems to perform quite well in terms of criterion validity (Carmines and Zeller, Reference Carmines and Zeller1979: 17–20). The survey included a question that asked students to evaluate their personal degree of participation on a 0–10 scale (ranging from no active involvement to very active involvement). The correlation between our dependent variable and this question is 0.822. We are thus confident that our set of factual questions about individuals’ level of involvement in the movement is sufficient to summarize their overall participation levels.Footnote 2
The variable denoting personal benefit is captured through a single question about whether the respondent believed that the bill would affect his or her own studies. General benefit is measured by an item asking whether the student was motivated by the fact that the bill's proposals would affect other students as well. Personal efficacy is measured through a scale consisting of three binary indicators about the individual's perception of the impact of his or her contribution on the students’ movement (see Muller and Opp, Reference Muller and Opp1986: 478; Finkel et al., Reference Finkel, Muller and Opp1989: 893; Opp, Reference Opp1990: 221; Whiteley, Reference Whiteley1995: 229; Finkel and Muller, Reference Finkel and Muller1998: 42). The scale was recoded to range from 0 to 1, reflecting the theoretical perception that the acquisition of the collective good needs to be weighted by the perceived probability of significant marginal contribution.
Cost is measured with three items referring to three different side-effects of getting involved in protest activities: losing time for personal activities; the possibility of acquiring the label of ‘trouble-maker’; and the delay in completing one's degree course (see Klandermans, Reference Klandermans1984: 590; Oliver, Reference Oliver1984: 803–804; Muller and Opp, Reference Muller and Opp1986: 479; Muller et al., Reference Muller, Dietz and Finkel1991: 1274; Whiteley, Reference Whiteley1995: 229; Finkel and Muller, Reference Finkel and Muller1998: 42).
Social norms (SN) are captured through two sets of items (see Klandermans, Reference Klandermans1984: 590; Muller and Opp, Reference Muller and Opp1986: 478–479; Opp, Reference Opp1990: 221; Muller et al., Reference Muller, Dietz and Finkel1991: 1274; Whiteley, Reference Whiteley1995: 230). First, participants were asked about the opinion of ‘significant others’ towards protest activity and how important this opinion was to them. The same series of questions was repeated regarding the respondents’ family. Each of the two resulting variables were created by taking the product of these two survey items (opinion of others × importance of opinion of others to individuals).
The variable of process incentives (PI) is constructed through a scale of three items intended to measure entertainment, solidarity, and identity. As has been pointed out before (Opp, Reference Opp2009: 217–219; Aguiar et al., Reference Aguiar, Brañas-Garza, Espinosa and Miller2010: 263), identity is conceptually ambiguous as sociologists and economists have come up with multiple, often conflicting, definitions. As it is not possible to provide a full discussion here, we refer to identity according to how it has been operationalized within the wide rational choice framework, namely as the need to relate with like-minded people. The questions we used therefore referred to evaluations about how entertaining and comfortable it might be to take part in rebellious actions and about the opportunity to meet like-minded people (see Muller and Opp, Reference Muller and Opp1986: 478; Whiteley, Reference Whiteley1995: 230; Finkel and Muller, Reference Finkel and Muller1998: 42). Although these questions may not fully capture the concepts of entertainment, solidarity, and identity as they have been defined by various researchers, they nevertheless give us an index indicator regarding the variance of process incentives among the surveyed students.
Given increased politicization within Greek universities (where student unions are directly associated with and funded by, the major political parties) and the partisan character of the opposition to the bill (proposed by a right-wing government), we statistically control for potential factors that might account for the level of participation while sharing variance with the parameters of interest. Starting with the individual-level covariates (IC), we control for left-right self-placement (0–10 scale, see Whiteley, Reference Whiteley1995: 230), to account for the fact that student mobilization was mainly channelled through student unions politically opposed to the right-wing government. The expectation is that the more people locate themselves to the left of the ideological continuum, the more likely they are to participate in the protest activities (see Clarke and Egan, Reference Clarke and Egan1972: 507–508). A similar scale is also used to measure students’ assessments of the bill. Since we are not interested in the bill per se but rather in the sources of protest activity, it is essential to control for the possibility that some people did not take part in the movement simply because they were in favour of the bill (see Opp, Reference Opp1990: 221). A variable measuring students’ value priorities is also added, assuming that protest potential is higher among that portion of students characterized by post-materialist concerns (see Kim, Reference Kim1991). We also include gender (see Sherkat and Blocker, Reference Sherkat and Blocker1994) and the starting year of studies with the assumption being that participation should be more costly for students closer to graduation.
Last but not least, we add an index variable in order to control for the possibility that it was not abolishing the bill that motivated student participation, but rather an inherent feeling of discontent stemming from dissatisfaction with the quality of studies offered by Greek universities. The variable consists of three items. The first asked about whether the proposed bill was part of a more general plan aiming at abolishing the public and free character of higher education in Greece. The other two refer to students’ evaluations about the quality of studies offered in their university and the extent to which things have improved or worsened over recent years. The resulting variable therefore controls for student grievances measured as dissatisfaction with policy and public goods (see Oliver, Reference Oliver1984: 605; Opp, Reference Opp1988; Finkel et al., Reference Finkel, Muller and Opp1989: 892; Opp, Reference Opp1990: 221; Finkel and Muller, Reference Finkel and Muller1998: 41). We use grievances (pessimism) as a control and not as a separate explanatory variable based on the observation that grievances offer little explanatory power compared with the rational choice models (Muller et al., Reference Muller, Dietz and Finkel1991) as they remain relatively stable over time (see Jenkins, Reference Jenkins1983: 530).Footnote 3
As contextual controls we employ two indicators. We included two sets of dummies, one to distinguish among different areas of study (humanities vs. sciences) and the other to control for the different geographic locations of the universities included in the analysis (see van Dyke, Reference van Dyke1998), distinguishing between faculties located in Athens and Thessaloniki – by far the two largest cities in the country – and small towns. Finally, we included a dummy controlling for different sampling methods and another to control for respondents from the Faculty of Humanities of the University of Western Macedonia for reasons that will become apparent in the following section.
Descriptive statistics and diagnostics
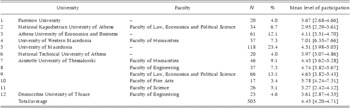
The first two columns of Table 1 present the number and percentage of observations in each faculty or university. Two points need to be made. First, it might seem strange that we sometimes group the cases within a university as a whole, and at other times separate faculties. The reason for this is that we try to follow the administrative and political structures within each context. Universities with a very large number of faculties have separate electoral and administrative procedures for each faculty, and therefore their students communicate with their fellows from other faculties no more than with students from different institutions. On the other hand, there are various relatively small universities, which although they have more than one faculty, share common participation processes and the same administrative structure. More importantly, students cohabit in the same buildings and thus they receive similar contextual influences.
Descriptive statistics about the distribution of observations and mean level of participation among universities/faculties

Note: bootstrapped confidence intervals (100 replications) in brackets.
The second point relates to the mean level of participation in each second-level unit of analysis, as shown in the last column of Table 1. Entries in brackets denote the 95 bootstrapped confidence intervals (bootstraps taken within faculty, 100 replications). As may be seen, although there is some variation both in the mean levels and in the degree of uncertainty associated with the point estimates (according to the number of cases in each unit), there is only one case that stands out. This is the Faculty of Humanities of the University of Western Macedonia, where mean participation appears to be much higher than average. This stark difference may simply be the consequence of respondent-driven sampling, which is necessarily not distributed uniformly among faculties. Again, to ensure that results are driven by this case, we include a dummy denoting the observations from this particular faculty.
To account for the nested pattern of the data generation process, which might lead to faculty-level intra-correlation among respondents, we estimate the parameters using a two-level model. Generalized linear squares estimators are robust to the presence of heteroskedasticity and permit the estimation of various patterns of within-cluster correlation. Unavoidably, variation in the mean response is an indication of variability in the variance of the response variable too. That this is the case here is confirmed by a simple heteroskedasticity test, which easily rejects the null of constant variance (chi-square (1) from Breusch and Pagan test: 7.73). The presence of missing data is addressed through multiple imputation, using Amelia II (King et al., Reference King, Honaker, Joseph and Scheve2001). Five complete datasets are constructed and, accordingly, the coefficients presented in the following section are the average values of the results produced with each dataset. Standard errors consist of the average figures from these separate analyses plus the variability of the coefficients across these datasets.Footnote 4
Results
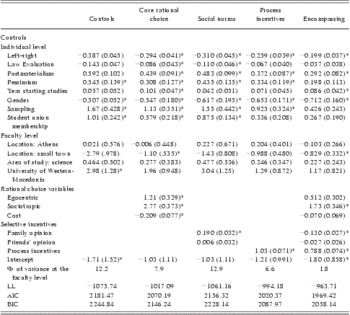
With all this in mind, we proceed to the findings. Table 2 shows the impact of all key factors on individual protest activity. Column 1 includes only the individual-level and faculty-level control variables. Ideology emerges as a key predictor of protest activity. A point move towards the right decreases the likelihood of taking part in the movement by almost 0.4 points in a 0–10 scale. This effect declines by half when all constituent parts of the extended rational choice model are included in an encompassing model, as shown in the last column of Table 2. The direct link between ideology and activism confirms the logic that led to the inclusion of this variable, namely that politics is an inherent element in Greek higher education and inevitably marks attitudes towards issues surrounding university. Value priorities also seem to be a key distinguishing factor among participants and non-participants. This is hardly surprising given that, as the leading student activists made clear, the protests aspired to the ideas and principles of the anti-globalization movement, which implied that reactions against the bill should coincide with post-modern thinking about political and social needs.
Random intercept models of student protest activity

LL = log-likelihood; AIC = Akaike information criterion; BIC = Bayesian information criterion; ML = maximum likelihood.
Note: entries are ML coefficients, standard errors in parentheses, LL, AIC and BIC calculated with ML, coefficients, standard errors and the variance of the constant are calculated with restricted ML. 505 students nested within 12 faculties, departments or universities. *P < 0.05 or lower.
The results are far more ambiguous about respondents’ evaluations of the draft bill. Although the effects always point in the right direction, they fail to achieve statistical significance when process incentives are included in the model. We come back to this finding when we discuss the indirect impact of these incentives in students’ more general considerations about their participation in protest activity. Grievances are also important, denoting that taking part in protest activities may also be the result of a more generic and persistent lack of trust towards political attempts to reform the existing system of higher education in Greece. That said, most of this effect evaporates in the encompassing model, combining Equations (1) and (3), as shown in the last column of the table.
Furthermore, the dummy denoting the sampling method from which the observations are taken performs as expected: the respondent-driven sampling students are significantly more likely to participate more forcefully in the protests than students sampled from the classrooms. That said, this gap gradually decreases as we move from Equation 1 to Equation 3, and even fails to achieve statistical significance at conventional levels in the last column of the table. Discipline and location characteristics seem to have no statistically significant effect on the dependent variable, whereas for the case of gender and year of study the evidence is more ambiguous: there seems to be a remarkable gender gap that retains its magnitude despite the inclusion of various other covariates. With regard to the year of study, the signs and the relatively larger z-values for the last two seem to suggest that male students and those beginning their studies are more likely to take part in protest activity, although the results fail, in almost all cases, to attain statistical significance. Last but not least, the high mean participation level of the Faculty of Humanities from the University of Western Macedonia loses its significance when process incentives are added to the estimation (columns 3 and 5). Finally, as expected given the partisan connotations of student union membership in Greek universities, mobilization forces also played an important role in this movement: being a member of a students’ union is likely to induce participation, a relationship that does not, however, remain robust when a fully specified model is estimated.
We now come to the core rational choice model. As shown in the second column of Table 2, which displays the results from the cost–benefit equation, all three variables seem to exert an important influence on students’ protest activity. Seen either in sociotropic or egocentric terms, the benefit from achieving the collective goal, weighted by the probability of making an effective contribution, provides a vital motivation to participate in protest activity. Furthermore, concerns about the possibility that other students will suffer the consequences of the law seem to be more important than fears about one's own future under the new regulations. This is a first indication that the core rational choice model needs to be complemented by other influences (Opp, Reference Opp1999; Finkel, Reference Finkel2008). The third column further points to this argument, since it shows that social sanctions, at least as evoked by the close family environment, contribute to our explanation of the motives behind protest participation. Rather surprisingly, ‘significant others’ were not decisive in the decision individuals took regarding the most costly modes of protesting. Nevertheless, it is still informative to note that, when engaging in activities that do not meet parental approval, participation is, on average, limited to lower levels of protest activity.
The next column in Table 2 presents the results for the impact of process incentives. The magnitude of the effects is remarkable, indicating that a unit increase in a 0–5 point scale increases the amount of protest activity by almost one point in a 0–10 scale. Taking part in social protest has always had an entertainment value, as Tullock (Reference Tullock1971) first pointed out. The significant role of process incentives has also been confirmed both by systematic survey-based studies (Klandermans, Reference Klandermans1984; Muller and Opp, Reference Muller and Opp1986; Muller et al., Reference Muller, Dietz and Finkel1991; Finkel and Muller, Reference Finkel and Muller1998) and anecdotal evidence drawn from historical accounts (e.g. Chong, Reference Chong1991; Oberschall, Reference Oberschall1993; Lieberman, Reference Lieberman2004; Teune, Reference Teune2007). It seems that Greek students are no exception. Among the competing models, all model fit statistics shown at the bottom of the table indicate that the best performing is the model containing the process incentives variable. To be sure, the LR test is not the appropriate measure when non-nested models are compared. Nevertheless, when each model is compared with the empty model (which is always nested), the difference between the two maximized restricted log likelihoods is larger for the model containing process incentives. Both information criteria that are shown in the last rows of Table 2, and which account for the different number of parameters estimated in each model by introducing a penalty for each additional parameter to be estimated [Bayesian information criterion (BIC) does so more than Akaike information criterion (AIC)], suggest that the ‘process incentives’ model fits the data best. In fact, when this important indicator is included, the impact of other variables, such as ‘cost’ and evaluations of the law becomes statistically indistinguishable from zero.
Moreover, the inclusion of this term has two important implications for the other parameters of the model. First, with the exception of ‘year’ and ‘gender’ all other covariates lose a large part of their explanatory power. All coefficients attached to the control variables in the first column decrease substantially when the composite process incentives are included in the equation. Second, given that the inclusion of such a good predictor of protest activity captures a significant part of the unexplained variance, there is less non-systematic error left in the dependent variable. This is why the standard errors of all control variables are also much smaller than in the first column. This implies that the addition of process incentives makes the estimates for the effect of the other variables more precise (Angrist and Pischke, Reference Angrist and Pischke2009: 23–24).
Before we move to look at the mediating effect of process incentives on protest activity, we need to examine whether our results are driven by a particular second-level unit. The lower part of Table 2 shows the level of inter-faculty variation as a percentage of the total variation in the dependent variable. Again, including process incentives seems to account for a significant part of this variation. Figure 1 displays the point estimates and their associated 95% confidence intervals for the three key factors of the three models tested in Table 1: sociotropic benefits (core rational choice); family opinion (social norms); and the process incentives measure. The numeration shown in the vertical axis follows the numeration of the first column of Table 1. This means that from each of these analyses respondents from the faculty that is denoted in the y-axis have been dropped. For instance, the results when students from the University of Macedonia, the second-level unit with the highest number of respondents, are excluded from the analysis appear under the label ‘5’ in the y-axis. All estimates are sorted according to the magnitude of the point estimates, that is, from lower to higher coefficients. As may be seen, there is hardly any variation in the effects with the slight exception of process incentives, the effect of which increases quite remarkably when students from the University of Macedonia are excluded, but all other estimates are indistinguishable from those reported in Table 2. To facilitate the comparison, the graphs also include the coefficients and the confidence intervals from the analysis that includes all faculties. As shown, the overall effects (denoted by the label ‘All’ in the y-axis) remain unaffected by the exclusion of single second-level units. There is no instance in which either of the three terms registers a significant increase or decrease as a result of dropping a single faculty from the estimation.
Examining the sensitivity of the estimates for the key variables by successively excluding one faculty from the analysis.Note: The first graph depicts the point estimates (black dots) and their accompanying 95% confidence bands (grey horizontal spikes) for the process incentives scale. The second and third graphs show the equivalent results for the ‘sociotropic’ and ‘family opinion’ variables. The numeration of the y axes follows the numeration of second-level units shown in the first and second column of Table 1.

The indirect effects of process incentives
The next and most important step in the analysis involves the exploration of the way in which process incentives might qualify the original cost–benefit decision-making process. The potential gains acquired by the act of participation enter into the individual's expected utility function as an additive exogenous factor. Given its hypothesized positive effect, this term serves to explain the final decision to take part in collective action. However, it remains unknown whether and how this largely psychological factor affects the decision-making process of receivers. Does it also cause variation in the importance of costs and/or perceived benefits?
There are two, mutually exclusive, ways in which process incentives can affect GBi, PGi, and/or pi. By examining which is most prevalent, we gain an important insight into the underlying motivations of protest activity and the role of process incentives in this decision. We focus first on GBi and PGi although the justification for the effect of this variable on pi is directly analogous. To begin with, the enjoyment associated with being involved may be seen as the ultimate criterion for one's decision to participate. This means that for those students who enjoy going to demonstrations, staying in an occupied university, and participating in activities organized by protesters, the acquisition of the public good ceases to be a relevant issue. They simply take part because they receive process benefits unrelated to the final outcome regarding the public good, seeing the means as the ends (Lichbach, Reference Lichbach1996: 110–111). If this is the case, we should observe a monotonically decreasing impact of either sociotropic or egocentric concerns regarding the acquisition of the public good as people perceive more and more benefits from the act of protesting as such.
Alternatively, the presence of process incentives might simply be the initial consideration for most participants. Regardless of the importance of the public good, people may not get involved in collective activities unless they perceive some gains from these actions. This means that for those for whom protest does not provide such benefits, participation becomes unlikely, regardless of the importance attributed to the acquisition of the collective good. If this expectation holds, we should observe a monotonic increase in the importance of either egocentric or sociotropic concerns regarding the bill, as people enjoy the repertoire of activities associated with the students’ movement more. In other words, perceiving such process benefits is a first stage precondition for taking part in the movement. The final decision (and to what extent) to do so would then depend on further concerns about the importance of the collective good. Therefore, for people who generally perceive such process benefits, their degree of involvement will depend more on the cause itself.
The logic regarding the pi factor is analogous. If taking part in demonstrations and sit-ins is more entertaining than other possible activities, the perceived importance of one's own participation for the overall outcome ceases to be a relevant concern. Students who enjoy this process would take part regardless of the number of other participants and the perceived importance of their own participation. This is highly unlikely, however, for two reasons. First, because there is no evidence that the activities associated with protesting are perceived as more entertaining than available alternatives (Lichbach, Reference Lichbach1996: 123) and second, because process incentives are contingent on collective action itself (Chong, Reference Chong1991: 90–91). Protesting alone can hardly be considered entertaining. Conversely, if process incentives are not the ultimate criterion but a precondition for the further elaboration of the idea of getting involved in protest activities, the perceived significance of one's own participation should become a more important concern for the final decision to participate for students who are more certain that, if nothing else, they will not become engaged in an unpleasant activity.
The way in which process incentives might qualify the importance of costs related to the process of engaging in protest is more straightforward. First, it could simply make issues related to wasting of time or the potential implications of taking part in partly illegal activities less relevant, that is, people perceive these inconveniences but attach less importance to them in their decision to participate. This does not mean that the original participation costs are per se minimized. It only implies that they lose their importance in terms of how they affect people's decisions to take part in protest activities. Chong (Reference Chong1991: 83–84) offers an illustrative example in this respect: when considering the position of the secretary in the organization, an NAACP activist calculated the extra cost of relocating himself and his wife to New York against ‘working side by side with the most exciting civil rights leader of the day’. On the contrary, if process incentives are a necessary condition for further elaborating the potential costs of this enterprise, PC should gradually acquire more significance as people begin to perceive entertainment benefits from this process. This is because participants will be more likely to see costs as benefits when they ‘relish the spirit of sacrifice and see themselves as martyrs, national liberators, popular heroes, and guardians of their group's interest’ (Lichbach, Reference Lichbach1996: 111).
The examination of these contrasting hypotheses entails the interaction of process incentives with each of the key terms of Equation (1). What is of interest here is how the coefficient measuring the effect of other potential considerations varies according to the extent to which participants perceive process benefits as stemming from their protest activity. The results regarding the core rational choice model are illustrated graphically in Figure 2. We refrain from presenting the full results of each interaction model in tables in order to save space. The pattern of interest is captured effectively by simply plotting the marginal effect of the rational choice terms along the process incentives scale. Interestingly, process incentives do not simply cancel out the cost–benefit logic of students’ decision-making processes. To be sure, the drastic drop in the magnitude of all coefficients associated with the core rational choice model when this factor is introduced, as shown in Table 2, indicates that this is indeed one of the effects. What Figure 2 shows, however, is that this is not the only effect. Additionally, perceiving the whole participation process as a pleasant experience causes important changes in the values attached to each of the terms of Equation (1). With the single exception of perceived costs, whose impact seems to drop slightly as people perceive more benefits from the act of involvement but never achieve statistical significance along the entertainment scale, all process incentives behave as a first stage precondition for the final decision to participate. In the absence of these perceived benefits, further considerations about the importance of the public good and the perceived efficacy of individual involvement lose their importance. This is also the case for perceived cost, although in this case, the effect does not seem to exert a statistically significant (negative) effect even at the lowest levels of process incentives. Taken as a whole, however, the findings clearly speak in favour of the hypothesis that process incentives work as a first-stage condition in the decision to take part in the movement.
The marginal effect of all variables included in the core rational choice model on protest activity, conditional on students’ perceived incentives stemming from the act of taking part in the movement.Note: The solid line denotes the marginal effect across the process incentives scale, whereas the dashed curves represent the 95% confidence bands of these point estimates.

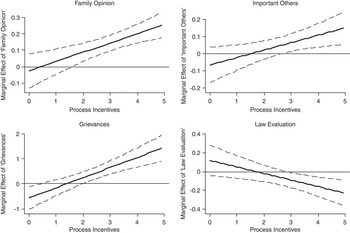
This conclusion is further corroborated when we broaden the list of participation predictors by looking at the interaction between process incentives on the one hand and social norms, pessimism (or grievances), and evaluation of the law on the other. In the first case, the two upper graphs in Figure 3 show that the agreement of important others is an important condition for taking part, but only if one has already perceived some socialization benefits to be attached to personal involvement. If this is not the case, the effect of the family is marginal. Interestingly, what appeared as a null marginal effect for ‘important others’ conceals a great deal of heterogeneity in this effect, accounted for by using process incentives as a mediator. The same conclusions are also drawn for pessimism and evaluations of the law. Both matter but determine participation only among those who perceive some gains stemming from their participation in the movement.
The marginal effect of social norms, law evaluations and grievances on protest activity, conditional on students’ perceived incentives stemming from the act of taking part in the movement.Note: The solid line denotes the marginal effect across the process incentives scale, whereas the dashed curves represent the 95% confidence bands of these point estimates.

Sensitivity analysis
Before we move to the theoretical implications of our findings for the study of protest activity, we need to address an important competing interpretation of the pattern found in Figures 2 and 3. The marginal effects plotted in these graphs stem from the interaction of process incentives with each of the other terms forming part of the other models examined in Table 2. The interaction term in these estimations can only tell us whether the average level of participation increases as the two constituent terms that form the interaction term jointly go up. This is always the case with interaction models. What this means is that it is theory that will dictate which of these terms is to be interpreted as the mediator, qualifying the marginal effect of the other constituent term. Here, we have been focusing on the role of process incentives, looking at their mediating effect on the impact of other predictors of protest activity. Our theoretical argumentation allowed us to distinguish between two different mechanisms through which process incentives may be linked to the core rational choice model. The presence of process incentives may either suppress or boost the impact of egocentric or sociotropic considerations – just to mention two examples from the graphs. We found that it largely does the first. However, this interpretation does not exclude the possibility that things are actually the other way around: instead of conditioning the impact of the core rational choice model, the effect of process incentives may be in turn conditioned by the presence of egocentric or sociotropic concerns. If that were the case, we could still observe a significant interaction effect between the variables shown on the two axes of the graphs. Indeed, based only on the regression results reported in the graphs, we cannot distinguish between these two competing hypotheses. Is it that it is mainly process incentives that operate as mediators for the other variables, or is it that the presence of egocentric or sociotropic concerns is also a precondition for the importance of process incentives? To address this question we need to relax the linearity assumption imposed in all our estimations thus far. What is needed is to compare the effect of process incentives for individuals who score high for the rational choice variables and for those who score low. We then need to evaluate the observed pattern by comparing it with its mirror image: the effect of rational choice or social norms indicators for low and high levels of process incentives.
Figure 4 displays the results. Each graph comprises two local regression lines (loess), which trace the mean response locally, making only minimal assumptions about how the focal variable affects the outcome of interest (in our case protest activity). In each graph the solid line denotes respondents whose score for the variable performing as mediator is above the median. The dashed line denotes respondents with scores below the median. The graph should be read as follows. The first and third row depict the relationship between process incentives and protest involvement, distinguishing between two groups with low (below median) and high (above median) values for the variable that is mentioned next to each line. For instance, in the first graph we see how mean participation rates vary across the process incentives scale for those with low and high values for ‘sociotropic benefit’. If it were the case that sociotropic concerns operate as a mediator for the effect of process incentives, we should observe some notable gap in terms of average levels and, most importantly, a difference in the slope of the two monotonic lines. What we see, however, is that the two lines run in parallel and very close to one another. Clearly, once we know the individuals’ scores for the process incentives scale, knowledge on sociotropic concerns adds little to our ability to predict the level of protest activity. The second and the fourth rows display the mirror image of the graphs in rows 1 and 3. They show how the other variables included in Figures 2 and 3 affect participation, distinguishing between two groups: those with low (below median) levels of process incentives and those with high (above median) levels of process incentives. The idea is to compare each graph of row 1 with its equivalent immediately below, in row 2. The same comparison is made between the graphs in row 3 and row 4. For instance, having examined how the impact of process incentives is qualified by one's level of sociotropic concerns in the first graph of row 1, we turn to the first graph of row 2, which presents the effect of sociotropic benefit on protest participation for people with low and high levels of process incentives. Here, the pattern is straightforward. Sociotropic concerns appear to matter, but only for those scoring highly on the process incentives scale.
Disentangling the interactive relationship between process incentives and other determinants of protest activity.Note: All lines represent local regression curves (loess estimates), for two groups of students: those with high values (above median) in the variable that is treated as the mediator and those with low values (below median) in the same variable. Each graph of rows 1 and 3 needs to be compared with the graph that is in the same column and one row below. Rows 1 and 3 present the effect of process incentives protest activity conditional on where respondents stand in the other variables and rows 2 and 4 present the effect of all other variables conditional on respondents’ values in the scale measuring process incentives. With the exception of protest activity, all variables have been recoded to range from 0 to 5.

The overall pattern emerging from Figure 4 is quite telling. Looking at the graphs of rows 1 and 3 we see that other factors, either those encompassed within the rational choice model or those employed in the estimation as controls, do little to condition the effect of process incentives on protest activity. The two lines are always very similar, and more often than not very close to each other. Contrast these findings with those presented in the second and fourth rows of Figure 4. For people who score above average in the process incentives scale, sociotropic and egocentric concerns as well as perceptions of one's ability to influence the overall outcome (row 2) influence the mean participation level noticeably. For those who do not see such incentives as stemming from the act of taking part in the movement, however, the effect of these factors is much lower and remains so along the x-axis (the range of values in the two rational choice scales). The same conclusion is drawn if we look at the role of evaluations of the law, grievances, and social norms (row 4). These graphs confirm the interpretation of the findings from Figures 2 and 3, even when no parametric assumption is made in the attempt to disentangle these relationships. All these results point to a significant conditional effect of process incentives on the impact of rational choice concerns and other important factors in protest involvement. The only exception is the variable denoting the perceived cost of taking part in the protests. Although cost does not qualify as an effect of process incentives, in this case process incentives do not seem to change the impact of this variable on mean participation either. That said, we still find a downward trend among people with high process incentives, confirming the idea that cost matters, even marginally, only for those who also perceive some gains from getting involved in the students’ movement.
Conclusions
Rational choice theory has often been employed in order to explain the occurrence of political protest. In order to overcome the paradox of non-participation presented by the problem of free-riding, researchers have typically expanded the reasoning of core rationality to include what is now known as selective incentives. For protest activity, research has often used process incentives, in other words incentives that are related to the act of protesting itself. In this paper, we examined the role of process incentives associated with entertainment, solidarity, and identity. We explored whether the gains expected from the act of protesting influence an individual's decision to take part in protest activities and examined the extent to which process incentives qualify the weight individuals attach to the primary elements of the original cost–benefit equation of rational choice theory, as well as other considerations potentially crucial for their decision-making process. Drawing on original data collected during a period of university student protest in Greece, we showed that the magnitude of the effect of such process incentives is very strong and its inclusion in a rational choice model substantially improves our understanding of students’ participation in protest activities. Turning to indirect effects, we showed that process incentives behave as a first stage precondition for students’ decisions to protest. In the absence of the perceived benefits associated with the process of protesting, the importance of attaining the public good, the students’ perceived efficacy, the opinions of their family, friends and significant others, and the issues related to the primary reason of protesting become much less important.
Although from a particular study, the implications of our findings are in principle transferable to various instances of protest activity. Social movements are typically associated with a general sentiment shared among participants that something really important is underway, and when this is the case, it always feels good to be part of it. To be sure, the extent to which this sentiment qualifies students’ concerns about the benefits stemming from the act of protesting remains an empirical question. However, the evidence presented here provide a first rigorous attempt to reconsider the role of selective incentives not only as additive engines of participation but as underlying factors that condition the original calculus of people's decision-making processes. This should not be surprising if one considers the ‘marketing’ aspects of most large-scale participatory movements. Books, songs, movies, posters, lapel pins, and other related objects serve to clarify the underlying concern: it is not only that we belong to a group that shares a common concern. It is also that this group shares more general interests and beliefs with us. Taking part thus also means finding a way of projecting ourselves within our proximate context. It is about what we think we are or want to be. Moreover, it gives the illusion of ruling space and the moment, experiencing participatory democracy and being in charge as it takes place. This is clearly the line of thinking among leftist students in Greece during every instance of protest within the university.
What do these results tell us about the motivations of Greek students involved in protest activities? Figure 5 shows the expected value of process incentives across the left-right continuum. The pattern is straightforward. Process incentives are much higher for those located at the left than those located at the right. It is for those students that the networks of the protest movement provide socialization benefits (see Jennings, Reference Jennings2002) and activities that make the whole process more entertaining. Leftist students, whether organized in a student union or not, play a prominent role in the process of occupying faculty buildings and organizing protest activities in general. They have almost full control over the types of activities organized during this period in the university. As the provision of selective (and process) incentives can be viewed as a collective action problem in itself (Oliver, Reference Oliver1980: 1361), this finding explains why some students go to the trouble of becoming more involved in protesting by organizing associated activities. It is because the anticipated payoffs from this process are substantively larger for them. In our case, non-leftist students also took part when they believed that the bill needed to be amended or fully abolished, but the idea of being entertained during protesting was not an important concern, mainly because they had much less to expect in these terms.
The relationship between left–right self-placement and the extent to which students find incentives from engaging in protest activity.Note: The solid curve denotes the local polynomial curve passing through the scatterplot between process incentives and left-right. The shaded area denotes the 95% confidence bands of the local estimates.

Acknowledgements
We need to thank Nikos Marantzidis, Lamprini Rori, Gerasimos Moschonas, and Irene Martín for their very valuable comments and suggestions at various stages of this project, as well as the editors and the anonymous reviewers of the European Political Science Review. All responsibility for errors and omissions lies with the authors. Finally, we are very thankful to the participants of our survey, without whom this research would have been impossible.
Supplementary materials
For supplementary material referred to in this article, please visit http://dx.doi.org/doi:10.1017/S1755773912000112