




No CrossRef data available.
Working Hours of the World Unite? New International Evidence of Worktime, 1870–1913
Published online by Cambridge University Press: 31 January 2005
Abstract
This article constructs new measures of worktime for Europe, North America, and Australia, 1870–1913. Great Britain began with the shortest work year and Belgium the longest. By 1913 certain continental countries approached British worktimes, and, consistent with recent findings on real wages, annual hours in Old and New Worlds had converged. Although globalization did not lead to a race to the bottom of worktimes, there is only partial evidence of a race to the top. National work routines, the outcome of different legal, labor, and political histories, mediated relations between hours and income.
Information
- Type
- ARTICLES
- Information
- Copyright
- © 2004 The Economic History Association
In a series of influential articles and books, Jeffrey G. Williamson and his coauthors have forcefully argued that the integration of labor markets across New and Old Worlds was a salient feature of the first modern wave of globalization before 1913.1
See, for example, Williamson, “Evolution”; Hatton and Williamson, Mass Migration, pp. 249–52; and O'Rourke and Williamson, Globalization and History, pp. 5–11.
For a concise statement of the textbook model, see Rees, Economics of Work, p. 26; Phelps Brown and Browne, “Hours of Work”; and Brown, “Labor Standards,” p. 91. Voth, (Time and Work, p. 255) wrote: “… GDP per capita alone explains a high proportion of changes in time allocation.” For a formal model of convergence in work conditions because of rising income levels in poorer countries, see Casella, “Free Trade.”
The problem with this view is that it does not correspond to the available evidence. Richer countries did not always work less than poorer ones. In 1900 annual workhours in France stood at 3,000, about 300 more than in Italy whose income per head was roughly 50 percent less.3
Decouflé and Svendsen, “Une histoire,” p. 65; and Zamagni, History of Italy, pp. 201–05. The estimate for Italy assumes 270 days of work per year and ten hours per day.
Matthews, Feinstein, and Odling-Smee, British Growth, p. 566; and Atack, Bateman, and Margo, “Productivity in Manufacturing,” p. 16.
Labor economists and labor historians have suggested a number of explanations for the puzzling evolution of worktime before World War I. As today, workers and firms tended to sort themselves over a range of work schedules, and the failure of observed hours to have adjusted may be the result of compositional effects. That said, the sorting mechanism, which required some form of collective-decision making, was biased toward long and stable hours. Although employees may have had different tastes for time on the job and leisure, they all welcomed higher earnings. Unions thus preferred to negotiate wage increases, a practice the historian of British hours, M. A. Bienefield, invoked to explain the stability of worktimes.5
Bienefeld, Working Hours, pp. 215–22.
The classic statement on the spread of payment by results is Schloss, Industrial Remuneration.
Even Lancashire workers refused to support legislated reductions in worktime because they feared international competition. See Fowler, Lancashire Cotton, pp. 60–61.
Cross, Quest for Time, pp. 233–34.
Kessler-Harris, Women's Wage.
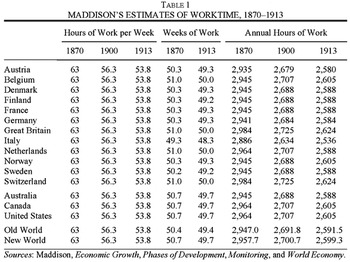
This article's contribution to the literature on worktime is mainly empirical. The available national series of worktime are often too fragile or too unreliable to test accurately the global labor market view. Not only do standards and units of time at work vary across countries, but errors in measurement are compounded because national estimates are often based on a single sector of activity, if not a single firm. Angus Maddison has constructed a comparative international data set of worktime, but he assumed that workers everywhere in the period before 1913 toiled as long as the British. Maddison's approach creates its own set of problems—not the least its inference of convergence. To avoid reproducing this pitfall, I construct revised estimates of annual worktimes from two unexploited sources. For 14 Old and New World countries, I have found measures of workdays from the reports of British trade offices, and calculate estimates of hours of work per week from a comprehensive study by the U.S. Department of Labor. Despite its flaws, my new series is superior to previous estimates in addressing comparative changes in worktimes.
The revised estimates cast new light on levels and changes in worktime within and across continents. In 1870 Britons worked less than other Europeans, but by World War I Scandinavian and some western European countries had practically “caught-up” to British levels. Across the oceans, the New World tended to work more days and shorter workweeks in 1870 than the Old World, but the gap in annual hours had disappeared by 1913. These results give comfort to the global labor market school. Still, it would be difficult to conclude that working hours experienced a race to the top. For the entire sample of countries there is little evidence of convergence because, owing to different legal, labor, and political histories, the relation between hours and income varied considerably. Countries kept to their own work schedules. Even in the heyday of economic integration, borders did matter.
WORKING TIME BEFORE 1813: MADDISON'S FIGURES
As a preliminary step in estimating employment and productivity measures for a group of OECD countries, Angus Maddison assembled an international data set on worktime that has become a point of reference in studies of convergence and in the new growth literature.10
Maddison's original calculations are in Economic Growth, pp. 225–29. This is the reference cited in his later publications: Phases of Development, “Growth and Slowdown,” Monitoring, and World Economy. Maddison's international series is the standard source in the new growth literature. See, among others, Barro and Sala-i-Martin, Economic Growth; and Broadberry, Productivity Race.
Because of the uncertainty surrounding these [hours of work] rather arbitrary figures, we have assumed that the movement in working hours from 1870 to 1913 was the same in all our countries [Western Europe and North America]. This is probably a reasonable assumption.11
Maddison, Economic Growth, p. 225.

With regard to the number of weeks worked, Maddison assumed that all countries before 1913 had the same number of public holidays as in 1950 and that there were no annual vacations in 1870. For 1913 he assumed one week's vacation across the board.12
Ibid., p. 229.
At first pass, Table 1 appears to be an inappropriate starting point to compare labor market outcomes across countries. That said, can Maddison's underlying assumptions be justified? The answer is no. Since the publication of his estimates almost 40 years ago, labor and social historians have established the diversity of national work practices. Still, the relevant question is whether a new international worktime series would alter in any significant way our assessment of labor's experience and welfare before 1913. My answer is decidedly yes.
REVISED ESTIMATES OF WORKTIME: THE COMPONENTS
The Length of the Workweek
The Fifteenth Annual Report of the U.S. Department of Labor, under the supervision of Carroll Wright, published data on weekly workhours for the period 1850 to 1900.13
U.S. Department of Labor, Fifteenth Annual Report. Although the terminal year for non-U.S. data is in fact 1899, in the text and tables I use 1900. The Appendix gives a sample of the sources consulted in assembling the report. The citation in this paragraph is from page 12 of the report.
I discuss the French case below.
Atack and Bateman, “How Long was the Workday,” pp. 803–04. I benefited from discussions with William Sundstrom on the reliability of the U.S. reports.
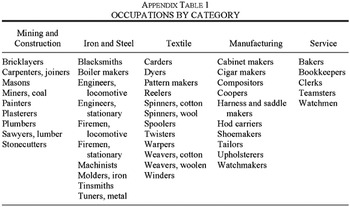
The department presented its results by individual occupations that I grouped into five categories or sectors defined in the Appendix. The classification serves two goals. Although heterogeneous in their composition, fixed capital investments varied across categories: iron and steel, and mining and construction being the most capital intensive; services and textiles the least. The occupational breakdown also reflected my objective to account for the effects of international forces on workhours. As designed, the textile sector comprises the most highly traded goods, followed by manufacturing, iron and steel, mining and construction, and services.16
The categorization by fixed capital and tradeables is meant to be suggestive. As defined, the manufacturing sector was heterogeneous in its capital stock and comprised some internationally traded goods. Coal and some iron and steel products were also traded internationally.
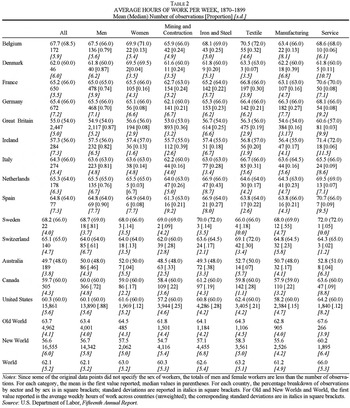
Table 2 gives some basic descriptive statistics of the data broken down by sex, sector, and country. The compilation is heavily weighted toward the United States, and, to a lesser extent, Great Britain. Of the 5,000 or so European observations, about 55 percent are from Britain and 15 percent from Germany and France each. The survey's breakdown by sector is roughly similar across countries (services account for between 5 and 8 percent of observations, and textile and manufacturing together about 45 to 50 percent). I also report mean and median workhours; they do not deviate greatly from each other. Where summer and winter hours were reported, I took the average of the two.17
Bienefeld (Working Hours, p. 142) surmised that in Britain winter hours were worked four months a year, implying that my procedure is biased against finding long hours.

The workday during the so-called second industrial revolution was strenuous, up to 12 or more hours per day, in most sectors and countries.18
Based on other accounts of the workday, I assume that reported hours were net of meal and rest times. Even if rest time has not been deducted entirely, there is a potential bias in the other direction. The report contains no mention of overtime hours. Contemporary sources indicate that at certain times of the year these may not have been negligible. Because of these opposing biases, I have left the initial series unadjusted. On these issues, see: Cross, Quest for Time, pp. 67, 234; Gårdlund, Industrialismens, p. 312; Heikkinen, Labour and the Market, pp. 154–56; Kaplow, “Saint-Lundi”; Pollard, “Labour in Britain,” pp. 157–58; Rist, La réglementation légale, pp. 177–88; and Rosenband, Papermaking, p. 108. Lars Svensson recommended the Swedish sources used in this article and kindly provided the translation.
Vandervelde, Belgique ouvrière, p. 38. The workday in Sweden also began early and was punctuated by three or more pauses. Workers may have preferred to be in a warm factory than in their dark and cold homes. See Gårdlund, Industrialismens, pp. 312–14. On the implications of long workdays on sleep patterns, see Ekhirch, “Sleep.”
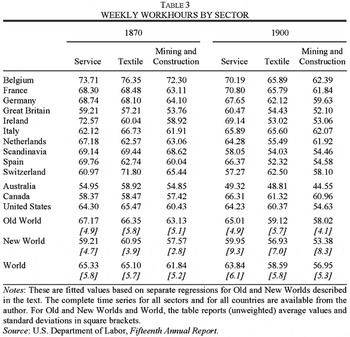
In 1850 Lancashire workers stopped at 2:00 PM on Saturdays; from 1875 until 1905, the day ended at 1:00 PM. Fowler, Lancashire Cotton, p. 65. These hour changes are consistent with the series reported in Table 3.

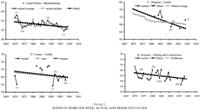
The evaluation of time trends is not straightforward because observations by sector are spread unevenly across countries over the period. Figure 1 gives some idea of the unbalanced nature of the data set. For British manufacturing data are available annually, but observations for Belgian and French textiles are clustered at the end of the period, and those for German mining and construction in the early years. Calculating three- or five-year averages is one approach to solving the problem of missing observations. But this procedure is unsatisfactory because of the small number of observations in certain years. In effect, this assumes stationarity. I used the alternative strategy of fitting a time trend that controls for the likelihood of nonstationarity. Exploiting all the information contained in the reports, I estimated “fitted” values of workhours by country and by sector from 1870 to 1900. I separated Old and New World countries because specification tests indicated differences in the estimated coefficients in the two regions. Imposing restrictions improved the efficiency of the estimator.21
The division between regions meshes with contemporaries' statements. French textile workers voiced concern that the daily cross-border movement of Belgium workers thwarted their attempts to reduce workhours. Similarly, Canadian workers moved freely to the United States. As for Australia, it was connected, albeit indirectly, to North American labor-market developments because it was an alternative destination for British emigrants. On Belgian workers in France, see Strikwerda, “France and Belgium”; for North American labor-market integration, see Green, MacKinnon, and Minns, “Dominion or Republic”; on the New World connection, see Hatton and Williamson, Mass Migration, p. 54.

HOURS OF WORK PER WEEK: ACTUAL AND PREDICTED VALUES
More formally, for Old and New Worlds individual observations on weekly workhours in country i, sector j, and in year k, were regressed on indicator variables for sex, country, sector, and year, and three sets of interaction terms, country and sector, country and year, and sector and year. I experimented with interaction terms for sex in order to derive women's workhours by sector and year, but there was very little difference in the trend and levels of worktime for women and men.22
To illustrate, panel b in Figure 1 gives the fitted values for female and male workers in French textiles based on a regression with interaction terms between sex and time, sex and country, and sex and sector. The finding of little difference between women's and men's worktime implies that legislation intended to constrain the hours worked by the former also limited the latter's. This gives support to the frequent claim that men fought the battle for a shorter day “from behind women's petticoats.”
To arrive at a U.S. national average, the regions were weighted by their share of the population in 1900. Source: United States, Historical Statistics, A195, pp. 24–36.
Figure 1 traces the fitted values from this procedure for some sectors for certain countries. The estimated values for Belgium textiles follow closely the average workhours F.-X. Van Houtte estimated for a sample of Ghent cotton textile firms, whereas the estimated values for German mining and construction correspond with the figures Walter Hoffmann gave for certain years.24
For Belgium, see also Scholliers, Wages, Manufacturers, p. 130.
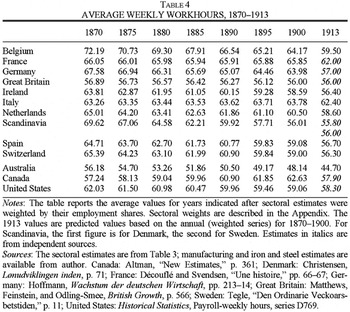
I next estimated the average length of the workweek by country on an annual basis using the fitted sectoral values. The employment weights used in this procedure are given in the Appendix; to save space Table 4 reports the actual values at five-year intervals. As calculated, the national series reflect the importance of the service sector in most economies in the sample, but, all told, differences between the weighted and unweighted national averages are not very great. Independent sources confirm my calculations. Although the Italian numbers are slightly higher than reported elsewhere, for eight countries (Australia, Belgium, Canada, France, Germany, Great Britain, the Netherlands, and the United States) the figures in the table correspond closely with other, albeit scattered estimates.25
Australia: ILO, “Labour in Australia,” p. 1020; Belgium: Neuville, Évolution des relations industrielles, pp. 61–87; Rowntree, Diminuer la misère, pp. 574–76. Canada: Altman, “New Estimates,” p. 361; France: Marchand and Thélot, Travail en France, p. 145; Germany: Hoffmann, Wachstum der deutschen Wirtschaft, pp. 213–14; Great Britain: Bienefeld, Working Hours; Matthews, Feinstein, and Odling-Smee, British Growth, pp. 64–70, 566; Italy: Zamagni, History of Italy, pp. 201–05; Netherlands: Wintle, History of the Netherlands, p. 66; United States: Atack and Bateman, “How Long was the Workday,” p. 139; and Costa, “Wage and Length,” p. 58.
Christensen, Lønudviklingen inden, p. 71. I would like to thank Gunnar Persson for helping with the translation. Christensen's figures are slightly less than those of a contemporary study of Copenhagen in the early 1890s that reported “89 percent of all factories had a working day of ten-and-a-half hours or less, whereas in the provinces a large number of establishments visited worked 11 hours or more.” UK PP 1893–94 vol. 39, Part 2, p. 780. For Sweden, ibid., pp. 778–79; and Tegle, “Den Ordinarie Veckoarsbetstiden,” p. 11.
I prefer to use independent estimates (in italics) for 1913 wherever possible because the introduction of hours legislation in some countries after 1900 makes it hazardous to extrapolate from 1870–1900 time trends. That said, the predicted values for France, Great Britain, and the United States are very close to the independent estimates I use.

Trends in weekly workhours varied considerably across countries. Australia, Belgium, Germany, Ireland, Scandinavia, Spain, and Switzerland exhibited contractions in hours of more than 10 percent; France, the Netherlands, and the United States had more modest declines; Britain and Italy showed no trend, while for Canada time at work actually increased over the period. Comparisons between and within Old and New Worlds are ambiguous. On the one hand, the gap between Australia, “a sellers' labor market” and Italy, where the “elasticity of unskilled labor was very high, if not infinite,” widened over the period.28
The quote for Australia is from Butlin, Australian Economic Development, p. 391; for Italy, Cohen and Federico, Italian Economy, p. 61.
The Length of the Work Year
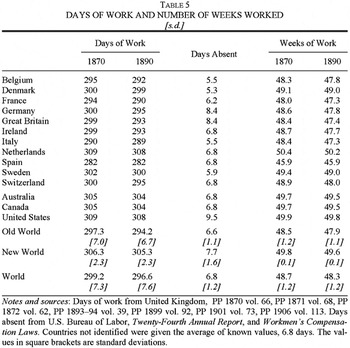
In 1870 the British trade office began collecting information on working conditions around the world in order to verify manufacturers' claims that longer hours abroad were a source of competitive advantage. The reports of the consular delegates, submitted under various guises into the early twentieth century, provide enough information to generate the series of workdays in 1870 and 1890 found in columns 1 and 2 of Table 5.29
United Kingdom, PP 1870 vol. 66, PP 1871 vol. 68, PP 1872 vol. 62. The consular reports were superseded by the Abstract of Foreign Labour Statistics and the Commission on Labour, Foreign Reports, published occasionally before the First World War. PP 1893–94 vol. 39, PP 1899 vol. 92, PP 1901 vol. 73, PP 1906 vol. 113. Jeffrey Williamson suggested this source.
On the decline of seasonal work patterns for the United States, see Atack, Bateman, and Margo, “Part-Year Operation.” They report that in 1870 and 1880 a majority of establishments operated on a full-time basis and speculate that the number was increasing; nonetheless, part-time operation was still common. For France, see Bompard, Magnac, and Postel-Vinay, “Emploi, mobilité.”
In their calculation of worktime in the United States, Atack, Bateman, and Margo (“Productivity in Manufacturing,” p. 172) used 309 days of work; Rosenbloom (“Male Labour Supply”) assumed 306 days of work in 1880. The International Labour Organization began to collect data on days of work in the 1920s that are consistent with the evidence from the consular reports for 1890. ILO, “Legislation on Annual Holidays.”

The length of the work year was much longer in the New World. In some regions of Europe religious festivals were still common. For Russia, the consular delegate observed:
… [T]he number of festivals on which work is prohibited in all factories is 19, but in most cases 27 or 28 festivals are kept as holidays during the year. Thus the average number of holidays, including Sunday is 80 or even 100 days, so only 250 or 260 days are spent at work…. In Poland the number of working days is further reduced to 230 on an average, because in Russia religious festivals are observed according to the Julian calendar, while in Poland they are celebrated twice over, according to both the Gregorian and Julian calendars. Thus a Russian does at least 70 days less work during a year than a Frenchman in a similar position.32
United Kingdom, PP 1893–94 vol. 39, Part 2, p. 864.
United Kingdom, PP 1893–94 vol. 39, Part 1, pp. 12–13. I took the average value in Table 5.
United Kingdom, PP 1909 vol. 80, p. 91. Fowler, Lancashire Cotton, pp. 63–65. Ireland seems to have kept pace. O'Grada, Ireland, p. 239.
Strikwerda, House Divided, p. 262. For the “religious” origins of May Day elsewhere, see Panaccione, Memory of May Day, p. 15. In the Netherlands, Catholic and Protestant unions organized separate May Day celebrations. Harmsen and Karsten, “Le premier mai.”
There was a stronger preference to work more days in the New World. As in Europe, North American workers observed Saint Monday rituals, but Americans labored under different rules. Roy Rosenzweig found that American workers had just three to four official days off around 1870; Labor Day was the only additional holiday granted before World War I, a pattern repeated in Australia.36
Rosenzweig, Eight Hours, pp. 69–70; and Gutman, “Work Culture,” pp. 547, 570. In Australia, national public holidays replaced those of individual colonies. Separation Day, formerly a Victorian public service holiday, became a “mere bank holiday” at the end of the century. Kingston, History of Australia, p. 184.
Rodgers (Work Ethic, pp. 7–17) observed that the central premise of the American model was that “work was the core of moral life.”
Atack and his coauthors have recently studied the relationship between days at work and workhours per week for the Unites States. Because of diminishing returns using the technology in place, they argue that it was cost efficient for an employer to shorten the length of the workweek, but extend the work year. Although my data do not permit a thorough analysis of this relation for other countries, there does appear to be an inverse relationship between days at work and the workweek across the sample. Relative to Belgians, Canadians worked fewer hours per week but more days. It is not clear, however, that employers alone initiated adjustments along these margins, because if they had concerns about the diminishing returns of the long workweek they would have as easily reduced the length of breaks and pauses during the workday. It was the rare continental employer who adopted the “English working day” of one-half hour for lunch.38
Milhaud, “Unbroken Working Day,” p. 796.
My argument borrows from Hamermesh's (Workdays, Workhours) study of the choice between workdays and workweeks in the United States and Germany in the 1990s. The existence of fixed costs along a particular dimension can produce “the unusual result of large jumps in labor supply along that dimension when the worker's wage rate changes (p. 14).” Among other factors, Hamermesh identified changes in commuting times that alter the tradeoff between working fewer days or a shorter workday.
In 1900 Belgium had the most extensive network in Europe with over 325,000 commuters daily, or 10 percent of its labor force. See Mahaim, Abonnements ouvriers, pp. 204–59; Rowntree, Diminuer la mis ère, pp. 291–302; Polasky, “Transplanting.” On walking distances in Canada, see Lewis, Manufacturing Montreal, p. 146; for the United States, Liepmann, Journey to Work, pp. 64–65.
GDP calculations treat commuting times as leisure. For a discussion, see Mokyr, Gifts of Athena, p. 156.
From these estimates of days worked, I deducted the number of days absent due to illness, using information from the U.S. Department of Labor's study of health insurance.42
U.S. Department of Labor, Twenty-Fourth Annual Report and Workmen's Compensation Laws. I would like to thank John Murray for recommending these sources. See also, Varlez, “Assurance,” p. 8.
ANNUAL WORKTIME, 1870–1913
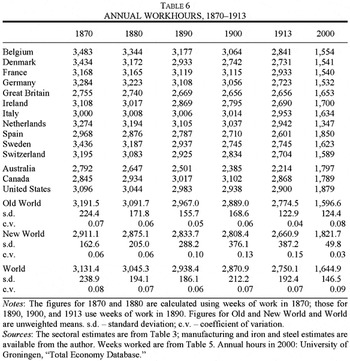
Table 6 presents estimates of annual worktime for 1870 to 1913 with comparative data for 2000. These figures can be thought of as the average annual contracted hours of work of a male employee.43
This definition is used in the literature on annual rates of absenteeism. See, Barmby, Erolani, and Treble, “Sickness Absence.”
Decouflé and Svendsen, “Une histoire,” p. 63. The U.S. figure is for full-year establishments from Atack, Bateman, and Margo, “Part-Year Operation,” p. 797. Fogel (Fourth Awakening, p. 259) estimated 3,214 hours in 1880. For Britain, see Matthews, Feinstein, and Odling-Smee, British Growth, p. 566; for Belgium, Vandermotten, “Tendences longues,” p. 97.
The gap between Australia and Denmark in 1870 (700 hours) is equivalent to that between Mexico and the Netherlands in 2000. I analyze changes in worktime over the long twentieth century in a companion paper, “Workdays, Workweeks, and Annual Hours.”
After 1870 the movement in worktime was anything but uniform. Certain European countries had caught-up to British levels by the end of the period. In 1870 Danes toiled almost 700 hours more than the British, but in 1913 the gap had collapsed to 70 hours. The decline in Britain was restricted almost exclusively to more days off, but northern and some western European countries benefited from shorter and fewer days. As a result, the variance (coefficient of variation) of annual hours for the set of European countries falls over the period, although much of the change seems have taken place after 1900 when national authorities became more active in legislating the length of the workweek. The narrowing of worktime between the Old World and North America was even more dramatic. By the end of the period, the United States was actually working longer than eight European states, thus giving a historical dimension to the claim of the “overworked American.” But the gap between Australia and Italy actually widened from 200 to 600 hours. Because of these offsetting examples, the variance for the entire set of countries was roughly stable between 1870 and the war; remarkably it was the same order of magnitude as in 2000. All together, the raw numbers suggest that, although rankings may have altered and the continental gap had disappeared by 1913, national work practices resisted any tendency toward convergence despite strong forces of economic integration.

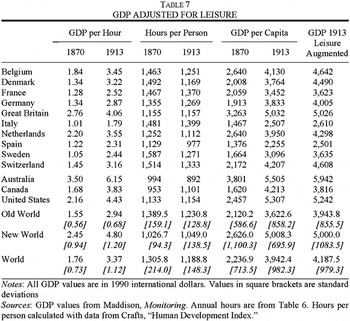
Table 7 gives another perspective on the significance of the new worktime estimates for evaluating labor market outcomes during the late nineteenth century. Maddison's assumption of common and stable worktimes across countries implies that movements in wages or per capita income capture all adjustments in well-being. But a different picture emerges if the assumption of stable workhours is dropped. It is well known that GDP per capita underestimates workers' welfare because it does not include gains to workers owing to increased leisure time. Fewer hours worked by the employed implies greater leisure, which presumably adds to workers' utility. This is not true for the unemployed or for those working fewer hours than they would like to. Still, standard neoclassical analysis suggests that adults in countries with fewer hours worked will be better off relative to those in countries with more hours worked at the same level of GDP per capita. To get an idea of how much better, I follow a standard approach and measure leisure-augmented income in period tas the sum of income in period tand the difference in hours worked between tand the base year 0, valued at the wage rate in t.46
I have followed the procedure set out in Beckerman, “Comparative Growth Rates”; and Crafts, “Human Development Index.” For comparable estimates, see Voth, “Time,” for the period before 1850; and Bell and Freeman, “Americans and Germans,” for the period after 1945.
Williamson (“Evolution”) sought to construct a series of real wages for comparable periods of work time, but owing to data limitations he was not completely successful. Of the European wage observations in the Williamson data set for the period between 1850 and 1914, 9 percent reflect earnings per hour, 23 percent daily earnings, 16 percent weekly earnings, and 11 percent monthly or annual earnings; 40 percent of all observations are unspecified. For example, the wage series for Sweden is inferred from an annual index. It is not evident to what extent the index captures changes in workhours.
Note that hours per person were increasing in the United States and Canada, thus contributing to lower levels of leisure-augmented relative to conventional GDP.

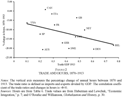
These findings bring a new perspective to debates about the impact of globalization on worker welfare. The closing of the continental gap in worktime sits well with Williamson's view of the benefits of global market integration. As incomes rose in the relatively labor-abundant Old World, its worktime fell faster than in the labor-scarce New World. Williamson may have in fact underestimated the depth of the global labor market, because continental movements in worktime meant that broader measures of worker welfare that include leisure converged as well. The fit between openness and changes in hours lends further credence to the received wisdom on the positive gains of globalization. Recall from Table 3 that textiles, the sector comprising the most competitively traded goods, had the deepest cuts in worktime over the period. This result is also found at the more aggregate level. Figure 2 traces the relation between reductions in worktime from 1870 to 1913 and trade shares in 1913, defined as the value of exports and imports divided by GDP. Small open economies, such as Belgium, Switzerland, Denmark, and Sweden, exhibited large contractions in annual hours from 1870 to 1913, but in protectionist Canada, France, and Italy worktime hardly changed.49
Spain was an open economy until the 1890s (Simpson, “Spain,” p. 354), perhaps explaining in part the downward trend in its worktime. Australia and Germany are exceptions in Figure 2. To get workhours down, Bismarck used explicitly a policy of tariffs as an alternative to labor market regulation. He said: “A normal workday could be established for Germany alone, if Germany were surrounded by a Chinese wall and were economically self-sufficient.” Bismarck cited in Follows, International Labor Organization, p. 91. Figure 2 excludes Ireland. In other work, I have added controls for income and country. The relation between hours and trade holds.

TRADE AND HOURS, 1870–1913
THE RELATION BETWEEN INCOME AND HOURS ACROSS COUNTRIES
Albert Rees, in his classic textbook, asserted that the decision to labor 72 hours per week “in the early days of the industrial revolution” was neither implausible nor impractical. At very low real wages, “with habituation and a less intense pace of work, output could continue to rise with increases in the workweek well beyond any number of hours we could now regard as reasonable.”50
According to Rees (Economics of Work, p. 26), much of the empirical evidence usually cited to show the adverse effect of long hours on output comes from abnormally long hours in wartime. “These hours were worked by workers who were either accustomed to shorter hours or were new wartime recruits. They worked long hours at high money wages at a time when there was a severe shortage of goods.” In these circumstances, 54 hours may have been the maximum length of the workweek. But “this evidence is not inconsistent with an output maximizing figure of 60 or even 72 hours a week a century earlier.”
Fogel, Fourth Awakening, p. 186.
Figure 3 shows an inverse relation between hours and income for a number of countries between 1870 and 1913. The relation was anything but uniform, however. Countries worked different hours at the same levels of income. The evidence offers some support to Hans-Joachim Voth's claim that late industrializers worked fewer hours than Britain at comparable stages of development because of the gradual substitution of human capital for labor time.52
Voth, Time and Work, pp. 258–68.

ANNUAL WORKHOURS AND GDP, 1830–1913
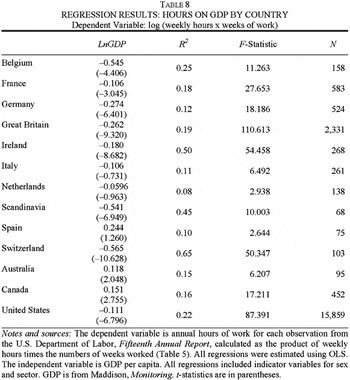
Table 8 reports results of regressions of hours on income by country. For this purpose, I used the observations on weekly hours from the U.S. Department of Labor Survey multiplied by estimates of the number of weeks worked (Tables 2 and 5). The dependent variable is then annual hours for the set of observations from the department's survey. This setup permits controls for sector and sex. The value for per capita income corresponds to the year of the worktime observation. The estimated coefficients—the income elasticity of the demand for leisure—indicate substantial differences in behavior across the sample of countries.53
In his calculations of work hours for the Unites States, Fogel (Fourth Awakening) assumed an income elasticity of 0.1, almost exactly the estimate I report in Table 8.
GDP per capita in Australia was $4,590 in 1880 and $4,299 in 1900. Maddison, Monitoring.

THREE WORLDS OF WORKTIME
The relation between hours and income varied across the sample because counties worked by different rules. Workhours are a public good and when individual workers wanted to exchange some of their higher earnings for more leisure, they needed a collective voice to negotiate on their behalf. But at the most fundamental level, the nature and form of collective-decision differed across the sample of countries.55
On hours as a public good, see Shiells, “Collective Choice.” Unless otherwise stated, all statistics in this section are from Table 2.
The failure of hours to contract as incomes rose in Britain has puzzled historians because unions were relatively strong and had participated in earlier rounds of worktime legislation. But after the establishment of the nine-hour workday in selected sectors in the early 1870s, British unions chose not to press for further reductions in worktime.56
Clegg, Fox, and Thompson, British Trade Unions, p. 293.
Sidney and Beatrice Webb, Industrial Democracy, p. 353; and Fraser, History of Trade Unionism, p. 61.
Clegg, Fox, and Thompson, British Trade Unions, pp. 243, 294.
Pencavel, Labor Markets, pp. 45–48.
Hunt, British Labour History, p. 298; Shiells, “Collective Choice,” p. 387. Collective pressure for standardization in textiles is captured in Table 2 which shows a smaller variance of workhours in this sector compared to iron and steel where unions were weaker.
For 1870–1879, the standard deviation of textile hours was 3.1; for 1890–1899, 2.4. The Webbs referred to the standard day across firms and regions as the “common rule.” Industrial Democracy, pp. 341, 345. British workers had relatively more success in harmonizing worktime. The variance of working hours in British textiles was smaller than the dispersion of textiles hours across European states and all countries.
French unions were clearly weaker than those in Britain, but the pattern in worktime in the hexagon must be sought elsewhere. Not only did hours remain long, but the dispersion of French hours across sectors was generally greater than that found in Britain, excluding services. Small- and medium-sized enterprises, which dominated French industry, had a tendency to work long and often irregular hours compared to larger units.62
In 1906 roughly a third of the manufacturing labor force in France “worked in isolation, which to a large extent must have meant workers' homes.” Mokyr, Gifts of Athena, p. 150.
Cross, Quest for Time, pp. 233–34.
For the early period, see Rosenband, Papermaking, p. 109. For the later years, see Découflé and Svendsen, “Une histoire,” p. 63.
Jay, Semaine anglaise; and Beck “Dimanche.”
Trempé, Mineurs, pp. 220–21. On the laxity of French legislation, see Jay, Limitation légale en France; and Guedj and Vindt, Temps de travail, pp. 32–34.
Compared to the British and French cases, regulation was the key to Belgium's success in reducing worktime. The country in 1870 was in Marx's phrase a “capitalist's paradise,” and in Vandervelde's eyes a “workers' purgatory.”67
Vandervelde, “Assurance ouvrière,” p. 4.
For regional spinning lists in Belgium, see Scholliers, Wages, Manufacturers, pp. 123–24.
Puissant, “Contre-réforme”; and Kossmann, Low Countries, pp. 500–01.
In 1900 Belgium's social legislation was inferior to Switzerland's, but by 1913 the reverse held. For average European and country values, see Huberman and Lewchuk, “Labor Market Integration.” On the effectiveness of legislation, see Denis, “Projets de limitation”; and Vandervelde, “Inspection du travail” and “Lois sociales.”
The form, timing, and success of collective-decision making varied across and within Old and New Worlds. The Belgium model of regulation echoed earlier changes in Switzerland and predated those in the Netherlands. Spaniards appear to have reduced the workweek in the absence of any substantive legislation, whereas in Scandinavia the decline in hours preceded regulation. Key textile unions in Barcelona may have led the way to a shorter hours in Iberia, and in Denmark collective-decision making may have been facilitated, to borrow a phrase from Kindleberger, by its celebrated “group behavior.”71
Sources consulted for this paragraph include: Australia: Butlin, Australian Economic Development, pp. 391–92, and Coughlan, Labour and Industry, pp. 2087–97; Canada: Rouillard, Travailleurs du coton, pp. 56–60; Italy: Zamagni, History of Italy, pp. 201–05; Scandinavia: Kindleberger, “Group Behavior”; Spain: Amsden, Collective Bargaining; Switzerland: Jay, Limitation légale en Suisse; and United States: Shiells, “Collective Choice.”
CONCLUDING OBSERVATIONS: BORDERS AND GLOBALIZATION
Pain in Spain: Workers Bid Adios to Siesta
With Spain under pressure to adjust to richer neighbor's timetables, the ritual three-hour break for lunch and nap is disappearing. Spaniards say that they are working harder these days and sleeping less, feeling at once more prosperous and more fatigued…. Because of more industrious work habits, according to one nationwide survey, regular siesta takers [now constitute only] 24 per cent of the population … The siesta is losing ground in other Mediterranean strongholds as Portugal, Italy and Greece also rush to catch their partners in the European Union.
Los Angeles Times, 31 March 2000
Power Napping: Siesta Time
An hour's sleep in the middle of the day can work wonders. According to research at Harvard, just 60 minutes of shut-eye in the middle of the day can make you perform like the fresh daisy you were first thing in the morning…. The protestant work-ethic that drives those now living in colder climates to work throughout the day may actually be counter-productive.
The Economist, 1 June 2002, p. 76
Work during the second industrial revolution was certainly industrious, but there was also considerable variation in the length of the workweek and the number of workdays. In 1870 Britons, followed closely by Australians, worked the shortest work year and Belgians, the longest. On average, the New World labored fewer annual hours and shorter workweeks than the Old, although the latter tended to have more days off. After 1870 and until the war, the movement of hours was anything but uniform, despite the fact that incomes rose almost everywhere. Belgian, German, Scandinavia, and Spanish hours converged to British levels, while French and Italian hours barely changed. In the New World, the movements were as diverse. As ardent Canadians toiled longer and Americans modestly less, Australians gave significantly fewer hours on the job over the period.
The changes in hours would appear to mesh with the view that a global labor market operated before 1913. The transport revolution and population and capital movements brought Old and New Worlds closer together. Economic historians, led by Williamson, have investigated the effects of globalization on factor prices, which are believed to have converged across continents. Gaps in worktime did narrow as well, especially between North America and northern and western Europe, with the exception of France. The implication is that for a subset of countries convergence was deep, in the sense that the expansion of international exchanges eroded differences in living standards broadly defined to include changes in leisure. There are qualifications to this picture, however. Because of differences in the nature and form of collective-decision making, hours everywhere did not adjust to the same degree as incomes changed, and as a result convergence between Old and New Worlds masked considerable variation at the national level. Countries did not look any more alike in 1913 than in 1870 with regard to how they organized the workday.
These findings cast some light on opposing claims on the effects of economic integration on worktime. One view is that as global forces spread and accentuate, combined with the process of harmonization embedded in projects such as the European Union and the North American Free Trade Agreement, the workday will tend to look alike across countries, and even Spanish workers will lose their rest time. The other is that workers, firms, and states can organize the workday as they see fit. There are many margins of adjustment in labor markets and pressures on labor costs need not translate into convergence of worktime, especially where national routines such as the mid-day rest may have positive effects on productivity.72
Ehrenberg, Labor Markets, provides a summary of the debate.
Appendix
THE DATA SOURCE
In its Fifteenth Annual Report, the U.S. Department of Labor gathered data on factory conditions across countries, including the weekly hours and earnings of female and male workers, and occasionally the size of firm. The report consulted official sources exclusively. A partial list includes: Australia: Labor Bureau, New South Wales—First to Sixth Annual Report, 1892–1898. Belgium: Office du travail—Revue du Travail, Vols. 1–4, 1896–1899. Canada: Bureau of Industries, Ontario—First to Seventeenth Annual Report, 1882–1899. Denmark: Bureau de Statistique de l'État—Communication de Statistique, 4ième série, Tome 5. France: Office du Travail—Salaires et durée du travail dans l'industrie française. 4 vols., 1893, 1894, 1896, 1897. Germany: Statistisches Amt der Stadt Berlin—Statistisches Jahrbuch der Stadt Berlin, 1897. Italy: Ministero di Agricoltura, Industria e Commercio—Annali di Statistica: Industria della Lana, 1895. Netherlands: Centrale Commissie voor de Statistiek—Jaarcijfers, 1892–1897 en vorige jaren. Switzerland: Secrétariat Ouvrier Suisse—8e et 9e Rapport annuel, 1895–1896.
The unit of observation is occupation at the firm level (the average hour worked by cotton spinners in a particular firm and year). The report contains approximately 4,500 occupations. I have selected 46 occupations for which there were reasonably large numbers of observations across countries. These are listed in Appendix Table 1 by sector.

THE U.S. DATA
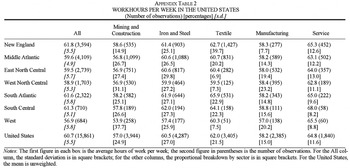
In its report, the Department of Labor consulted all previous published census returns, and state and federal bulletins and reports on workhours. In Appendix Table 2, I have organized the U.S. data by region. The breakdown follows Rosenbloom (“Was There a National Labor Market,” p. 653). My findings on workhours closely resemble those of Rosenbloom and others. Over the period, there was little tendency for workhours between North and South to converge. Regional results over time are available from the author. The pattern in workhours fits well with Rosenbloom's (Looking for Work) claim that in the postbellum period northern and southern labor markets operated differently. Nonetheless, the variation in hours among U.S. regions was smaller than that for European countries.

OCCUPATIONAL WEIGHTS
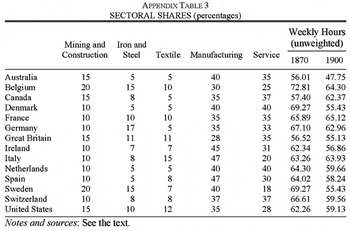
The categories in Appendix Table 1 did not always coincide with occupational breakdowns used elsewhere. I have made an effort to select employment weights from the most detailed occupational breakdowns available. The weights correspond to 1900 or the closest observation to that date. There remains a degree of approximation to the actual weights used. Some comfort can be taken in that the choice of weights does not alter the general results of this article. The last two columns of Appendix Table 3 give average unweighted weekly hours for 1870 and 1900; these series are very close to the weighted values of Table 4. Sources: Australia: n.a. “Select Comparative Statistics”; Belgium: Vandermotten, “Tendencies longues,” pp. 91–93; Canada: Marr and Paterson, Canada, pp. 197–98; Denmark: Mitchell, Historical Statistics, p. 162; France: Marchand and Thélot, Travail en France, p. 88; Germany, Great Britain, and United States: Broadberry, Productivity, p. 64; Ireland: Ó Gráda, Ireland, p. 397; Italy: Zamagni, History of Italy, pp. 86–87; Netherlands: N. W. Posthumus Institute, “Dutch National Accounts”; Personal communication—Spain (Joan R. Rosés); Sweden (Olle Krantz); and Switzerland (Thomas David).

I have benefited from the comments of Bryan Campbell, Jon Cohen, Leonard Dudley, Timothy Hatton, Thomas Lemieux, Wayne Lewchuk, Louis Michel, Laura Owen, Benoit Perron, Jeffrey Williamson, and Denise Young, and participants at the All-UC Economic History Conference, Davis, California, April 2003, and the meetings of the Network in Canadian Economic History, Guelph, Ontario, October 2003. At the JEH I have benefited from the comments of three anonymous referees and Knick Harley. Nathalie Villeneuve was an indefatigable research assistant. The support of the SSHRC INE grant “Globalization, Technological Revolutions, and Education” is gratefully acknowledged. The usual disclaimer applies.
References
Altman Morris.
1999
“New Estimates of Hours of Work and Real Income in Canada from the 1880s to 1930: Long-Run Trends and Workers' Preferences.”
Review of Income and Wealth
45, no. 3
353–72Google Scholar
Amsden Jon.
1972.
Collective Bargaining and Class Conflict in Spain.
London:
Weidenfeld & Nicolson,
Atack Jeremy, and Fred Bateman.
1992
“How Long Was the Workday in 1880?”
This Journal
52, no. 1
129–60Google Scholar
Atack Jeremy, Fred Bateman, and Robert A. Margo.
2002
“Part-Year Operation in Nineteenth-Century American Manufacturing: Evidence from the 1870 and 1880 Censuses.”
This Journal
62, no. 3
792–809Google Scholar
Atack Jeremy, Fred Bateman, and Robert A. Margo.
2003
“Productivity in Manufacturing and the Length of the Working Day: Evidence from the 1880 Census of Manufactures.”
Explorations in Economic History
40, no. 2
170–94Google Scholar
Barmby Tim A., Marco G. Erolani, and John G. Treble.
2002
“Sickness Absence: An International Comparison.”
Economic Journal
112, no. 2
F315–31Google Scholar
Barro Robert, and Xavier Sala-I-Martin.
1995.
Economic Growth.
New York:
McGraw-Hill,
Beck Robert
1998:
“C'est dimanche qu'il nous faut' les mouvements sociaux en faveur du repos dominical et hebdomadaire en France avant 1906.”
Le mouvement social
8, July–September
23–51.Google Scholar
Beckerman Wilfred
1980.
“Comparative Growth Rates of 'Measurable Economic Welfare': Some Experimental Calculations.” In Economic Growth and Resources,
Vol. 2,
edited by R. C. O. Matthews,
36–59.
London:
Macmillan,
Bell Linda, and Richard B. Freeman.
1995.
“Why Do Americans and Germans Work Different Hours?”
National Bureau of Economic Research, working paper,
no. 4808,Google Scholar
Bienefeld Manfred A.
1972.
Working Hours in British Industry.
London:
Weidenfeld and Nicolson,
Bompard J. P., Thierry Magnac, and Gilles Postel-Vinay.
1990:
“Emploi, mobilité et chômage en France au XIXe siècle: migrations saisonnières entre industrie et agriculture.”
Annales
ESC 45,
no. 1
55–76.Google Scholar
Broadberry Stephen N.
1997.
The Productivity Race: British Manufacturing in International Perspective, 1850–1990.
Cambridge:
Cambridge University Press,
Butlin Noel
1964.
Investment in Australian Economic Development, 1861–1900.
Cambridge:
Cambridge University Press,
Casella Alessandra
1996.
“Free Trade and Evolving Standards.” In Harmonization and Fair Trade,
edited by Jagdish Bhagwati and Robert Hudec,
119–56.
Cambridge, MA:
MIT Press,
Christensen J. P.,
1975.
Lønudviklingen inden for dansk håndværk og industri, 1870–1914.
Copenhagen:
Akademisk Förlag,
Clegg H. A., Alan Fox, and A. F. Thompson.
1964.
A History of British Trade Unions since 1889. Vol. 1, 1889–1910.
Oxford:
Clarendon Press,
Coghlan Timothy A.
1918.
Labour and Industry in Australia, Part IV.
London:
Oxford University Press,
Cohen Jon, and Giovanni Federico.
2001.
The Growth of the Italian Economy, 1820–1960.
Cambridge:
Cambridge University Press,
Costa Dora L.
2000
“The Wage and the Length of the Workday: From the 1890s to 1991.”
Journal of Labor Economics
18, no. 1
156–91Google Scholar
Crafts N. F. R.
1997
“The Human Development Index and Changes in Standards of Living: Some Historical Comparisons.”
European Review of Economic History
1, no. 2
299–322Google Scholar
Cross Gary
1989.
A Quest for Time: The Reduction of Work in Britain and France, 1840–1940.
Berkeley:
University of California Press,
Decouflé,A.-C., and N. Svendsen.
1984:
“Contribution à une histoire des durées du travail dans l'industrie française du milieu du XIXe siècle à la seconde guerre mondiale.”
Travail et emploi
20
57–71.Google Scholar
Denis Hector
1908.
Les projets de limitation de la durée du travail des adultes en Belgique.
Liège:
Bénard,
Ehrenberg Ronald G.
1994.
Labor Markets and Integrating National Economies.
Washington, DC:
Brookings Institution,
Ekirch A. Roger.
2001
“Sleep We Have Lost: Pre-Industrial Slumber in the British Isles.”
American Historical Review
106, no. 2
343–85Google Scholar
Fogel Robert W.
2000.
The Fourth Great Awakening and the Future of Egalitarianism.
Chicago:
University of Chicago Press,
Follows John W.
1951.
Antecedents of the International Labour Organization.
Oxford:
Clarendon Press,
Fowler Alan
2003.
Lancashire Cotton Operatives and Work, 1900–1950.
Aldershot, UK:
Ashgate,
Fraser W. Hamish
1999.
A History of British Trade Unionism, 1700–1998.
New York:
St Martin's Press,
Gårdlund Torsten.
1955.
Industrialismens Sämhalle.
Stockholm:
Tidens Förlag,
Green Alan, Mary MacKinnon, and Chris Minns.
2002
“Dominion or Republic? Migrants to North America from the United Kingdom, 1870–1910.”
Economic History Review
55, no. 4
666–96Google Scholar
Guedj Francois, and Gérard Vindt.
1997.
Le temps de travail: une histoire conflictuelle.
Paris:
Syros,
Gutman Herbert G.
1973
“Work, Culture, and Society in Industrializing America, 1815–1919.”
American Historical Review
78, no. 2
531–88Google Scholar
Hamermash Daniel S.
1996.
Workdays, Workhours and Work Schedules: Evidence for the United States and Germany.
Kalamazoo, MI:
Upjohn,
Harmsen Ger, and Luchien Karsten.
1988.
“Le premier mai: jour de manifestation dans le mouvement ouvrier néerlandais.” In Internationalism in the Labour Movement, 1830–1940,
edited by Frits van Holthoon and Marcel van der Linden,
195–216.
Leiden:
E. J. Brill,
Hatton Timothy, and Jeffrey G. Williamson.
1998.
The Age of Mass Migration: Causes and Economic Impact.
New York:
Oxford University Press,
Heikkinen Sakari
1997.
Labour and the Market: Workers, Wages and Living Standards in Finland, 1850–1913.
Helsinki:
Commentationes Scientiarum Socialium,
Hoffmann Walter.
1965.
Das Wachstum der deutschen Wirtschaft seit der Mitte des 19.
Jahrhunderts.
Berlin:
Springer Verlag,
Huberman Michael.
2004.
“Workdays, Workweeks, and Annual Hours: New International Estimates, 1870–2000.”
Unpublished mimeograph, Université de Montréal,Google Scholar
Huberman Michael, and Wayne Lewchuk.
2003
“European Economic Integration and the Labour Compact, 1850–1913.”
European Review of Economic History
7, no. 1
3–43Google Scholar
Hunt E. H.,
1985.
British Labour History, 1815–1914.
London:
Weidenfeld & Nicolson,
International Labour Organization.
1922:
“Labour and Industrial Conditions in Australia in 1921.”
International Labour Review
6 (December)
1019–27.
International Labour Organization.
1925:
“Legislation on Annual Holidays for Workers.”
International Labour Review
11 (July)
1019–27.
Jay Raoul
1891.
La limitation légale de la journée de travail en Suisse.
Paris:
Larose,
Jay Raoul
1906.
La limitation légale de la journée de travail en France. Rapport présenté à l'Association internationale pour la protection légale des travailleurs.
Paris:
Félix Alcan,
Jay Raoul
1915.
La semaine anglaise: le repos le samedi après-midi.
Paris,
Félix Alcan,
Kaplow Jeffrey
1981
“La fin de la Saint-Lundi: étude sur le Paris ouvrier au XIXe siècle.”
Temps Libre
2, no. 1
22–38Google Scholar
Kesser-Harris Alice.
1990.
A Woman's Wage: Historical Meanings and Social Consequences.
Lexington:
University Press of Kentucky,
Kindleberger Charles P.
1951:
“Group Behavior and International Trade.“
Journal of Political Economy
59, no. 1
30–46.Google Scholar
Kossmann Ernst H.
1978.
The Low Countries, 1780–1940.
Oxford:
Clarendon Press,
Lewis Robert
2000.
Manufacturing Montreal: The Making of an Industrial Landscape, 1850–1930.
Baltimore:
Johns Hopkins,
Liepmann Kate K.
1944.
The Journey to Work: Its Significance for Industrial and Community Life.
London:
Kegan, Paul,
Maddison Angus
1964.
Economic Growth in the West.
New York:
Twentieth Century Fund,
Maddison Angus
1982.
Phases of Capitalist Development.
New York:
Oxford University Press,
Maddison Angus
1987
“Growth and Slowdown in Advanced Capitalist Economies.”
Journal of Economic Literature
25, no. 3
649–98Google Scholar
Maddison Angus
1995.
Monitoring the World Economy, 1820–1992.
Paris:
Organization for Economic Cooperation and Development,
Maddison Angus
2001.
The World Economy: A Millennial Perspective.
Paris:
Organization for Economic Cooperation and Development,
Marchand Olivier, and Claude Thélot.
1991.
Deux siècles de travail en France.
Paris:
INSEE,
Marr William, and Donald G. Paterson.
1980.
Canada: An Economic History.
Toronto:
Macmillan,
Matthews R. C. O., C. H. Feinstein, and J. C. Odling-Smee.
1982.
British Economic Growth, 1856–1973.
Stanford, CA:
Stanford University Press,
Milhaud Maurice
1932
“The 'Unbroken' Working Day.”
International Labour Review
26, no. 4
797–812Google Scholar
Mitchell Brian R.
1980.
European Historical Statistics, 1750–1975.
Second edition. New York:
Facts on File,
Mokyr Joel
2002.
The Gifts of Athena: Historical Origins of the Knowledge Economy.
Princeton, NJ:
Princeton University Press,
N. W. Posthumus Institute.
“Dutch National Accounts.”
Available at: www.http:// nationalaccounts.niwi.knaw.nl.
Neuville Jean.
1981.
L'évolution des relations industrielles, Tome 2: la lutte ouvrière pour la maîtrise du temps.
Brussels:
Vie Ouvrière,
Ó Gráda Cormac.
1994.
Ireland: A New Economic History, 1780–1939.
Oxford:
Clarendon Press,
O'Rourke Kevin, and Jeffrey G. Williamson.
1999.
Globalization and History: The Evolution of a Nineteenth-Century Atlantic Economy.
Cambridge, MA:
MIT Press,
Panaccione Andrea, Ed.
1989.
The Memory of May Day.
Rome:
Marsilio Editori,
Pencavel John
1991.
Labor Markets Under Trade Unionism: Employment, Wages, and Hours.
Oxford:
Blackwell,
Phelps BrownE. H., and M. H. Browne.
1972.
“Hours of Work.” In The International Encyclopedia of the Social Sciences,
vol. 8 487–90.
New York:
Colliers,
Polasky Janet
2001:
“Transplanting and Rooting Workers in London and Brussels: A Comparative History.”
Journal of Modern History
73, no. 3
528–60.Google Scholar
Pollard Sidney
1978.
“Labour in Great Britain.” In The Cambridge Economic History of Europe, vol. 2, part 2,
edited by Peter Mathias and M. M. Postan,
97–179.
New York:
Cambridge University Press,
Puissant Jean
1986.
“1886. La Contre-réforme sociale?” In Cent ans de droit social en Belgique,
edited by Pierre Van Der Host,
66–100.
Brussels:
Bruylant,
Rees Albert
1973.
The Economics of Work and Pay.
New York:
Harper & Row,
Rist Charles
1898.
La réglementation légale de la journée de travail de l'ouvrier adulte.
Paris:
Larose,
Rodgers Daniel T.
1978.
The Work Ethic in Industrial America, 1850–1920.
Chicago:
University of Chicago Press,
Rosenband Leonard N.
2000.
Papermaking in Eighteenth-Century France: Management, Labor, and Revolution at the Montgolfier Mill, 1761–1805.
Baltimore:
Johns Hopkins,
Rosenbloom Joshua L.
1990:
“One Market or Many? Labor Market Integration in the Late Nineteenth Century United States."
This Journal
50, no. 1
85–109.Google Scholar
Rosenbloom Joshua L.
1993:
“Male Labor Supply in the Late Nineteenth Century.”
Research in Economic History
14
241–68Google Scholar
Rosenbloom Joshua L.
1996:
“Was There a National Labor Market at the End of the Nineteenth Century? New Evidence on Earnings in Manufacturing.”
This Journal
56, no. 3
626–56.Google Scholar
Rosenbloom Joshua L.
2002.
Looking for Work, Searching for Workers: American Labor Markets during Industrialization.
New York:
Cambridge University Press,
Rowntree B. Seebohm.
1913.
Comment diminuer la misère: études sur la Belgique.
Paris:
V. Giard
Rouillard Jacques
1974.
Les travailleurs du coton au Québec 1900–1915.
Montréal:
Les Presses de l'Université du Québec,
Schloss David F.
1898.
Methods of Industrial Remuneration.
Oxford:
Williams,
Scholliers Peter
1996.
Wages, Manufacturers and Workers in the Nineteenth Century Factory: The Voortman Cotton Mill in Ghent.
Oxford:
Berg,
1984.
"Select Comparative Statistics 1900–1940: Australia and Britain, Canada, Japan, New Zealand and U.S.A."
Source Papers in Economic History
no. 4, Australian National University,
Sheills Martha E.
1990:
“Collective Choice of Working Conditions: Hours in Britain and U.S. Steel, 1890–1923.”
This Journal
55, no. 2
379–92.Google Scholar
Simpson James
1997
“Economic Development in Spain, 1850–1936.”
Economic History Review
50, no. 2
348–59Google Scholar
Strikwerda Carl
1997.
A House Divided: Catholics, Socialists and Flemish Nationalists in Nineteenth-Century Belgium.
New York:
Rowman & Littlefield,
Strikwerda Carl
1998.
“France and Belgian Immigration of the Nineteenth Century.” In The Politics of Immigrant Workers: Labor Activism and Migration in the World Economy since 1830,
edited by Camille Guerin-Gonzales and Carl Strikwerda,
111–44.
New York:
Holmes and Meier,
Tegle Stig
1982.
“Den Ordinarie Veckoarsbetstiden i Sverige, 1860–1980: En översikt.”
Unpublished manuscript,
University of Lund,Google Scholar
Trempé Rolande.
1971.
Les mineurs de carmaux, 1848–1914. Tome II.
Paris:
Éditions Ouvrières,
United Kingdom. Parliamentary Papers (PP).
1870.
Reports from Her Majesty's Diplomatic and Consular Agents,
vol. 66.
United Kingdom. Parliamentary Papers (PP).
1871.
Reports from Her Majesty's Diplomatic and Consular Agents,
vol. 68.
United Kingdom. Parliamentary Papers (PP).
1872.
Reports from Her Majesty's Diplomatic and Consular Agents,
vol. 62.
United Kingdom. Parliamentary Papers (PP).
Commission on Labour, Foreign Reports,
vol. 39.
1893–94
United Kingdom. Parliamentary Papers (PP).
1899.
First Annual Abstract of Foreign Labour Statistics,
vol. 92.
United Kingdom. Parliamentary Papers (PP).
1901.
Second Annual Abstract of Foreign Labour Statistics,
vol. 73.
United Kingdom. Parliamentary Papers (PP).
1905.
International Conference on Labour,
vol. 73.
United Kingdom. Parliamentary Papers (PP).
1906.
Third Annual Abstract of Foreign Labour Statistics,
vol. 113.
United Kingdom. Parliamentary Papers (PP).
1909.
Reports of Earnings and Hours,
vol. 80.
U.S. Department of Commerce. Bureau of the Census.
1989.
Historical Statistics of the United States, Colonial Times to 1870.
New York:
Kraus Publications,
U.S. Department of Labor.
1900.
Fifteenth Annual Report of the Commissioner of Labor: Wages in Commercial Countries.
2 vols
Washington, DC:
GPO,
U.S. Department of Labor.
1911.
24th Annual Report of the Commissioner of Labor for 1909: Workmen's Insurance and Compensation Systems in Europe.
2 vols. Washington, DC:
GPO,
U.S. Department of Labor.
1914.
Workmen's Compensation Laws of the United States and Foreign Countries.
Bulletin of the United States Bureau of Labor Statistics, Department of Labor, no. 126. Washington, DC:
GPO,
University of Groningen and the Conference Board GGDC Total Economy Database, 2003. Available at: www.eco.rug.nl/ggdc.
Vandermotten Christian
1980
“Tendences longues de l'évolution de la production, de l'emploi et de la productivité industriels en Belgique: 1840–1978.”
Cahiers économiques de Bruxelles
86, no. 2
261–301Google Scholar
Vandervelde Émile.
1889.
L'assurance ouvrière en Belgique.
Brussels:
Veuve Monnom,
Vandervelde Émile.
1896:
“Inspection du travail en Belgique.”
Revue socialiste
23 (March)
318–25.Google Scholar
Vandervelde Émile.
1906.
La Belgique ouvrière.
Paris:
Edouard Cornely,
Vandervelde Émile.
1911:
“La journée de neuf heures dans les mines.”
Revue d'économie politique,
March-April
318–25.Google Scholar
Van Houtte François-Xavier.
1949.
L'évolution de l'industrie textile en Belgique et dans le monde de 1800 à 1939.
Louvain:
E. Nauwelaerts,
Varlez M. L.,
1894.
“L'Assurance intégrale.”
Rapport du Congrès International d'Anvers sur la législation douanière et la règlementation du travail.
Brussels,Google Scholar
Voth Hans-Joachim.
1998:
“Time and Work in Eighteenth Century London.”
This Journal
58, no. 1
29–58.Google Scholar
Voth Hans-Joachim.
2000.
Time and Work in England, 1750–1830.
Oxford:
Clarendon Press,
Williamson Jeffrey G.
1995
“The Evolution of Global Labor Markets since 1830: Background Evidence and Hypotheses.”
Explorations in Economic History
32, no. 1
141–96Google Scholar
Wintle Michael
2000.
An Economic and Social History of the Netherlands 1800–1920: Demographic, Economic and Social Transition.
Cambridge:
Cambridge University Press,
Zamagni Vera
1993.
The Economic History of Italy.
Oxford:
Clarendon Press,
MADDISON'S ESTIMATES OF WORKTIME, 1870–1913
AVERAGE HOURS OF WORK PER WEEK, 1870–1899 Mean (Median) Number of observations [Proportion] [s.d.]
WEEKLY WORKHOURS BY SECTOR
HOURS OF WORK PER WEEK: ACTUAL AND PREDICTED VALUES
AVERAGE WEEKLY WORKHOURS, 1870–1913
DAYS OF WORK AND NUMBER OF WEEKS WORKED [s.d.]
ANNUAL WORKHOURS, 1870–1913
GDP ADJUSTED FOR LEISURE
TRADE AND HOURS, 1870–1913

ANNUAL WORKHOURS AND GDP, 1830–1913
REGRESSION RESULTS: HOURS ON GDP BY COUNTRY Dependent Variable: log (weekly hours × weeks of work)
OCCUPATIONS BY CATEGORY
WORKHOURS PER WEEK IN THE UNITED STATES (Number of observations) [percentages] [s.d.]
SECTORAL SHARES (percentages)
 You have
Access
- 55
- Cited by