Implications
Conjugated linoleic acid (CLA) is a component of milk fat with demonstrated health benefits. It was hypothesized that a difference in rate of starch digestion, varied through source of grain and processing method (rolling v. grinding), would influence rumen PUFA digestion and thus milk CLA. Concentrations of ruminal CLA precursors and milk CLA were greater for barley-based diets than corn-based diets but were not different between rolling and grinding indicating that factors inherent in the source of starch were responsible for the observed differences and these factors could not be modified by the processing methods used.
Introduction
The importance of diet in increasing milk rumenic acid (RA) concentrations has been well demonstrated (Chilliard et al., Reference Chilliard, Ferlay and Doreau2001; Bell et al., Reference Bell, Griinari and Kennelly2006). Polyunsaturated fatty acid (PUFA) substrates such as linoleic acid (LA) and α-linolenic acid (LNA) in the diet undergo biohydrogenation in the rumen resulting in formation of major intermediates like trans(t)11-18:1 vaccenic acid (VA) and t10-18:1. These intermediates are the products of two different pathways of PUFA metabolism (Kramer et al., Reference Kramer, Cruz-Hernandez, Deng, Zhou, Jahreis and Dugan2004). The concentrations of the intermediates in the rumen depends on the extent to which PUFA substrates are metabolized and are influenced by the initial concentration of dietary PUFA (Harfoot et al., Reference Harfoot, Noble and Moore1973), passage rate, and rumen pH (Troegeler-Meynadier et al., Reference Troegeler-Meynadier, Nicot, Bayourthe, Moncoulon and Enjalbert2003; Qiu et al., Reference Qiu, Eastridge, Griswold and Firkins2004). Altered rumen function resulting from a low rumen pH has been demonstrated to reduce the extent of PUFA biohydrogenation both in vitro (Martin and Jenkins, Reference Martin and Jenkins2002) and in vivo (Kalscheur et al., Reference Kalscheur, Teter, Piperova and Erdman1997). As rumen pH is mainly influenced by the fermentable carbohydrate in the diet, it is possible that the amount and source of starch and or the rate of ruminal degradation of starch could play a role in altering rumen pH, which in turn could affect biohydrogenation intermediates in the rumen.
It is well established that barley starch is more rapidly and completely degraded in the rumen compared with corn starch (Ørskov, Reference Ørskov1986; Huntington, Reference Huntington1997). Furthermore, rumen availability and degradability of grain starch can be increased by processing grain (Hale, Reference Hale1973; Theurer, Reference Theurer1986). Previous studies have shown that the feeding of grain-based diets decreases rumen pH (Yang and Beauchemin, Reference Yang and Beauchemin2007; Penner et al., Reference Penner, Taniguchi, Guan, Beauchemin and Oba2009). In most studies, rumen pH measurements were generally taken either once (Tajima et al., Reference Tajima, Aminov, Nagamine, Matsui, Nakamura and Benno2001), twice (Abughazaleh et al., Reference AbuGhazaleh, Schingoethe, Hippen and Kalscheur2003; Mohammed et al., Reference Mohammed, Stanton, Kennelly, Kramer, Mee, Glimm, O’Donovan and Murphy2009), four times (Klieve et al., Reference Klieve, Hennessy, Ouwerkerk, Forster, Mackie and Attwood2003) or six times a day (Kalscheur et al., Reference Kalscheur, Teter, Piperova and Erdman1997; Kim et al., Reference Kim, Huws, Lee, Wood, Muetzel, Wallace and Scollan2008). It proved difficult to relate the selected pH measurements to changes in rumen bacterial population (Klieve et al., Reference Klieve, Hennessy, Ouwerkerk, Forster, Mackie and Attwood2003; Kim et al., Reference Kim, Huws, Lee, Wood, Muetzel, Wallace and Scollan2008), or to specific fatty acid (FA) metabolite (ruminal t10-18:1; Mohammed et al., Reference Mohammed, Stanton, Kennelly, Kramer, Mee, Glimm, O’Donovan and Murphy2009). Therefore, in this study we utilized a continuous rumen pH monitoring system (Penner et al., Reference Penner, Beauchemin and Mutsvangwa2006) to determine rumen pH changes more accurately and relate them to the PUFA intermediates in the rumen.
It was hypothesized that a rapidly fermentable starch source (barley) would inhibit the reduction of t11-18:1 to 18:0 to a greater extent resulting in greater concentrations of t11-18:1 in rumen and milk RA compared with a less fermentable starch source (corn) (Ørskov, Reference Ørskov1986; Huntington, Reference Huntington1997). A reduction in grain particle size by grinding could increase starch availability and degradability for ground diets compared with rolled diets. Our second hypothesis, therefore, was that ground diets (barley or corn) would also inhibit the reduction of t11-18:1 to 18:0 to a greater extent than rolled diets resulting in greater concentrations of ruminal t11-18:1 and milk RA for ground diets. Given the differences in particle size between rolled and ground diets and the expected differences in rates of starch fermentation between barley and corn, we further hypothesized that milk from cows fed barley-based diets (BBD) and ground diets (corn or barley) would have higher concentrations of t10-18:1 and lower milk fat yield compared with the milk from cows fed corn-based diets (CBD) and rolled diets (barley or corn). To test these hypotheses an experiment was designed with the following objectives: (i) to characterize the changes in ruminal pH as the result of feeding two grain sources known to differ in rates of starch fermentation, (ii) to determine whether differences in rates of starch degradation achieved through processing, and the resultant changes in ruminal pH, would affect the metabolism of PUFA as measured by the resultant end products, specifically the t-18:1 and CLA isomers; and (iii) to determine the variability in rumen t10-18:1, milk RA and milk fat yield.
Material and methods
Experimental design and treatments
All procedures were carried out according to the guidelines of the Canadian Council on Animal Care (Institutional Animal Use Approval Number: 2006-46). Eight Holstein cows were used in a replicated 4 × 4 Latin square design with a 2 × 2 factorial arrangement of treatments with 21-day periods. Treatments were two-grain sources (barley v. corn) and two processing methods (rolled v. ground). The cows were rumen-cannulated, multiparous (lactation number 2 to 5) and in mid-lactation (average milk yield, 38.0 ± 6.1 kg/day; average days in milk, 154.1 ± 57.3; average BW, 721 ± 41 kg). The cows were assigned to two squares such that milk yield and days in milk were similar for both squares. Within a square, the cows were randomly assigned to four dietary treatments: dry rolled barley (RB), ground barley (GB), dry rolled corn (RC) and ground corn (GC).
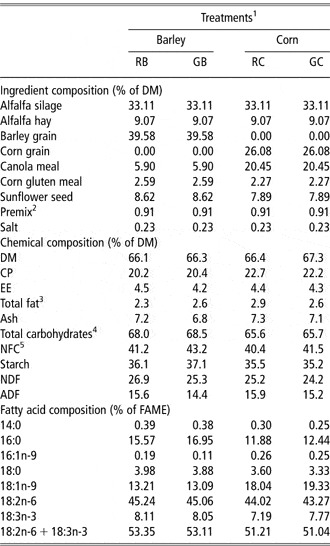
The grains (barley or corn) used in the study were obtained from single lots. Each grain was either dry rolled or ground in a single batch. Grinding was done in a hammer mill (Stirdon, USA) using a 2.38 mm screen. Ingredient composition of diets is given in Table 1. All diets contained whole sunflower seed, which contained 64% LA and 0.13% LNA. Before ration formulation, all the ingredients were screened for starch, LA and LNA contents, and all dietary treatments were formulated to contain similar amounts of starch and total PUFA (LA + LNA). Particle size of the processed grain was determined from six samples each of rolled and ground grain obtained from the single batch of processing using Canadian standard sieve series (no. 5, 10, 18 and 40 with a mesh size 4 mm, 2 mm, 1 mm and 425 μm, respectively) and a sieve shaker (Syntron, Homes City, PA, USA). Experimental diets were offered once daily (0900 h) at 110% of expected intake. All cows were housed in tie stalls with continuous access to water. Cows were milked in their stalls twice daily (0500 and 1700 h).
Ingredient, chemical and fatty acid composition of the experimental diets

RB = rolled barley; GB = ground barley; RC = rolled corn; GC = ground corn; DM = dry matter; EE = ether extract; NFC = non-fibrous carbohydrate; FAME=fatty acid methyl esters; GLC = gas liquid chromatography.
1Diets were RB, GB, RC and GC.
2Premix contained (minimum %) Ca – 0.1, P – 0.6, Na – 11.5, Mg – 0.3; (mg/kg) Fl – 10, I – 80, Zn – 5000, Mn – 3100, Cu – 1170, Co – 6.2; Vitamin A – 1265 kIU/kg, Vitamin D – 142 kIU/kg and Vitamin E – 3800 IU/kg.
3Total fat determined by GLC.
4Total carbohydrate = 100 – (CP + EE + ash).
5NFC = 100 – (NDF + CP + EE + ash).
In situ degradation
Representative samples of RB, RC, GB and GC were obtained. Nitrogen free polyester bags (part no. R 510, Ankom Technology, Macedon, NY, USA) with the manufacturer specified pore size of 50 ± 15 μm were sealed with a sample size (about 1.25 g) to obtain approximately 12.5 mg/cm2 surface area. Quadruplicate sets of bags were prepared for each incubation time and inserted with weights in the ventral sac of the rumen. Rumen incubation times were 0, 1, 2, 4, 8, 12, 24, 48 and 72 h. One of the rumen-cannulated cows offered the RB diet was used for the in situ degradation study after completion of the main experiment. Bags were soaked in warm tap water for 15 min before ruminal incubation to remove the soluble fraction. The percent residue remaining in the bag after the pre-ruminal soak was used as the zero time value and this represented the potentially insoluble but digestible material. At the end of each incubation time, bags were rinsed in cold water until the running water was clear. To minimize contamination of the grain dry matter (DM) with microbial DM, the bags were left overnight at −20°C, thawed and rinsed again in cold water, drained and allowed to dry at 55°C for 48 h (Gonzalez et al., Reference Gonzalez, Rodriguez, Centeno and Lamnari2000). Samples were ground through a 1-mm screen and starch was determined (Karkalas, Reference Karkalas1985). Rate of degradation for the degradable fraction (b) was determined by fitting the data to the exponential equation Rt = R 0 (e kt), where k = degradation rate for the degradable fraction; Rt = degradation at time t; and R 0 = degradation at time zero.
Sampling and chemical analyses
Samples of total mixed rations (TMR) and orts were collected every day in the last week of each period and representative samples of TMR and orts from each period were prepared and stored at −20°C. The DM content of alfalfa hay and alfalfa silage was determined weekly to adjust dietary allocation of forages to maintain a consistent forage/concentrate ratio. The orts samples were pooled by animal and one sample per period was stored at −20°C. The TMR and orts were dried at 55°C for 72 h and ground through a 1-mm screen using a Wiley mill (Thomas-Wiley, Philadelphia, PA, USA). Samples were analyzed for DM content by drying samples at 135°C for 2 h (Association of Official Analytical Chemists (AOAC), 2002; method 930.15). Ash content was determined by drying for 5 h at 550°C in a furnace (AOAC, 2002; method 942.05). Acid detergent fiber and neutral detergent fiber (NDF) (Ankom filter bag technique with the reagents sodium sulphite and alpha-amylase) was determined as described by Van Soest et al. (Reference Van Soest, Robertson and Lewis1991). Crude protein (CP) content was determined using Dumas method of nitrogen determination using a Leco nitrogen combustion analyzer, Leco Corp., St. Joseph MI, USA (Rhee, Reference Rhee2005) and ether extract (EE) was determined with petroleum ether as solvent (Goldfisch extraction apparatus, Labconco, Kansas City, MO, USA; Shahidi, Reference Shahidi2005). Total carbohydrates in TMR were determined by subtracting the sum of the percentage of CP, EE and ash from 100 while the non-fibrous carbohydrates were calculated by substracting the sum of the percentage of CP, NDF, ash and EE from 100 (Beauchemin et al., Reference Beauchemin, Rode and Yang1997). Starch content was determined following the enzymatic method described by Karkalas (Reference Karkalas1985). Absorbance was determined at 450 nm using a plate reader (SpectraMax 190, Molecular Devices Corp., Sunnyvale, CA, USA).
Feed FA composition was determined using 30 mg of TMR samples (by period) by direct methylation using 1 ml of 5% anhydrous HCl/methanolic (w/v) along with an internal standard (C23 : 0 at 10% of the dietary fat). Methylation was done for 1 h at 80oC. Following methylation the fatty acid methyl esters (FAME) were extracted using hexane, reduced in volume to 200 μl using a stream of nitrogen and applied onto a thin layer chromatography (TLC) plate and developed in hexane : diethyl ether : acetic acid solvent (85 : 15 : 1). The FAME fraction was scraped off the TLC plate and extracted with chloroform. After removal of chloroform the FAME were taken up in 1 ml hexane and analyzed by gas liquid chromatography (GLC) using a 100 m CP Sil capillary column (Varian Inc., Mississauga, ON, Canada) at the 175°C temperature program as described by Kramer et al. (Reference Kramer, Hernandez, Cruz-Hernandez, Kraft and Dugan2008). Fiber intake and total substrate intake was estimated from their contents in the TMR offered and orts.
Rumen pH was recorded using the Lethbridge Research Centre Rumen pH Measurement System (LRCpH; Dascor, Escondido, CA, USA) as described by Penner et al. (Reference Penner, Beauchemin and Mutsvangwa2006). This system recorded rumen pH every 30 s continuously for the last 3 days of each period. The pH readings were averaged for each minute and presented as mean daily pH, minimum daily pH, maximum daily pH, duration (h/day) for which rumen pH remained <5.8, <5.5 and <5.2. Similar pH thresholds (5.8, 5.5 and 5.2) were used by Maekawa et al. (Reference Maekawa, Beauchemin and Christensen2002) and Beauchemin and Yang (Reference Beauchemin and Yang2005) to describe the severity of ruminal acidosis. The number of daily episodes of rumen pH < 5.8 was also recorded. A daily episode was defined to begin when rumen pH was below 5.8 and to end when pH reached or exceeded 5.8.
Rumen samples for volatile fatty acids (VFA) and NH3 analysis were collected from four different locations in the rumen (cranial aspect (reticulum), dorsal sac (fiber mat), ventral sac, and caudal aspect), composited and squeezed through four layers of cheese cloth at 0600, 1200 and 1800 h on day 19, at 0900 and 1500 hours on day 20, and at 2100 and 2400 hours on day 21 of each period. Five milliliters of filtrate was preserved by adding 1 ml of 25% (wt/v) HPO3 to determine VFA concentrations (Ranfft, Reference Ranfft1973) and another 5 ml of filtrate was preserved by adding 1 ml of 1% H2SO4 to determine NH3 concentration (Fawcett and Scott, Reference Fawcett and Scott1960). The samples were stored at −20°C until analyzed. Rumen samples for FA analysis consisted of both fluid and solids and were collected at the same time as described for VFA and NH3 analyses and stored at −20°C. For FA analysis, the samples were freeze-dried and milled and 0.5 g of the sample pooled by cow each period was utilized for FA analysis following the protocol described by Mohammed et al. (Reference Mohammed, Stanton, Kennelly, Kramer, Mee, Glimm, O’Donovan and Murphy2009).
Blood samples were collected from the coccygeal vein from each cow at 4 h intervals, on the last 3 days of each period; day 19 at 0700 and 1500 hours; day 20 at 1100 and 1900 hours; and day 21 at 2300 and 0300 hours. Plasma concentrations of glucose, insulin and non-esterified fatty acids (NEFA) were determined for each sample, and the values were averaged by period before statistical analysis. Glucose concentrations were determined using the glucose oxidase/peroxidase enzyme (No. P7119, Sigma, St. Louis, MO, USA) and dianisidine dihydrochloride (No. F5803, Sigma) (Karkalas, Reference Karkalas1985). Absorbance was determined at 450 nm with a plate reader (SpectraMax 190, Molecular Devices Corp., Sunnyvale, CA, USA). Insulin concentrations were determined following the kit instructions (Coat-A-Count, Diagnostic Products Corp., Los Angeles, CA, USA) and NEFA concentrations were determined with NEFA-C-kit, (Wako Chemicals USA, Richmond, VA, USA) using the modified procedure described by Johnson and Peters (Reference Johnson and Peters1993). FA composition was determined from plasma samples pooled by cow each period. Plasma lipids were extracted, methylated and analyzed by GLC as described by Mohammed et al. (Reference Mohammed, Stanton, Kennelly, Kramer, Mee, Glimm, O’Donovan and Murphy2009).
Milk was sampled AM and PM on the last 2 days of each period. The AM and PM samples were pooled for each cow on each sampling day in proportion to the respective milk yields. Milk samples from the 2 days were again pooled in proportion to the daily yields and divided into two aliquots. One aliquot was preserved with potassium dichromate and analyzed for CP, fat, lactose and milk urea nitrogen using mid-infrared spectroscopy at the central milk testing laboratory Edmonton, Alberta, Canada (MilkoScan FT 6000, Foss Electric, Hillerod, Denmark; International Dairy Federation (IDF) 2000) and the other aliquot was stored at −20°C for FA analysis using GLC. Milk lipids were extracted, methylated and analyzed by GLC using two temperature programs as described by Kramer et al. (Reference Kramer, Hernandez, Cruz-Hernandez, Kraft and Dugan2008). Confirmation of 18 : 1 isomers was made using Ag+-solid phase extraction separated fractions (Kramer et al., Reference Kramer, Hernandez, Cruz-Hernandez, Kraft and Dugan2008). Individual FAME were reported as a percentage of total FAME (g/100 g) and the short-chain FAME were corrected for their flame ionization detector deficiency based on theoretical considerations (Wolff et al., Reference Wolff, Bayard and Fabien1995).
Statistical analysis
Data for percentage grain retained on sieves, intakes, production, rumen fermentation and FA composition of lipids in rumen, plasma and milk were analyzed by the MIXED procedure of SAS (version 9.1, SAS Institute, Cary, NC, USA) with treatments as the fixed effect; square, period and cow (square) were random effects. The model included the main effects (grain type and processing) and the interaction. Least square means for the grain type, method of processing and their interaction were calculated for each variable and the differences among the least square means were declared significant at P < 0.05. Step-wise regression analysis was used to identify the variables that influenced the concentrations of t10-18:1, t11-18:1 and RA in rumen contents and milk. The threshold value to keep a term in the model was P < 0.05.
Results
Grain particle size distribution and in situ degradation
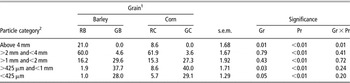
A significant processing effect was observed in the proportion of particles recorded on various sieves indicating that there were differences in grain particle sizes between rolling and grinding (Table 2). Despite using the same roller settings, a significant grain effect was observed in the proportion of particles >4 mm and <1 mm, reflecting differences in inherent characteristics of the grains. In situ degradation rate (%/h) for RC, GC, RB and GB was 5.4, 8.9, 17.0 and 19.4, respectively, for DM and 6.3, 10.8, 25.3 and 43.8, respectively, for starch. These rates indicate a faster rate of degradation for barley grain than corn grain, with grinding increasing the degradation rate of both grains.
Percentage grain retained on sieve

RB = rolled barley; GB = ground barley; RC = rolled corn; GC = ground corn; Gr = grain type; Pr = processing; Gr × Pr = interaction between grain type and method of processing.
1Grain sieved = RB, GB, RC and GC.
2Canadian standard sieve series: numbers 5, 10, 18 and 40 with a mesh size 4 mm, 2 mm, 1 mm and 425 μm, respectively.
Intakes and milk production
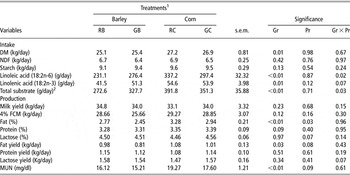
DM intake was greater for cows fed CBD than BBD with no effects of grain processing (Table 3). Fiber (NDF) intakes and starch intakes were not influenced by the grain type or method of processing. Although diets were formulated to contain similar amounts of LA and total PUFA (LA + LNA), there was an interaction between grain type and method of processing for LA intake (P = 0.02) and total PUFA (LA+LNA) intake (P = 0.03). LNA intakes were greater for CBD than BBD with no effects of grain processing. Despite differences in dry matter intake (DMI), milk yields and 4% fat corrected milk were not affected by treatments. Milk fat content was greater for CBD than for BBD with lower values observed for grinding compared with rolling (Table 3). Milk fat yield was also greater for CBD than for BBD; however, it was not influenced by the method of grain processing. The content and yield of milk protein and lactose were not influenced by the grain type or the method of processing. Milk urea nitrogen was greater for CBD than for BBD with no effects of processing.
Effect of grain type and method of processing on intakes, milk yield and milk composition

RB = rolled barley; GB = ground barley; RC = rolled corn; GC = ground corn; Gr = grain type; Pr = processing; Gr × Pr = interaction between grain type and method of processing; DM = dry matter; FCM = fat corrected milk; MUN = milk urea nitrogen.
1Diets were RB, GB, RC and GC.
2Total substrate = 18:2n-6 + 18:3n-3.
Rumen fermentation
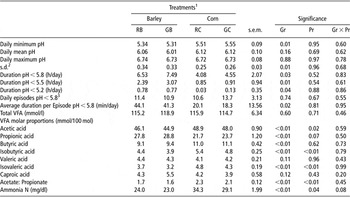
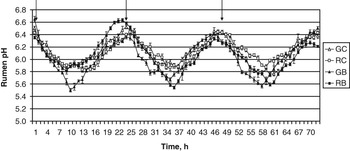
Daily minimum rumen pH was lower for BBD than for CBD (Table 4). Cows fed BBD experienced longer duration below the pH thresholds of 5.8, 5.5 and 5.2 than those fed CBD. However, none of the rumen pH variables measured was influenced by the method of processing. Daily mean pH and maximum pH were not influenced by grain type or method of processing. Standard deviation of the daily rumen pH (1440 data points recorded per day) was greater for BBD than for CBD. Rumen pH averaged on an hourly basis and plotted for 72 h resembled a biphasic curve reaching its maximum in the morning before feeding (Figure 1). It started to fall with the onset of feeding (marked by a downward arrow), reached its lowest level by the end of the day (8–10 h after the onset of feeding) followed by a gradual rise overnight reaching its maximum by the next morning. It could be observed that the lowest points of the curve were data from cows fed BBD while data points for cows fed CBD were at a slightly higher level. Furthermore, the standard error bars were longer for BBD than for CBD. The number of daily episodes rumen pH remained <5.8 was not influenced by the grain type or method of processing. However, the average duration per episode (pH < 5.8) was greater for BBD than for CBD, but was not different between processing methods.
Effect of grain type and method of processing on rumen fermentation

RB = rolled barley; GB = ground barley; RC = rolled corn; GC = ground corn; Gr = grain type; Pr = processing; Gr × Pr = interaction between grain type and method of processing.
1Diets were rolled barley (RB), ground barley (GB), rolled corn (RC) and ground corn (GC).
2It is the mean s. d. of the daily rumen pH (1440 data points per day).
3Indicates the number of times rumen pH dropped below 5.8 during a 24 h period.
Effect of treatments on rumen pH. Diets were rolled barley, ground barley, rolled corn and ground corn. Rumen pH recorded every 30 s for 72 h using the LRCpH system was averaged for each hour and plotted. The arrows denote the time of feeding for three consecutive days.

Concentrations of rumen acetate and butyrate were greater for CBD than for BBD (Table 4) while that of propionate was greater for BBD than for CBD. Rumen acetate was greater for rolling than for grinding while those of propionate and butyrate were not different between grinding and rolling. The ratio of acetate to propionate was lower for BBD than for CBD, and a lower ratio was observed for grinding compared with rolling. The concentrations of isobutyrate and isovalerate were lower for BBD than for CBD, and for grinding compared with rolling. Total VFA however were not influenced by treatments. Rumen NH3 concentrations were greater for CBD than for BBD with greater values observed for rolling than for grinding.
Rumen FA composition
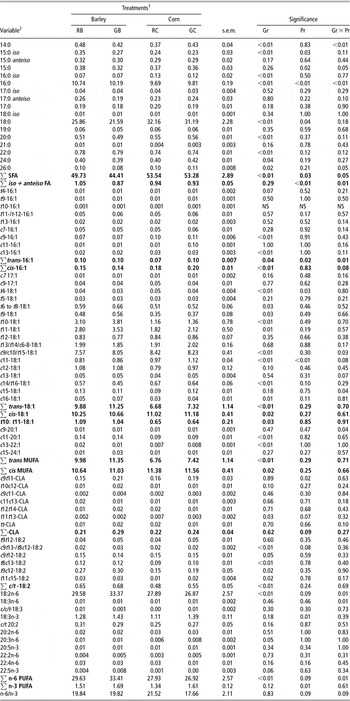
The sum of the saturated fatty acid (SFA) was greater for CBD than for BBD with greater concentrations observed for rolling than for grinding (Table 5). There was an interaction between the main effects for the concentrations of 14:0 and 16:0 in the rumen. Concentrations of 16:0 were greater for BBD than for CBD and greater for rolled compared to ground barley, while the CBD had the opposite effect. The sum of the t-18:1 isomers in rumen contents were greater for BBD than for CBD and consisted mainly of t10-18:1 and t11-18:1. The concentrations of t10-18:1 and t11-18:1 were greater for BBD than for CBD with no difference between rolling and grinding. The ratio of t10 : t11-18:1 was also greater for BBD than for CBD with no effect of processing. The sum of the c-18:1 was greater for CBD than for BBD with no effects of processing. The concentrations of c11-20:1 and c13-22:1 were greater for BBD than for CBD with no difference between rolling and grinding. The total trans-monounsaturated fatty acids (t-MUFA) content was greater for BBD than for CBD, while the total cis (c)-MUFA were lower for BBD than for CBD. The method of processing had no effect on the sum of the t-MUFA and c-MUFA. The total CLA isomer content in the rumen contents was not different between the treatments and ranged from 0.21% to 0.29%. The concentration of predominant c9t11-CLA isomer was not different between the grain types but was greater for grinding compared with rolling. The t10c12-CLA isomer was present in trace amounts (<0.02%) and showed no differences across the treatments.
Effect of grain type and method of processing on rumen fatty acid composition (g/100 g)

RB = rolled barley; GB = ground barley; RC = rolled corn; GC = ground corn; Gr = grain type; Pr = processing; Gr × Pr = interaction between grain type and method of processing.
1Diets were RB, GB, RC and GC.
2FAME=fatty acid methyl esters, expressed as a percentage of total FAME; c = cis; t = trans; CLA = conjugated linoleic acid; SFA = saturated fatty acid; MUFA = monounsaturated fatty acid; PUFA = polyunsaturated fatty acid.
Note: The bold numbers denotes the summary of each class of fatty acids.
Plasma metabolites and FA composition
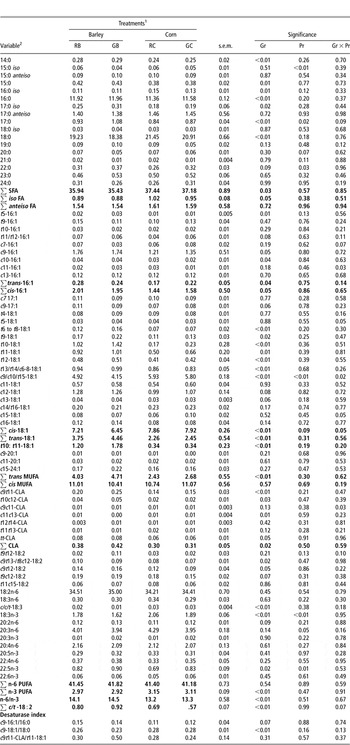
There were no main effects or interactions for the concentrations of plasma metabolites, including glucose, insulin and NEFA (Table 6). The sum of the SFA in plasma was greater for CBD than for BBD with no effect of processing (Table 7). Concentration of 18:0 was greater for CBD than for BBD while 16:0 was greater for BBD than for CBD. Concentration of 14:0 and 17:0 was greater for BBD than for CBD. The sum of the iso and anteiso FA was not influenced by the treatments. However, concentration of 15:0 iso was greater for rolling than for grinding, while 17:0 iso was greater for BBD than for CBD. The total n-6 PUFA content was not influenced by the treatments. The sum of the n-3 PUFA was greater for CBD than for BBD with no effects of processing. The main n-3 PUFA in plasma lipids were 18:3n-3, 22:5n-3 and 20:5n-3. Concentration of 18:3n-3 was greater for CBD than for BBD with greater values observed for rolling than for grinding. The n-6:n-3 PUFA ratio and the sum of all c/t-18:2 isomers were greater for BBD than for CBD, with no difference between rolling and grinding.
Effect of grain type and method of processing on plasma glucose, insulin and NEFA

RB = rolled barley; GB = ground barley; RC = rolled corn; GC = ground corn; Gr = grain type; Pr = processing; Gr × Pr = interaction between grain type and method of processing; NEFA = non-esterified fatty acids.
1Diets were RB, GB, RC and GC.
Effect of grain type and method of processing on plasma fatty acid composition (g/100 g)

RB = rolled barley; GB = ground barley; RC = rolled corn; GC = ground corn; Gr = grain type; Pr = processing; Gr × Pr = interaction between grain type and method of processing.
1Diets were RB, GB, RC and GC.
2FAME = fatty acid methyl esters, expressed as a percentage of total FAME; c = cis; t = trans; CLA = conjugated linoleic acid; SFA = saturated fatty acid; MUFA = monounsaturated fatty acid.
Note: The bold numbers denotes the summary of each class of fatty acids.
The individual t-16:1 isomers were not influenced by the treatments, except for t5-16:1, which was greater for BBD than for CBD. However, the total t-16:1 isomer content was greater for BBD than for CBD. The two major c-16:1 isomers, c9-16:1 followed by c13-16:1 showed no differences among treatments, while the minor c10-16:1 isomer was greater for BBD than for CBD, and c11-16:1 showed an interaction between the main effects. The total t-18:1 isomer content was greater for BBD than for CBD, while the sum of c-18:1 isomers was greater for CBD than for BBD; neither was affected by processing method. The t-18:1 isomers, represented mainly by t10-18:1 and t11-18:1, were greater for BBD than for CBD with no difference between rolling and grinding. The ratio of t10 : t11-18:1 was also greater for BBD than for CBD without any difference between rolling and grinding, similar to that observed in rumen contents. The concentration of the c-18:1 isomers, represented mainly by the c9-/c10-18:1 peak that could not be resolved was greater for CBD than for BBD with higher values observed for rolling than for grinding. The total t-MUFA content was greater for BBD than for CBD with no difference between rolling and grinding, while the total c-MUFA content was not influenced by the treatments. Total plasma CLA levels ranged from 0.30% to 0.42% with greater values observed for BBD than for CBD. Rumenic acid, the most abundant CLA isomer, was greater for BBD than for CBD with no difference between rolling and grinding. The concentration of t10c12 CLA was also greater for BBD than for CBD, but there was no significant processing effect.
Milk FA composition
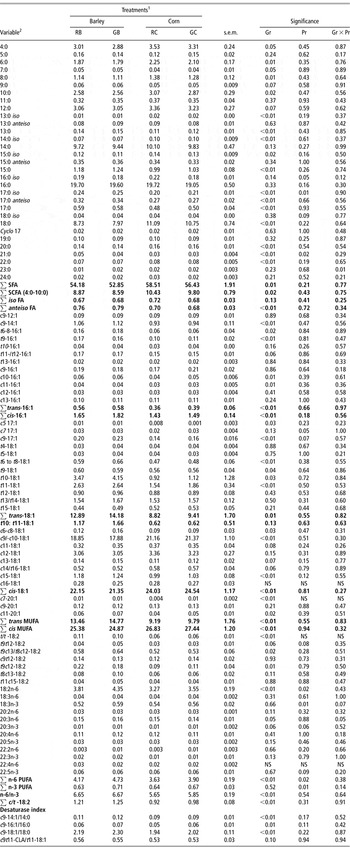
Total SFA and total short-chain fatty acid (SCFA; 4:0-10:0) were greater for CBD than for BBD (Table 8) and were not affected by processing. Concentrations of 16:0 and 14:0 were not different among the treatments, while that of 18:0 was greater for CBD than for BBD with no difference between rolling and grinding. The sum of the iso FA was not different among the treatments. However, concentrations of 13:0 iso, 14:0 iso and 15:0 iso were greater for CBD than for BBD while that of 17:0 iso was greater for BBD than for CBD. The total anteiso FA content was greater for BBD than for CBD with no difference between rolling and grinding. The total n-6 PUFA content in milk fat was greater for BBD than for CBD with greater values observed for grinding than for rolling (Table 8). The most abundant n-6 PUFA in milk fat was 18:2n-6, which showed a similar trend as that of total n-6-PUFA. With one exception, the long-chain n-6 PUFA metabolites 20:3n-6 and 20:4n-6 were not influenced by the treatments. On the other hand, the total n-3 PUFA content was not different between the grains; however, the concentrations were greater for grinding than for rolling. The most abundant n-3 PUFA in milk fat, 18:3n-3, showed a similar trend as that of total n-3 PUFA. The n-6 : n-3 PUFA ratio and sum of the c/t-18:2 isomers were greater for BBD than for CBD with no difference between the methods of processing.
Effect of grain type and method of processing on milk fatty acid composition (g/100 g)

RB = rolled barley; GB = ground barley; RC = rolled corn; GC = ground corn; Gr = grain type; Pr = processing; Gr × Pr = interaction between grain type and method of processing.
1Diets were RB, GB, RC and GC.
2FAME = fatty acid methyl esters, expressed as a percentage of total FAME; c = cis; t = trans; CLA = conjugated linoleic acid; SFA = saturated fatty acid (4 : 0 to 26 : 0 including branched chain fatty acids); SCFA = shorter-chain fatty acid; MUFA = monounsaturated fatty acid; PUFA = polyunsaturated fatty acid.
Note: The bold numbers denotes the summary of each class of fatty acids.
The total t-16:1 and c-16:1 isomers in milk fat were greater for BBD than for CBD with no difference between rolled and ground diets. Concentrations of t9-16:1 and t6-t8-16:1 were greater for BBD than for CBD. The total c-18:1 isomer content was greater for CBD than for BBD with no difference between rolling and grinding. Concentrations of c9-/c10-18:1 was greater for CBD than for BBD while that of c15-18:1 was greater for BBD than for CBD. The total t-18:1 isomer content was greater for BBD than for CBD with no difference between rolling and grinding. Among the t18:1 isomers, t6-8-, t9-, t10- and t11-18:1, as well as the t10 : t11-18:1 ratio was greater for BBD than for CBD, but none were influenced by processing method. Of the c-20:1 isomers, both c7-20:1 and c11-20:1 were greater for CBD than for BBD. The total t-MUFA content was greater for BBD than for CBD, whereas the sum of c-MUFA was greater for CBD than for BBD.
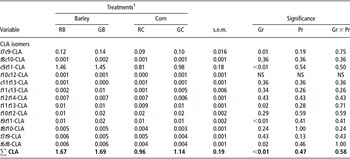
Mammary desaturase index (based on 14 : 1/14 : 0; 16 : 1/16 : 0 and 18 : 1/18 : 0 ratios) was significantly greater for BBD than for CBD (Table 8) suggesting that the conversion of t11-18:1 to RA was greater for BBD compared with CBD. Desaturase indices were, however, not different between rolling and grinding. The sum of the CLA isomers in milk ranged from 0.96% to 1.69% among the treatments with greater concentrations observed for BBD than for CBD and without any difference between rolling and grinding. Concentrations of the first most abundant CLA isomer, c9t11-CLA, and the second most abundant CLA isomer, t7c9-CLA, were greater for BBD than for CBD while those of t10c12-CLA were not influenced by the treatments (Table 9). The RA yield per 100 g total substrate intake was significantly greater for BBD than for CBD (RB = 4.49; GB = 3.56; RC = 2.39; GC = 2.72; SEM = 0.47; P = < 0.01).
Effect of grain type and method of processing on CLA isomers in milk fat (g/100 g)

RB = rolled barley; GB = ground barley; RC = rolled corn; GC = ground corn; Gr = grain type; Pr = processing; Gr × Pr = interaction between grain type and method of processing; t = trans; c = cis; CLA = conjugated linoleic acid.
1Diets were RB, GB, RC and GC.
Note: The bold numbers denotes the summary of each class of fatty acids.
Discussion
The primary objective of this study was to determine the effect of starch degradability on rumen biohydrogenation of PUFA and milk RA content. Starch degradability was varied using two sources of starch (barley and corn) and by method of processing (rolling and grinding). The diets were formulated to contain similar starch and total PUFA (LA+LNA) content. Compared to BBD, CBD required a lesser proportion of grain (40% v. 26%) to achieve similar dietary starch concentrations because of the higher starch content in corn compared with barley (76% v. 53%).
Intakes and production
The lower DMI for cows offered BBD than for those offered CBD was expected and could be attributed to greater concentrations of ruminal propionate for BBD than for CBD because propionic acid has been reported to induce hypophagia (Allen, Reference Allen2000). Similar differences in intakes for corn and barley diets were reported by McCarthy et al. (Reference McCarthy, Klusmeyer, Vicini and Clark1989), Casper et al. (Reference Casper, Schingoethe and Eisenbeisz1990) and Silveira et al. (Reference Silveira, Oba, Beauchemin and Helm2007). Greater rate of in situ starch digestion and lower minimum daily rumen pH for BBD compared with CBD provides evidence of greater degradability of barley starch than corn starch.
Grain processing by grinding has been reported to lower DMI compared with rolling for both BBD (Mathison, Reference Mathison1996) and CBD (Owens et al., Reference Owens, Secrist, Hill and Gill1997). Contrary to this, DMI in this study was not influenced by the method of processing. In situ rate of starch digestion were however greater for ground diets compared to the rolled diets. Increased rate of ingesta passage from the rumen for ground diets compared to the rolled diets may have counteracted the effects of increased rate of rumen fermentation resulting in a lack of difference in DMI between rolling and grinding. Alternatively, grinding may not have had as much impact on degradability as was expected. Studies comparing corn and barley diets that recorded greater DMI for corn than barley also observed greater milk yields for corn than for barley (McCarthy et al., Reference McCarthy, Klusmeyer, Vicini and Clark1989; Silveira et al., Reference Silveira, Oba, Beauchemin and Helm2007) which could be attributed to the greater DMI. However, in this study, milk yield was not different between BBD and CBD in spite of the greater DMI for CBD. The dietary CP contents were slightly higher for CBD than for BBD while the diets in the study of McCarthy et al. (Reference McCarthy, Klusmeyer, Vicini and Clark1989) and Silveira et al. (Reference Silveira, Oba, Beauchemin and Helm2007) were iso-nitrogenous. The lack of difference in milk yield between the treatments in spite of the greater DMI recorded for CBD could be possibly due to the higher dietary CP content of CBD compared with BBD. Higher dietary CP could reduce ME allowable milk due to additional energy required to convert excess protein into urea (National Research Council (NRC), 2001; Abdoun et al., Reference Abdoun, Stumpff and Martens2006). Lack of differences in milk yield due to processing could be attributed to the lack of difference in DMI between rolled and ground diets. The greater intakes of LA, LNA and total PUFA (LA + LNA) intake for CBD compared with BBD, in spite of the similar amounts of total substrate in the offered diets, could be attributed to the greater DMI for CBD than for BBD.
Milk fat depression
The lower milk fat content and yield for BBD compared with CBD was in agreement with the hypothesis that greater concentrations of t10-18:1 for BBD is a contributing factor. Principal component analysis of a group of studies showed that t10-18:1 was the isomer most negatively correlated with milk fat (Kadegowda et al., Reference Kadegowda, Piperova and Erdman2008). However, concentration of t10-18:1 does not explain why milk fat content was lower for ground compared with rolled diets, because milk concentrations of t10-18:1 were not affected by processing. It should be noted that there was also a lack of processing effect on the minimum rumen pH and on duration pH remained <5.8.
Several studies have associated milk fat depression with increases in milk concentrations of t10-18:1 (Griinari et al., Reference Griinari, Dwyer, McGuire, Bauman, Palmquist and Nurmela1998; Kadegowda et al., Reference Kadegowda, Piperova and Erdman2008). In contrast, Lock et al. (Reference Lock, Tyburczy, Dwyer, Harvatine, Destaillats, Mouloungui, Candy and Bauman2007), based on an infusion study, reported that t10-18:1 has no role in milk fat depression (MFD). However, the concentrations of t10-18:1 in their study was well below the threshold that was reported to induce a depression in milk fat (Kadegowda et al., Reference Kadegowda, Piperova and Erdman2008). Alternatively, it is also possible that t10-18:1 is not the only isomer responsible for MFD. Several other biohydrogenation intermediates have been associated with MFD. For instance, t10c12-CLA has been reported to induce MFD (de Veth et al., Reference de Veth, Griinari, Pfeiffer and Bauman2004; Sæbø et al., Reference Sæbø, Sæbø, Griinari and Shingfield2005). However, in our study the concentration of t10c12-CLA in milk fat was very low and was not influenced by treatments. Previous studies have also associated t6-t8-18:1 (Precht et al., Reference Precht, Hagemeister, Kanitz and Voigt2002; Loor et al., Reference Loor, Ferlay, Ollier, Doreau and Chilliard2005) and t7c9-CLA (Pottier et al., Reference Pottier, Focant, Debier, De Buysser, Goffe, Mignolet, Froldmont and Larondelle2006; Kadegowda et al., Reference Kadegowda, Piperova and Erdman2008) with MFD. We investigated the relationship between the individual isomers related to MFD. Milk fat yield was negatively related to milk concentrations of t7c9-CLA with a r 2 value of 0.21 (P = 0.01; n = 32) and to milk t6-8-18:1 with a r 2 value of only 0.17 (P = 0.02). Subsequently, step-wise regression analysis was done using milk fat yield as dependent variable and dietary factors (fiber intake, starch intake), rumen factors (rumen pH (minimum and mean) individual and total rumen VFA, acetate:propionate ratio, rumen NH3), and concentrations of total t-18:1, t4-18:1 to t16-18:1 and the t10 : t11-18:1 ratio in rumen and milk, and milk concentration of c9t11-CLA, t7c9-CLA, t10c12-CLA as independent variables. The model tested was significant (P < 0.01; R 2 = 0.55). Surprisingly none of the variables reported to be associated with MFD (t10c12-CLA (Griinari et al., Reference Griinari, Corl, Lacy, Chouinard, Nurmela and Bauman2000); t10-18:1 (Griinari and Bauman, Reference Griinari and Bauman1999); t7c9-CLA (Kadegowda et al., Reference Kadegowda, Piperova and Erdman2008)) entered the model. Starch intake contributed 45% of the variability to milk fat yield with an additional 10% contributed by milk concentrations of c9t11-CLA. Strong positive correlations between total starch intake and milk t10-18:1 concentration have been reported (Shingfield et al., Reference Shingfield, Reynolds, Lupoli, Toivonen, Yurawecz, Delmonte, Griinari, Grandison and Beever2005; Nielson et al., Reference Nielson, Straarup, Vestergaard and Sejrsen2006) and dietary sources high in starch have been related to MFD (Bauman and Griinari, Reference Bauman and Griinari2003; Nielson et al., Reference Nielson, Straarup, Vestergaard and Sejrsen2006). In this study, total starch intake was similar among the treatments; however, the depression in milk fat content (%) was greater for BBD than CBD (2.77 v. 3.28) and for ground diets compared with rolled diets (2.45 v. 2.77 for barley and 2.94 v. 3.28 for corn, respectively). The above differences between barley and corn diets indicate that it is not simply total starch intake, but starch intake together with increased rates of starch degradation that determines the severity of MFD.
Rumen fermentation
It is well established that barley starch is more rapidly and completely degraded in the rumen compared with corn starch and the differences in degradability between the two has been explained by the differences in the physical and chemical characteristics of grains (Ørskov, Reference Ørskov1986; Huntington, Reference Huntington1997). The greater rate of in situ starch degradation for RB compared with RC (25.3 v. 6.3%/h) supports the above established principle. Grinding physically reduces grain particle size thereby increasing surface area and access of starch granules to the action of rumen microbes resulting in an increase in ruminal starch digestion (Galyean et al., Reference Galyean, Wagner and Owens1981; Theurer, Reference Theurer1986). As such, the rate of in situ starch digestion for the ground diets was greater than for rolled diets.
The products of rumen fermentation have been related to the composition of the diet (Murphy, Reference Murphy1984). In general, fermentation of structural carbohydrates yields greater amounts of acetic acid and lower amounts of propionic acid compared with the fermentation of starch, which yield greater amounts of propionic acid. The greater rates of starch degradation for BBD compared with CBD led to greater propionate concentrations in the former and greater acetate concentrations for the latter consistent with the findings of previous studies (McCarthy et al., Reference McCarthy, Klusmeyer, Vicini and Clark1989; Casper et al., Reference Casper, Schingoethe and Eisenbeisz1990; Yang et al., Reference Yang, Beauchemin, Loenig and Rode1997; Khorasani et al., Reference Khorasani, Okine and Kennelly2001). Greater concentrations of acetate for rolling than for grinding and greater concentrations of propionate for grinding than for rolling could be attributed to the inverse relationship between acetate and propionate, which reflect the relative proportions of cellulolytic and amylolytic bacteria in the rumen (Knowlton et al., Reference Knowlton, Allen and Erickson1996; Dehority and Orpin, Reference Dehority and Orpin2003). A reduction in the grain particle size with grinding increases starch fermentability in the rumen resulting in an increase in propionate and a decrease in acetate. Similar findings were reported by Knowlton et al. (Reference Knowlton, Allen and Erickson1996) in their study comparing cracked corn and ground corn. Greater concentration of the branched-chain FA (isobutyric and isovaleric acid) in rumen fluid for CBD than for BBD could be due to greater protein degradation as CBD had a little higher CP content than BBD. Similarly the greater concentrations of rumen NH3 for CBD than for BBD were attributed to the higher CP content of the CBD compared with the BBD. Rumen bacteria can utilize more NH3 nitrogen for protein synthesis in the presence of readily available energy (NRC, 2001). As grinding increases fermentability of grain starch, the utilization of NH3 nitrogen for microbial protein synthesis could have been higher in ground diets compared with rolled diets resulting in lower NH3 nitrogen in ground diets than in rolled diets (Meyer et al., Reference Meyer, Bartley, Deyoe and Colenbrander1967; Shabi et al., Reference Shabi, Bruckental, Zamwell, Tagari and Arieli1999). The shift in the end products of fermentation observed in our study highlights the fact that grain source and processing affects rumen availability of carbohydrates and protein, which in turn, affects the end products of digestion (Dijkstra, Reference Dijkstra1994).
Low rumen pH has been reported to inhibit PUFA biohydrogenation (Kalscheur et al., Reference Kalscheur, Teter, Piperova and Erdman1997; Martin and Jenkins, Reference Martin and Jenkins2002). To our knowledge this is the first study to apply a continuous monitoring system to track rumen pH changes to evaluate the effect of pH on the t-18:1 and CLA isomer production in the rumen. The lower daily minimum rumen pH for BBD compared with CBD was in agreement with our hypothesis and could be attributed to greater degradability of barley starch than corn starch, evidenced by the greater in situ rate of DM and starch degradation for BBD than CBD. However, a lack of difference in the minimum rumen pH, or duration pH < 5.8 between rolled and ground diets was not anticipated. This was contrary to what we hypothesized and to the findings from the in situ rate of DM and starch degradation. It is possible that passage rate of starch from the rumen was faster for ground diets compared with the rolled diets (Shellenberger and Kesler, Reference Shellenberger and Kesler1961; Ewing et al., Reference Ewing, Johnson and Rumpler1986), which would have decreased the accumulation of VFA in the rumen thereby minimizing pH depressions.
PUFA metabolism
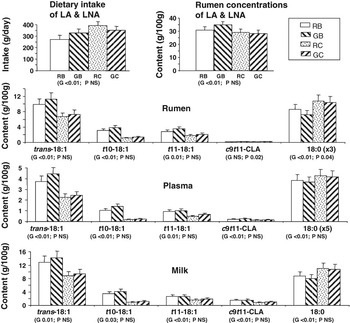
The dietary intake of total PUFA (LA + LNA), and the concentrations of LA, LNA, PUFA intermediates (t10-18:1, t11-18:1) and 18:0 in the rumen provide an indication of the extent of PUFA biohydrogenation. The BBD diet resulted in greater ruminal concentration of total PUFA (LA + LNA) and less 18:0 than the CBD diet despite greater LA intake for CBD (Figure 2). Rate of degradation of corn starch in the rumen is well known to be lower than that of barley starch and results in partial escape of corn starch from rumen fermentation (Tothi et al., Reference Tothi, Lund, Weisbjerg and Hvelplund2003). Therefore, the increased fermentability of BBD compared with CBD would have made more dietary fat available for lipase action, which explains the greater concentrations of PUFA (LA and LNA) for BBD than CBD in the rumen. A lower pH has been reported to decrease lipase activity in vitro (Van Nevel and Demeyer, Reference Van Nevel and Demeyer1996); however, its influence appeared minimal in our study since the pH differences between the two diets were relatively small compared with the larger differences in rates of DM and starch degradability. The effect of grain processing on the extent of PUFA biohydrogenation was milder and could be attributed to the lack of difference in rumen pH between rolled and ground diets.
PUFA (LA+LNA) intakes, concentration of ruminal PUFA and products of PUFA metabolism in rumen, plasma and milk among the treatments. The upper two graphs compare the dietary intake (g/day) of total PUFA (LA + LNA) and concentrations of total PUFA in rumen fluid (g/100 g). The lower three graphs compare the concentrations of PUFA metabolites in rumen fluid, plasma and milk fat or formed in tissues as in the case of c9t11-CLA. The content of 18:0 has been adjusted in rumen fluid (1/3 of true value) and plasma (1/5 of true value) to be on a similar scale.

The increased ruminal content of LA + LNA for BBD compared with CBD resulted in increased concentrations of the total t-18:1 and t-18:1 intermediates (t10- and t11-18:1), but not 18:0 (Figure 2), suggesting a greater inhibition of the reduction of t10- or t11-18:1 to 18:0 relative to CBD by the Group B bacteria (Harfoot and Hazlewood, Reference Harfoot and Hazlewood1997), recently identified as Clostridium proteoclasticum (Wallace et al., Reference Wallace, Chaudhary, McKain, McEwan, Richardson, Vercoe, Walker and Paillard2006; Paillard et al., Reference Paillard, McKain, Rincon, Shingfield, Givens and Wallace2007). A similar pattern of total t-18:1, t10-18:1, t11-18:1 and 18:0 among the diets was also evident in plasma and milk fat which was in agreement with our hypothesis (Figure 2). This is the first report showing a relative inhibition of t-18:1 to 18:0 as a result of feeding barley- compared with a CBD to dairy cows. A similar type of inhibition was observed when fish oil was included in dairy rations (Shingfield et al., Reference Shingfield, Ahvenjrvi, Toivonen, Ärölä, Nurmela, Huhtanen and Griinari2003; Kim et al., Reference Kim, Huws, Lee, Wood, Muetzel, Wallace and Scollan2008), or when DHA or EPA was added to mixed rumen cultures (AbuGhazaleh and Jenkins, Reference AbuGhazaleh and Jenkins2004). On the other hand, the RA content in rumen fluid was not affected by diet.
The feeding of BBD compared with CBD resulted in greater concentrations of total t-18:1 in rumen fluid (10.6% v. 7.0%), in the relative proportion of t10- plus t11-18:1 of total t-18:1 (62.5% v. 46.1%), and in the relative concentration of t10-18:1 of total t-18:1 (32.6% v. 18.0%) (Figure 2; Table 5). Similar differences occurred in plasma lipid (total t-18:1 (4.1 v. 2.4%); t10- plus t11-18:1 (53.1 v. 33.0%); t10-18:1 (29.5 v. 8.5%); Figure 2) and milk lipids (total t-18:1 (13.5 v. 9.1%); t10- plus t11-18:1 (47.6 v. 29.8%); t10-18:1 (28.1 v. 11.2%); Figure 2). These findings were in agreement with previous studies that showed increased concentrations of total t-18:1, t10- plus t11-18:1 and t10-18:1 rather than t11-18:1 (Piperova et al., Reference Piperova, Teter, Bruckental, Sampugna, Mills, Yurawecz, Fritsche, Ku and Erdman2000; Shingfield et al., Reference Shingfield, Reynolds, Lupoli, Toivonen, Yurawecz, Delmonte, Griinari, Grandison and Beever2005; Roy et al., Reference Roy, Ferlay, Shingfield and Chilliard2006) for dairy cows fed greater proportions of concentrate in the diet. The findings followed similar trend when the basal diet was supplemented with increasing proportions of sunflower oil (Cruz-Hernandez et al., Reference Cruz-Hernandez, Kramer, Kennelly, Glimm, Sorensen, Okine, Goonewardene and Weselake2007).
As t10-18:1 and t11-18:1 in the rumen arises from two different PUFA metabolic pathways (Griinari and Bauman, Reference Griinari and Bauman1999), differences in concentrations of these isomers among the treatments reflect a possible shift in PUFA biohydrogenating bacteria. The greater concentrations of rumen t10-18:1 for BBD compared with CBD was in agreement with our hypothesis. We also hypothesized that ruminal t10-18:1 would be greater for ground diets compared with rolled diets. Contrary to our hypothesis, t10-18:1 was not influenced by the method of processing even though in situ rates of starch degradation increased with processing. Thus, our study does not support the concept that ruminal t10-18:1 is influenced by method of processing.
An increase in ruminal t10-18:1 concentrations for diets containing lower fiber and PUFA has been reported previously (Griinari and Bauman, Reference Griinari and Bauman1999). The ratio of t10-18:1 to t11-18:1 is simply a convenient way to express the 10-trans shift. In this study, both CBD and BBD had a forage/concentrate ratio of 42 : 58, and hence relatively low fiber content. Furthermore, the intake of fiber (NDF) was similar for cows offered CBD and BBD. Therefore, increased t10-18:1 would be expected for both BBD and CBD. However, the concentrations of t10-18:1 were greater than the concentrations of t11-18:1 for BBD and vice versa for CBD in all the matrices analyzed (Figure 2; Table 5, 7 and 8). To investigate possible factors related to the concentrations of ruminal t10-18:1, a step-wise regression analysis was used with concentrations of t10-18:1 as dependent variable and dietary factors (intake of LA, LNA, total substrate (LA+LNA), starch intake, fiber intake, starch/fiber ratio, starch/substrate ratio), rumen factors (min pH, mean pH, max pH, duration pH<5.8, 5.5, 5.2, concentrations of individual VFA, total VFA, acetate: propionate ratio, rumen NH3 and sum of the iso and anteiso FA in rumen) as independent variables (n = 32). The duration rumen pH remained <5.2 (P < 0.01; R 2 = 0.75) explained 54% of the variability in t10-18:1 concentrations. Proportions of caproic acid and butyric acid in rumen fluid, which subsequently entered into the model explained an additional variation of 10% and 9%, respectively. These findings indicate that a shift in microbial populations favoring greater t10-18:1 occurred when the duration pH < 5.2 increased suggesting that increased fermentability of barley starch compared with corn starch could be responsible for the greater t10-18:1 shift for BBD than CBD.
Low rumen pH conditions are generally associated with increased growth of starch utilizing bacteria, such as Streptococcus bovis that produce lactic acid with a concomitant drop in pH (Klieve et al., Reference Klieve, Hennessy, Ouwerkerk, Forster, Mackie and Attwood2003). Under these acidic conditions, Butyrivibrio fibrisolvence, the main producer of VA (Kepler et al., Reference Kepler, Hirons, McNeill and Tove1966; Harfoot and Hazlewood, Reference Harfoot and Hazlewood1997), has been reported to drop significantly (Mackie and Gilchrist, Reference Mackie and Gilchrist1979; Klieve et al., Reference Klieve, Hennessy, Ouwerkerk, Forster, Mackie and Attwood2003). Therefore, it is reasonable to assume that bacteria other than Butyrivibrio fibrisolvence are responsible for the production of t10-18:1. There is evidence from real-time PCR techniques confirming shifts in rumen bacterial populations as a result of feeding high concentrate diets. Klieve et al. (Reference Klieve, Hennessy, Ouwerkerk, Forster, Mackie and Attwood2003) established population changes of Megasphaera elsdenii YE 34 and Butyrivibrio fibrisolvens YE 44 in the rumen of cattle fed high grain diets. Kim et al. (Reference Kim, Huws, Lee, Wood, Muetzel, Wallace and Scollan2008) showed major changes in the bacterial community within steers fed fish oil. Tajima et al. (Reference Tajima, Aminov, Nagamine, Matsui, Nakamura and Benno2001) quantified changes of up to 10 different rumen bacteria in cows with a dietary switch from hay to grain using real-time PCR technique. Boeckaert et al. (Reference Boeckaert, Vlaeminck, Fievez, Maignien, Dijkstra and Boon2008) showed that algae feeding changed the rumen FA profile and these changes were associated with changes in the bacterial community. But the challenge remains in identifying the t10-18:1 producing bacterial species under these modified rumen conditions. It was recently shown that Propionibacterium acnes produced t10c12-18:2, which is thought to be reduced to t10-18:1 (Maia et al., Reference Maia, Chaudhary, Figueres and Wallace2007; Wallace et al., Reference Wallace, McKain, Shingfield and Devillard2007). However, the P. acnes bacteria were cultured at pH 6.5 (Hobson, Reference Hobson1969), and it is not known whether they would produce t10-18:1 during the feeding of high concentrate diets. In vitro studies with mixed gut microbes reported occurrence of all possible t-18:1 isomers (Mosley et al., Reference Mosley, Powell, Riley and Jenkins2002; Proell et al., Reference Proell, Mosley, Powell and Jenkins2002), but no details were provided in their study as to which bacteria are responsible, or how a unique trans-18:1 isomer profile can be produced and maintained under specific dietary conditions.
CLA isomers
The RA yield per 100 g total PUFA (LA + LNA) intake was significantly greater for BBD than for CBD suggesting that cows offered BBD were more efficient in milk RA production. Despite lower intake of PUFA, cows fed BBD were more efficient in milk RA production, which could be attributed to the greater concentrations of milk VA and to the greater mammary desaturase index for BBD than for CBD. The former is the result of the greater fermentability of BBD that released more substrate into the rumen for biohydrogenation to VA, and the subsequent inhibition of VA reduction to 18:0 relative to the CBD diet. However, we do not know the extent to which the variability in milk RA could be attributed to the above factors. Step-wise regression analysis with the concentration of milk RA as dependent variable and dietary factors (LA intake, LNA intake, total substrate (LA + LNA) intake), rumen factors (rumen pH (minimum, mean, maximum), pH duration (<5.8, 5.5, 5.2), individual and total VFA, rumen NH3), concentrations of t10-18:1 and t11-18:1 in rumen, plasma and milk and milk desaturase indices (14:1/14:0; 16:1/16:0 and 18:1/18:0) as independent variables revealed that the model was significant (P < 0.01; R 2 = 0.99) with 94% of the variability determined by the concentrations of t11-18:1 in milk with an additional 4% variability contributed by the desaturase index (RA/VA). Repeating the regression analysis with milk t11-18:1 as dependent variable and the variables described above (except t11-18:1) as independent variables revealed that the model was significant (P < 0.01; R 2 = 0.96) with 72% of the variability in milk t11-18:1 concentrations contributed by plasma t11-18:1 and an additional 9% by rumen t11-18:1. Other variables subsequently entered into the model (variability contributed in parenthesis) were duration pH < 5.8 (5%), caproic acid proportion (4%), butyric acid proportion (2%), rumen t10-18:1 concentration (2%) and starch/fiber ratio (1%). The above findings suggest that concentrations of milk t11-18:1 and plasma t11-18:1, which are the net result of the substrate consumed and extent of biohydrogenation in the rumen, were the important determinants of milk RA.
The greater fermentability of BBD compared with CBD also resulted in increased concentrations of t7c9-CLA commonly associated with concentrate feeding (Piperova et al., Reference Piperova, Teter, Bruckental, Sampugna, Mills, Yurawecz, Fritsche, Ku and Erdman2000; Cruz-Hernandez et al., Reference Cruz-Hernandez, Kramer, Kraft, Santercole, Or-Rashid, Deng, Dugan, Delmonte and Yurawecz2006 and Reference Cruz-Hernandez, Kramer, Kennelly, Glimm, Sorensen, Okine, Goonewardene and Weselake2007). On the other hand, t10c12-CLA was present only in trace amounts, and was not affected by diet differences. This would suggest that the t10c12-CLA isomers could not explain the milk fat depression observed with the consumption of the processed starches.
Conclusions
Comparison of diets containing similar starch and total PUFA (LA + LNA) but differing in the source of starch (barley v. corn) and method of grain processing (rolling v. grinding) revealed that BBDs increased the concentrations of rumen t11-18:1 and milk RA relative to CBDs. Grain processed by grinding influenced some of the rumen fermentation end-products and reduced milk fat content compared with rolling; however, t10-18:1 and t11-18:1 in rumen contents and milk RA were not influenced by the method of processing. It was concluded that milk profiles of t-18:1 and RA were strongly influenced by the source of grain starch, and not by the method of grain processing. Factors inherent in the starch source are primarily responsible for the differences in milk t-18:1 and RA content, and these concentrations are not altered by grain processing. The milk fat depression observed in this study was related to total starch intake rather than to the t-18:1 isomers or CLA isomers typically associated with milk fat depression.
Acknowledgments
The authors acknowledge the financial support of Natural Sciences and Engineering Research Council of Canada and Alberta Milk. We appreciate the help of the Dairy Research and Technology Centre staff for the feeding and care of the experimental animals. We would like to thank Dr Barry Robinson and Mr David Gibson for nutritional advice, Dr Greg Penner for help in using the LRCpH system and Dr Laki Goonewardene, Adjunct Professor, University of Alberta, Edmonton for statistical advice. We also thank Dr Masahito Oba, Associate Professor, University of Alberta, Edmonton for his help in the in situ data analysis. R. Mohammed was the recipient of Walsh Fellowship sponsored by Teagasc.