

Introduction
Rare species are often poorly known, expressly because they are such difficult subjects for empirical research (Bower et al. Reference Bower, Brownscombe, Birnie-Gauvin, Fod, Moraga, Pusiak and Turenne2018, Siddig Reference Siddig2019). Unfortunately, the resulting condition of “data deficiency” mitigates against establishing such species as conservation priorities and undermines efforts to raise funds for conservation-driven research (Bland et al. Reference Bland, Bielby, Kearney, Orme, Watson and Collen2016, Buechley et al. Reference Buechley, Santangeli, Girardello, Neate-Clegg, Oleyar, McClure and Şekercioǧlu2019). This dynamic has recently been documented for many of the world’s raptors with restricted ranges, with tropical species found to be those worst affected (Buechley et al. Reference Buechley, Santangeli, Girardello, Neate-Clegg, Oleyar, McClure and Şekercioǧlu2019).
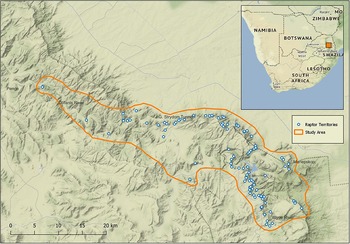
Taita Falcon Falco fasciinucha is a small, scarce, cliff-nesting raptor that occurs in eastern and southern Africa, occupying large cliffs and inselbergs possibly including southern Ethiopia and extending south to north-eastern South Africa (Figure 1) (BirdLife International 2020). Small, isolated breeding populations have been found and studied on Mount Elgon, Uganda (Möller Reference Möller1989), in the Batoka Gorge system on the Zambezi River between Zambia and Zimbabwe (Benson and Smithers Reference Benson and Smithers1958, Dowsett Reference Dowsett1983, Hustler Reference Hustler1989), in other areas of Zimbabwe (Hartley Reference Hartley1995, Reference Hartley, Chancellor and Meyburg2000, Weaver et al. Reference Weaver, Dunkley and Hartley2002), and in north-eastern South Africa (Jenkins et al. Reference Jenkins, Allan, Botha, Harvey, Kemp, Monadjem and Rodrigues2008). It has also been documented breeding at scattered localities across Kenya (Thomsett Reference Thomsett1998), Malawi (Hunter et al. Reference Hunter, Douglas, Stead, Taylor, Alder and Carter1979), Tanzania, Zambia, and Mozambique (Hartley Reference Hartley1995, BirdLife International 2020), although many of the latter records are historical and/or unverified. Most of the published research on the species is from Zimbabwe, including surveys of nesting distribution (Hartley Reference Hartley1995, Reference Hartley, Chancellor and Meyburg2000, Weaver et al. Reference Weaver, Dunkley and Hartley2002), localised studies of general biology (Hartley et al. Reference Hartley, Bodington, Dunkley and Groenewald1993), and ecological comparisons of Taita Falcon, Peregrine Falcon Falco peregrinus, and Lanner Falcon F. biarmicus (Thomson Reference Thomson, Mendelsohn and Sapsford1984, Hartley Reference Hartley, Chancellor and Meyburg2000).
General location of the survey area and the distribution of cliff-nesting raptor nesting territories located over the survey period.

Given the limited scope of this research effort, the conservation status of the Taita Falcon remains equivocal. Related themes running through the published literature on the species have included: (1) the possibility that Taita Falcon numbers may be suppressed by competition with (or even predation by) larger, sympatric congeners (Peregrine Falcon and Lanner Falcon) (Thomson Reference Thomson, Mendelsohn and Sapsford1984, Hustler Reference Hustler1989, Hartley Reference Hartley, Chancellor and Meyburg2000); (2) the possibility that Taita Falcon numbers are limited by the availability of suitable habitat, as defined by its high degree of morphological and behavioural specialisation (Thomson Reference Thomson, Mendelsohn and Sapsford1984, Hartley Reference Hartley1995, Jenkins and Hockey Reference Jenkins and Hockey2001). The recent disappearance of breeding Taita Falcon pairs from the Batoka Gorge, an area long regarded as the core of the bird’s range (Jenkins et al. Reference Jenkins, van Zyl, Magunje, Matsvimbo, Rodrigues, Robinson and Sebele2019), has prompted uplisting from “Near Threatened” to “Vulnerable” on the International Union for Conservation of Nature (IUCN) list of globally threatened species (BirdLife International 2020). However, even this most recent assessment remains compromised by deficiencies of the requisite biological and demographic information.
Taita Falcon was first recorded and confirmed as breeding on the eastern escarpment of South Africa, at the southern extreme of its range, in the late 1980s (Jenkins et al. Reference Jenkins, Wagner and Hoffman1991, Milstein Reference Milstein2000). The present study details the results of community-wide nest surveys carried out across a substantial area of cliff-rich habitat on the eastern escarpment, and models the distribution of cliff-dwelling species in relation to each other and the available habitat. The emphasis of the study is on the biotic and abiotic factors correlated with the presence or absence of Taita Falcon nesting territories, and on how such relationships might inform our understanding of the conservation status of this poorly known raptor.
Methods
Study area
The study was centred on the north-eastern Drakensberg escarpment, extending roughly between the towns of Hoedspruit in the north-east and Graskop in the south (Figure 1), and straddling the Limpopo and Mpumalanga Provinces of South Africa. The Blyde River Canyon and adjacent sections of the north-eastern Drakensberg escarpment fall within the Kruger to Canyons Biosphere Reserve, and the Blyde River Canyon Important Bird and Biodiversity Area, and include the full spectrum of woodland, forest, grassland, riparian, and cliff habitats unique to the area (Coetzer et al. Reference Coetzer, Erasmus, Witkowski and Bachoo2010, Reference Coetzer, Witkowski and Erasmus2015, Marnewick et al. Reference Marnewick, Retief, Theron, Wright and Anderson2015).
The escarpment marks the abrupt interface between the Highveld and the Lowveld, with the edge featuring grass-covered plateau-land grading into mountain peaks with broadleaved woodland and deeply incised gorges. The study area included the Blyde River Canyon Nature Reserve (24o33’S, 30o48’E), and the main escarpment cliff-line extending about 20 km south-east to just south of Mariepskop, and about 40 km north-west to the Olifants River valley (Figure 1). Altitudes on the escarpment range up to about 2,000 m above sea level (a.s.l.), mean daily temperatures vary around 5–25oC, and annual rainfall is about 900–1,000 mm, falling mainly in summer. The escarpment cliff-line itself constitutes a multi-tiered array of moderate to very high (>300 m) sheer rock faces, interspersed with steep, thickly wooded slopes, and with a total vertical extent of about 500–600 m. Two major rivers cut through the escarpment flowing roughly west to east (Olifants River) and south-east to north-west (Blyde River) (Figure 1).
The Lowveld plains beneath and to the north-east of the escarpment feature a mixture of broadleaved and Acacia woodland, with riparian forest along the larger watercourses and Afromontane forest adjacent to the escarpment in the south-east. Altitude in the Lowveld is fairly uniform at about 500–600 m a.s.l., mean daily temperatures vary around 15–30oC, and annual rainfall totals about 800 mm, most of which falls in summer. The study area also included a stretch of the Olifants River, flowing roughly west to east, from the town of Penge to the point at which the river reaches the Lowveld at the J. G. Strijdom Tunnel (Figure 1).
Field surveys
Systematic surveys of large parts of the study area were conducted in mid-September 2006 (15 days, 10 observers), mid-October 2008 (14 days, 13 observers), and late August/early September 2014 (14 days, 10 observers), with the surveys timed to coincide with the egg-laying/early incubation, late incubation/early chick-rearing, and pre-breeding/egg-laying periods of the Taita Falcon breeding cycle, respectively (Hartley et al. Reference Hartley, Bodington, Dunkley and Groenewald1993, this study). Our initial search strategy was informed by observations made previously in helicopter surveys of the general area conducted in the early-mid 1990s (e.g. Jenkins et al. Reference Jenkins, Wagner and Hoffman1991), and ground surveys conducted sporadically over the previous 15 years (e.g. Milstein Reference Milstein2000). This information was collated and mapped, and a strategy was developed for the optimal distribution of observers along cliff-lines to obtain maximum coverage of the areas considered most likely to hold breeding pairs of Taita Falcon.
Thereafter, the team of observers assembled for each survey period was daily split into multiple groups of two to three people, and each group was dispersed to selected observation points. Groups were equipped with good quality 10× binoculars, 20–60× spotting scopes, two-way radios, appropriate 1:50,000 topographical maps, and GPS units, and completed observation periods of 6–12 hours at each location. All Taita Falcon sightings were recorded in as much detail as possible, with emphasis on whether or not (1) pairs of birds were present, (2) the birds observed exhibited any breeding behaviour, and (3) definite or possible nest ledges could be identified in terms of this behaviour. Comparable data were recorded for other raptor species seen in the surveyed cliffs, namely Verreaux’s Eagle Aquila verreauxii, Jackal Buzzard Buteo rufofuscus, Peregrine Falcon Falco peregrinus, Lanner Falcon F. biarmicus, and Rock Kestrel F. rupicolus. The results of these structured surveys were supplemented by incidental observations made during Taita Falcon nest monitoring conducted annually, which occasionally included time spent by the field team at one or two cliffs not previously surveyed.
Nest-site suitability modelling
To assess factors influencing nest-site suitability we implemented a Bayesian additive regression trees (BART) approach in the statistical computing platform R (R Core Team 2021). The R package embarcadero (Carlson Reference Carlson2020) was used to implement the BART algorithm. Classification and regression tree methods, including the BART approach used in our study, are known to perform consistently well, particularly with smaller datasets, when compared with many other habitat-suitability predictive models (Redding et al. Reference Redding, Lucas, Blackburn and Jones2017. Carlson Reference Carlson2020). The consolidated survey dataset included data across a total of 112 unique raptor nest sites, which further included 262 active nesting records across the survey period (2006–2014). A binary matrix representing presence (1) and absence (0) was generated for each species from this dataset. Given the paucity of data obtained for some species, only those with >15 data points were considered. Subsequently, models were generated for Taita Falcon, Lanner Falcon, and Peregrine Falcon. Nest records were partitioned into training (80%) and testing (20%) subsamples using the Caret package (Kuhn et al. Reference Kuhn, Wing, Weston, Williams, Keefer, Engelhardt and Cooper2021).
To create final models that best represent the most relevant ecological relationships, a larger list of variables is often reduced to a core suite of the most meaningful and important variables (Harisena et al. Reference Harisena, Groen, Toxopeus and Naimi2021). Variable importance is a common metric computed in habitat suitability analysis to prioritise and rank variables (Harisena et al. Reference Harisena, Groen, Toxopeus and Naimi2021). Variable importance attempts to quantify how the inclusion or absence of a given variable influences the model predictive performance and associated uncertainty (Wei et al. Reference Wei, Lu and Song2015). Variable importance in our study was calculated and plotted using the BART package (Carlson Reference Carlson2020), which together with an associated stepwise variable selection process facilitated predictor variable selection. The stepwise selection process measures which variables are used more numerously in tree splits across the full posterior draw of trees (Carlson Reference Carlson2020). This process, together with assessing the correlation coefficients within the resulting predictor variables (Appendix 1), controlled for spatial autocorrelation across predictor variables. Spearman’s correlation coefficients across all predictors were calculated using the ENMTools R package (Warren et al. Reference Warren, Matzke, Cardillo, Baumgartner, Beaumont, Turelli and Glor2021). Limiting spatial autocorrelation in predictor variables is crucial for appropriate interpretation of variable importance and associated variable response (Naimi et al. Reference Naimi, Skidmore, Groen and Hamm2011). Response plots were used to chart the association of predicted nest-site suitability across the range of individual predictor variables retained in each respective species model.
Model performance was assessed using the receiver operating characteristic (ROC) plot, which assesses the area under the curve (AUC) (Phillips et al. Reference Phillips, Anderson and Schapire2006). AUC is a measure of the model’s ability to accurately predict true presence and absence by assessing the relationship between the true positive rate and false positive rate (Venne and Currie Reference Venne and Currie2021). An AUC value of 0.5 suggests model predictive performance is no better than random, whilst an AUC of 1 suggests perfect predictive performance (Venne and Currie Reference Venne and Currie2021). AUC was computed by the BART R package during model training, as well additionally from the independent test dataset using the R package PresenceAbsence (Freeman and Moisen Reference Freeman and Moisen2008).
Habitat loss and inter-species density simulations
The impact of both habitat loss and inter-species competition are noted as potential factors threatening the persistence of the species (Thomson Reference Thomson, Mendelsohn and Sapsford1984, Hustler Reference Hustler1989, Hartley Reference Hartley, Chancellor and Meyburg2000). We used the final Taita Falcon model generated in this study to assess this further. We simulated the impact of changes in two associated predictor variables retained in the final Taita Falcon model, namely woodland quantity and Lanner Falcon nest density, to ascertain how modelled nesting habitat suitability changes in response to shifts in the quantity of each variable. These two specific variables were chosen as they strongly influenced nest-site suitability in our study and when altered have been postulated to influence the ongoing persistence of Taita Falcon in local areas (Thomson Reference Thomson, Mendelsohn and Sapsford1984, Hustler Reference Hustler1989, Hartley Reference Hartley, Chancellor and Meyburg2000, Jenkins et al. Reference Jenkins, van Zyl, Magunje, Matsvimbo, Rodrigues, Robinson and Sebele2019). Three simulations were run for both habitat loss (woodland quantity) and inter-species (Lanner Falcon nest density) predictors, using a 10%, 25%, and 50% change in quantity of the given predictor variable. Simulations included a respective (10%, 25%, and 50%) decrease in woodland quantity or an increase in Lanner Falcon nesting density. The final Taita Falcon BART model trained with the full suite of retained variables was used to run these simulations. Simulations related to habitat change decreased woodland quantity by 10%, 25%, and 50%, whilst simulations related to inter-species associations increased Lanner Falcon nest density by 10%, 25%, and 50%, respectively. All other variables (e.g. topographical) were kept static in each respective simulation. The aim of these simulations was to gain insight into the potential threat that habitat change/loss and inter-species nesting density posed to Taita Falcon nesting suitability.
Multi-scale data processing
The ecological niche within which a species occurs is multi-faceted and often structured across varied spatial scales (Johnson Reference Johnson1980, McGarigal et al. Reference McGarigal, Wan, Zeller, Timm and Cushman2016, Rather et al. Reference Rather, Kumar and Khan2020). Multi-scale habitat selection analysis, as established by the conceptual hierarchical framework of Johnson (Reference Johnson1980), tiers spatial scales from the landscape scale to the local patch (McGarigal et al. Reference McGarigal, Wan, Zeller, Timm and Cushman2016). We implemented a multi-scale approach within our study using three hierarchical tiers based on the average territory size of each species assessed. Due to the paucity of available data related to territory size for many recorded species within the given ecosystem, we used the average recorded distance between conspecific nest sites as a proxy to define territory size. The macro scale was defined as the average breeding territory size (100%) identified in our study, the meso scale was defined as 50% of the territory size, and the micro scale was defined as 25% of the territory size. A moving window analysis was conducted for each spatial scale using the focal mean function for continuous variables in the focal statistics tool in ArcGIS Pro (ESRI 2020).
Predictor variables
To assess variables influencing nest-site suitability we generated topographical, land-cover, and intra- and inter-species predictor variables. Intra- and inter-species variables were generated from the nesting site dataset collected in this study using ArcGIS Pro. Topographical variables were generated from a 100 m digital elevation model obtained by NASA’s Shuttle Radar Topography Mission (SRTM). Land-cover data were sourced from the 2014 South African land-cover GIS layer (GeoTerraImage 2015), which was the most temporally congruent layer available given the timing of the nesting surveys (2006–2014). Topographical variables were generated using the Geomorphometry & Gradients Metrics Toolbox (Evans et al. Reference Evans, Oakleaf, Cushman and Theobald2014) in ArcGIS Pro (ESRI 2020). Variables created attempted to characterise topographical features surrounding nest sites, which included slope, slope position (SP), topographical roughness index (TRI), heat load index (HLI), and compound topographical index (CTI) (Evans et al. Reference Evans, Oakleaf, Cushman and Theobald2014). SP was used as an index of cliff size relative to the surrounding landscape, TRI characterised terrain roughness or ruggedness, HLI represented aspect and potential solar radiation received (scaled from coldest to warmest slopes), and CTI characterised areas of drainage and topographical relief (Evans et al. Reference Evans, Oakleaf, Cushman and Theobald2014).
Considering just the presence of specific habitat types within a species’ niche is only one dimension of habitat characterisation. The size, shape, number, and complexity of associated habitat patches can all play a role in driving habitat suitability for raptor species (Ferrer-Sanchez et al. 2019, Sanchez-Zapata and Calvo Reference Sanchez-Zapata and Calvo1999). Hence, we used the ZonalMetrics toolbox (Adamczyk and Tiede Reference Adamczyk and Tiede2017) to generate predictors representing landscape metrics associated with patch area and shape. Patch size (%), number of patches (NP), and edge density (ED) were generated for all spatial scales surrounding each raptor nest site identified in our study. ED represents all the edges of a specific land-cover class in relation to the overall landscape area being assessed (macro, meso, or micro spatial scale). Land-cover classes composed of larger and more contiguous habitat patches will yield lower ED values compared with more fragmented habitat patches (e.g. numerous smaller and irregularly shaped patches) within the same landscape area.
The spatial distribution of habitat, as well as intra- and inter-species interactions, are known to impact the spatial distribution and suitability of breeding habitat within cliff-nesting raptor communities (Martínez et al. Reference Martínez, Martínez, Zuberogoitia, Zabala, Redpath and Calvo2008, Rodriguez et al. Reference Rodriguez, Rodriguez and Silvero2018). In particular, the distance to the nearest conspecific can significantly impact the spatial distribution of nest sites for some species (Martínez et al. Reference Martínez, Martínez, Zuberogoitia, Zabala, Redpath and Calvo2008). Similarly, inter-species nest-site density and other interspecific interactions within the ecological community can also influence associated nest-site suitability (Rodriguez et al. Reference Rodriguez, Rodriguez and Silvero2018). Therefore, we generated distance to nearest neighbour and nest-site density predictors for each species within the raptor community. These predictors included both intra- and inter-species distances and densities for each species being modelled.
Results
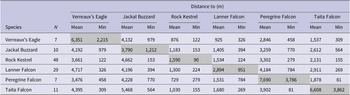
The full survey located 112 cliff-nesting raptor territories, including 11 territories of the regionally “Critically Endangered” and globally “Vulnerable” Taita Falcon. The most abundant breeding raptor recorded was Rock Kestrel (n = 48 territories), followed by Lanner Falcon (n = 29), Taita Falcon (n = 11), Jackal Buzzard (n = 10), Peregrine Falcon (n = 7), and Verreaux’s Eagle (n = 7) (Table 1). Taita Falcon yielded the greatest minimum distance between adjacent nest sites (3,862 m), with an average spacing of 6,608 m (Table 1).
Mean and minimum spacing between the composite members of the cliff-nesting raptor community on the eastern escarpment, South Africa.

Nest-site suitability modelling
The Taita Falcon model suggested a good fit, producing an AUC value of 0.98 and type I (false positives) and type II (false negatives) error rates of 0.04 and 0, respectively (Appendix 1). Variables retained following stepwise variable selection included distance to neighbouring conspecific (variable importance = 0.18), SP (0.17), HLI (0.17), percentage area (0.16), and ED (0.16) of woodland habitat, and the density of nesting Lanner Falcons (0.14) (Appendix 2). Modelled results showed that Taita Falcon nest-site suitability was strongly influenced by both intra- and inter-species associations, as well as topographical and habitat constraints. Nest-site suitability increased notably at distances exceeding 3,500 m from the nearest conspecific neighbour (Figure 2). The presence of one or more Lanner Falcon nest sites within the micro (825 m) spatial scale drastically reduced the suitability of a possible site for Taita Falcon, indicating a strong inter-species association (Figure 2). The distribution and density of the other four cliff-nesting raptor species yielded negligible variable importance during model training and therefore did not influence final nest-site suitability for Taita Falcon (Figure 2, Appendix 2). Topographical features contributing to nest-site suitability included larger and warmer cliffs, as indicated by SP and HLI, respectively (Figure 2). Lastly, the quantity and spatial distribution of woodland habitat were important predictors of nest-site suitability (Figure 2); suitability increased with woodland habitat composition exceeding c.20–40% on the meso spatial scale (1,650 m), whilst on the macro (territory) spatial scale (3,300 m), lower rates of fragmentation (ED <150,000) were important (Figure 2).
Response plots of the predictor variables identified through variable stepwise selection for the Taita Falcon nest-site suitability model. Variables retained for model training included distance (m) to nearest conspecific nest site, slope position, woodland quantity (%) on a meso scale (1,650 m), heat load index, woodland edge density (a landscape metric of fragmentation) on a macro scale (3,300 m) and Lanner Falcon nest density on a micro scale (825 m).

Available Taita Falcon nesting habitat and habitat/inter-species simulations
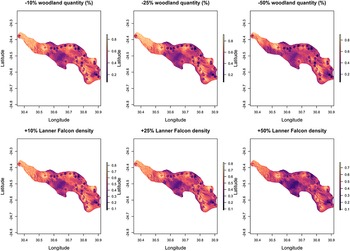
The predictive Taita Falcon model estimated that 38% (472.5 km2) of the total study area was suitable for Taita Falcons for the temporal period assessed (2014) (Figures 3 and 4). Of the suitable habitat available, only 45% (211 km2) was occupied by known Taita Falcon territories during the period of assessment, resulting in an overall occupancy rate of 21% across all habitat types in the study area. Simulated models for Taita Falcon suggest that further reductions in woodland quantity of 10%, 25%, and 50% results in a 1% (5 km2), 5% (22 km2), and 31% (145 km2) decrease, respectively, in the availability of suitable nest-site habitat for Taita Falcons (Figures 3 and 4). Similarly, simulated increases in Lanner Falcon densities resulted in an 18% (85 km2), 34% (160 km2), and 74% (351 km2) decrease in the availability of suitable habitat for Taita Falcons (Figures 3 and 4). Although the simulated change in inter-species density yielded greater impacts on Taita Falcon habitat suitability compared with habitat loss, these two factors cannot be assumed to be independent of one another, given the opposing habitat preferences of the two species (Figure 5).
Modelled nest-site suitability generated for Taita Falcon display the predicted suitability (0–1) of nesting habitat for three simulations. Simulations attempted to assess the potential impact of changes in two predictor variables, woodland quantity and Lanner Falcon density, on the nest-site suitability for Taita Falcons.

Predicted Taita Falcon habitat availability across the study area under 2014 land-cover conditions, as well as three simulated changes in the intensity of two predictor variables, namely a decrease in woodland quantity and increase in Lanner Falcon nesting density.

Response plots of the predictor variables retained following variable stepwise selection for the Lanner Falcon nest-site suitability model. Variables retained for model training included distance (m) to the nearest conspecific nest site, slope position, heat load index, quantity (%) of thicket/dense-bush on a meso scale (750 m), and quantity (%) of converted (agricultural and peri-urban) habitat on a macro scale (1,500 m).

The Lanner Falcon and Peregrine Falcon model yielded an AUC value of 0.92. Type I and II errors were 0.11 and 0.15, respectively. Like the Taita Falcon, nest-site suitability for Lanner Falcon was influenced by distance to the nearest conspecific nest site (Figures 5 and Appendix 4), increasing quite sharply at distances >1,250 m from the nearest conspecific (Figure 5). Nest-site suitability was also associated with greater topographical relief (SP) and with greater quantities of thicket-dense bush (c.>50%) on a meso (750 m) spatial scale and greater quantities of converted habitat (c.>5–10%) on a macro spatial scale (1,500 m) (Figure 5 and Appendices 5 and 6).
Discussion
The outputs of our model provided useful insights into the factors that may be contributing to the structuring of the eastern escarpment raptor community, and speak especially to the factors influencing the distribution of Taita Falcon nesting territories. The noted positive association between the nest-site suitability of Taita Falcon and the proximity of contiguous areas of unfragmented woodland and forest supports the notion that this species exhibits a measure of habitat reliance (Jenkins et al. Reference Jenkins, van Zyl, Magunje, Matsvimbo, Rodrigues, Robinson and Sebele2019). The reliance on largely intact woodland is a trait which is likely to limit the distribution of breeding pairs and possibly contribute to the relatively low quantity of suitable nesting habitat being predicted across the study area. Similarly, the noted negative association between the suitability of Taita Falcon nest-site suitability and the proximity of Lanner Falcon sites supports the notion that Taita Falcon pairs may be subordinate to and limited by the distribution of Lanner Falcon pairs (but surprisingly, not by any other cliff-nesting species, including the closely related Peregrine Falcon). These outcomes are particularly significant because of the positive association between the presence of Lanner Falcon sites and the proximity of fragmented and degraded woodland and increased quantities of converted landscapes (e.g. agriculture). While these modelled associations are not empirical evidence for causal relationships, they point to strongly opposing responses in the two species to any directional change in the availability of intact Afrotropical woodland.
Long-term monitoring has documented anthropogenic land-cover change over 36% of the total area of the Kruger to Canyons Biosphere Region (a broad-based conservation initiative spanning >2 million ha, including all of our study area), with a 7% loss of intact natural vegetation, over the period 1993–2006 (Coetzer et al. Reference Coetzer, Erasmus, Witkowski and Bachoo2010). This has been coincidental with a 52% increase in the area occupied by agriculture. Of growing concern is that these trends are mirrored in many other parts of southern and eastern Africa (e.g. Kalema et al. Reference Kalema, Witkowski, Erasmus and Mwavu2015, Shaw et al. Reference Shaw, Kibule, Nalwanga, Kaphu, Opige and Pomeroy2019, Tripathi et al. Reference Tripathi, Woollen, Carvalho, Parr and Ryan2021), where they are mainly attributed to human population growth and the coincidental spread of agriculture, rural development, and fuelwood harvesting, and linked with accelerating rates of loss of dense woodland habitat. Hence, the destruction and degradation of woodland is a documented phenomenon, both locally and across the continent, indicating that the future prognosis for the eastern escarpment Taita Falcon population, and for the species globally, may be bleak without prompt and effective conservation management.
Given ongoing limitations in capacity, time, and funding, all raptor nests could not be resurveyed annually to confirm activity. Our survey results therefore assume a level of stability in the community that may not have been applicable for all species surveyed. In particular, there is evidence that the falcon assemblage has been in a state of flux. Data from Blyde River Canyon in the 1970s and 1980s suggest Peregrine Falcon nest sites outnumbered those of Lanner Falcon by 4:1 (Tarboton and Allan Reference Tarboton and Allan1984), while our data show that Lanners now outnumber Peregrines in the Blyde River Canyon area by 3:1, and across our entire study area by as much as 4:1 (Table 1). Furthermore, in recent years at least four established Peregrine Falcon sites on the eastern escarpment have become Lanner Falcon sites, and since 2014 two and three Taita Falcon sites have become Peregrine and Lanner Falcon sites, respectively (BirdLife South Africa, unpublished data).
Our study has involved the first extensive and systematic survey of cliff-nesting raptors in what is the world’s third largest canyon. In addition to breeding colonies of the globally “Endangered” Cape Vulture Gyps coprotheres (Benson Reference Benson2015), globally “Vulnerable” Southern Bald Ibis Geronticus calvus (Colyn et al. Reference Colyn, Henderson, Altwegg and Smit-Robinson2020), and an apparently healthy breeding population of the regionally “Vulnerable” Black Stork Ciconia nigra (Marnewick et al. Reference Marnewick, Retief, Theron, Wright and Anderson2015, this study), the eastern escarpment also supports >100 breeding pairs of six species of cliff-nesting raptors. Many of these raptors are of conservation importance, including globally “Vulnerable” (Taita Falcon), regionally “Vulnerable” (Verreaux’s Eagle, Lanner Falcon), and regional endemic (Jackal Buzzard) species. The substantial numbers of breeding pairs of these species recorded by our study further reinforces the significance of the eastern escarpment for biodiversity conservation genera and confirms that the known Taita Falcon population of this area is to date one of the most substantial populations identified globally.
The allocation of resources to conservation-driven interventions is ever more dependent on (1) the broader ecological value of the implicated taxa, and (2) the weight of empirical data supporting the perceived need to take action (Bland et al. Reference Bland, Bielby, Kearney, Orme, Watson and Collen2016, Buechley et al. Reference Buechley, Santangeli, Girardello, Neate-Clegg, Oleyar, McClure and Şekercioǧlu2019). Under these conditions, securing the funding and institutional support to timeously study and conserve hyper-rare species can be extremely difficult, even though in the final analysis – perhaps after populations have dropped below critical thresholds – early perceptions of urgency are often sustained by last-minute research.
We argue that while empirical evidence for decreasing numbers of Taita Falcon from other parts of the species’ range may be lacking, there is more than sufficient evidence to uplist it to globally “Endangered” in terms of IUCN criteria (A) and (C). Criterion (A) is met by observed population trends in South Africa – 50% reduction in the number of mature individuals over 15 years assessed through monitoring efforts in the given region (BirdLife South Africa unpublished data, Taylor et al. Reference Taylor, Peacock and Wanless2015) and negative relationships with ongoing woodland clearing and proliferation of Lanner Falcon (this study, unpublished data) and Zimbabwe – 100% reduction in the number of mature individuals at Batoka Gorge over 20 years (Hartley Reference Hartley, Chancellor and Meyburg2000, Jenkins et al. Reference Jenkins, van Zyl, Magunje, Matsvimbo, Rodrigues, Robinson and Sebele2019), while criterion (C) is met because the total population size is surely <2,500 mature individuals, and no known subpopulation is >250 mature individuals. This change will correct perceptions and attendant prioritisation of the Taita Falcon in future conservation planning within its range states. Given that raptors (and falcons in particular) have recently been established as effective surrogates for the optimal identification and selection of protected areas (Santangelli and Girardello Reference Santangelli and Girardello2021), it could also encourage research on ways to exploit the species as an indicator for the protection and conservation of woodland across eastern sub-Saharan Africa.
Acknowledgements
Sincere thanks to the African Bird Club, The Peregrine Fund, Glendower Whisky, Palabora Copper (Species Champion under the BirdLife International Preventing Extinctions Programme), Beth Hackland, Josh Crickmay, and Niall Perrins for sponsoring this project. Also, thanks to Michael Kumako, the Taita Falcon guide at the J. G. Strijdom Tunnel for his valuable input, and to all the private landowners in the project area who gave us unlimited access to their farms along the escarpment. Lastly, thanks to all the contributing members of the South African Taita Falcon Survey Team – Taita Falcon Species Guardians under the BirdLife South Africa Protecting Species workstream. Over the study period these have included: Prof. Ara Monadjem, David Allan, Alan Kemp, Lucia Rodrigues, Lance Robinson, Linda van den Heever, Niall Perrins, Thabelo Sekome, Johan du Plessis, Kyle Walker, Shane McPherson, André Botha, Alan Harvey, Alan Stephenson, Hannes Marais and Dave Rushworth.
Appendices
Correlation coefficients of the final variables retained for the Taita Falcon and Lanner Falcon models. Correlation coefficients are symbolised based on value, with higher values being bolder and zero being transparent.

Taita Falcon model predictive performance summary, including the AUC–ROC curve, threshold-performance curve, and classified values. The ROC plot provides insight into model fit (top-left), threshold statistics (bottom-left) can be used to convert the continuous probability-based raster into a binary one, whilst the classified fitted values (bottom-right) display type I and type II errors associated with the model. AUC = area under the curve; ROC = receiver operating characteristic.

Variable importance plot generated for Taita Falcon, indicating which variables were retained following stepwise variable selection and the associated variable importance scores generated during model training.

Lanner Falcon model predictive performance summary, including the AUC-ROC curve, predicted probabilities for fitted values, and threshold-performance curve. The ROC plot provides insight into model fit (top-left), threshold statistics (bottom-left) can be used to convert the continuous probability-based raster into a binary one, whilst the classified fitted values (bottom-right) display type I and type II errors associated with the model. AUC = area under the curve; ROC = receiver operating characteristic.

Peregrine Falcon model predictive performance summary, including the AUC-ROC curve, predicted probabilities for fitted values, and threshold-performance curve. The ROC plot provides insight into model fit (top-left), threshold statistics (bottom-left) can be used to convert the continuous probability-based raster into a binary one, whilst the classified fitted values (bottom-right) display type I and type II errors associated with the model. AUC = area under the curve; ROC = receiver operating characteristic.

Response plots of the variables retained following variable stepwise selection for the Peregrine Falcon nest-site suitability model. Variables retained for model training included distance (m) to nearest conspecific nest site, quantity (%) of converted habitat on a micro scale (960 m), woodland edge density (i.e. fragmentation) on a macro scale (3,850 m), slope position, and number of converted habitat patches on a macro scale (3,850 m).