


1. Introduction
Insurance companies are exposed to different kinds of risk, and risk management is a fundamental aspect of the insurance business. One is financial risk, which, to a large extent, can be hedged by trading in the financial market. Another type of risk is insurance risk. In the context of life and health insurance, the insurance risk of the insurer encloses both unsystematic and systematic biometric risks. We refer to unsystematic insurance risks as the risks related to the randomness of insurance claims (for instance, the randomness of deaths in a portfolio with fixed mortality intensity Dahl & Møller, Reference Dahl and Møller2006), which may produce an adverse result for the insurance portfolio, and we assume that unsystematic insurance risks are negligible for large portfolios of insurance contracts. Such risks arise in multi-state life and health insurance as the pattern of states of the policyholder is random (Christiansen, Reference Christiansen2013). Systematic insurance risk refers to the risk associated with unpredictable changes in the insurance claims intensity, for instance, in the underlying mortality intensity, disability intensity, and lapse rate (in other words, when observing systematic deviations from expected values rather than around them Pitacco, Reference Pitacco2009), which may generate systematic divergence between anticipated and actual outcomes.
Insurance contracts are typically long-term obligations for the insurance company, and therefore, an unforeseen development of, for instance, the underlying mortality of an insurance portfolio may result in large losses and the worst-case scenario ruin, for the insurance company.
Possibilities for hedging insurance risks, especially the systematic ones, are few. One proposal is the so-called natural hedging, which utilizes that liabilities of different insurance products have different sensitivities towards changes in the underlying transition intensities of a Markov process describing the state of the policyholder. This enables the construction of portfolios of insurance products invariant to changes in the transition intensities. The typical example is in the survival model, where the liabilities of a life annuity increase (decrease) and those of a term insurance decrease (increase) when the death intensity decreases (increases). Therefore, we can construct a portfolio with a combination of the two products where the liabilities are immune to changes in the death intensity. This is denoted natural hedging and is studied in Cox & Lin (Reference Cox and Lin2007) and Wang et al. (Reference Wang, Huang, Yang and Tsai2010). Natural hedging in a multi-state setup with the possibility to hedge disability risks is studied in Levantesi & Menzietti (Reference Levantesi and Menzietti2017) and Nyegaard (Reference Nyegaard2022). Natural hedging is an insufficient tool for risk management of systematic insurance risks since the optimal natural hedging portfolios differ a lot from the demands of the insurance market.
Another proposal is in with-profit life insurance, where systematic insurance risks are handled by choosing prudent transition intensities for pricing insurance benefits. The expected surplus is then returned to the policyholders as a bonus. For a long-term agreement, as an insurance contract typically is, what seems safe-side transition intensities at initialization may not be on the safe side 20 or 30 years later. This is, for instance, the case for death rates, where longevity improvements have occurred faster than expected during the last 40 years.
What constitutes safe-side transition intensities depends on the insurance product. For a life annuity, a low death intensity is on the safe side, while a high death intensity is on the safe side for term insurance. Insurance companies face different types of risks, and what is characterized as an adverse development of future transition intensities varies from company to company. Therefore, the demand for hedging systematic insurance risks depends on the type of business.
In life and health insurance, the main challenge consists of managing longevity and disability risks, which, for their systematic nature, cannot be mitigated through ordinary diversification strategies. Alternative risk transfer allows life and health insurers to hedge longevity and disability risk without transferring the entire insurance portfolio. The need to manage these systematic risks is growing as the demand for disability insurance policies has risen globally. Existing literature on this topic focuses on mortality-linked securities to hedge mortality or longevity risks in the survival model. Two examples of traded mortality-linked securities, the Swiss Re mortality bond and the EIB/BNP longevity bond, are discussed in Blake et al. (Reference Blake, Cairns and Dowd2006). In general, Blake et al. (Reference Blake, Cairns and Dowd2006) and (Reference Blake, Cairns, Dowd and Kessler2019) discuss the concept of and the issues that arise with mortality-linked securities. Mortality-linked securities are also studied by Dahl (Reference Dahl2004) and Lin & Cox (Reference Lin and Cox2005). Pricing of mortality-linked securities requires a stochastic model of the mortality intensity. Biffis (Reference Biffis2005) studies affine models of the mortality intensity and Luciano et al. (Reference Luciano, Spreeuw and Vigna2008) model mortality intensities for dependent lives.
Although the longevity market is growing, it is not yet well-developed enough to be a liquid and mature market. However, since the insurance and reinsurance industry has insufficient capital to cope with longevity risk, there is the belief that longevity will become a new asset class this century (Blake, Reference Blake2018). The same cannot be asserted for the development of the disability market. While Blake (Reference Blake2018) describes the conditions for a new capital market for longevity securitization to succeed, Maegebier (Reference Maegebier2015) provides a theoretical discussion of the potential use of disability-linked securities, highlighting benefits and disadvantages. From the analysis by Maegebier (Reference Maegebier2015), the main reasons having discouraged the development of disability risk securitization until now seem to be the national segmentation of the disability products, the different disability definitions, and related documentation. A standard definition of disability, increasing market transparency and data availability, would augment the market liquidity for potential disability-linked securities, consequently promoting future alternative risk transfer for disability insurance. The above considerations highlight the importance of designing and studying the securitization of the various systematic risks affecting a life or health portfolio, such as longevity risk and disability risk.
This paper aims to go beyond the survival model and investigate how to manage systematic insurance risks in a multi-state setup by studying securities linked to the model’s transition intensities and not only securities linked to mortality in the survival model. Disability-linked securities are studied by D’Amato et al. (Reference D’Amato, Levantesi and Menzietti2020) as a possibility to hedge systematic disability risks for long-term care insurance modeled in discrete time. Our formulation applies to any choice of state space of the Markov model, and we study de-risking in life and health insurance in continuous time. Therefore, the proposed model can be used to securitize all those insurance products based on a multi-state model, for example, long-term care insurance and dread disease insurance.
In this paper, we consider a multi-state setup in continuous-time life and health insurance, where the state of the insured is modeled by a continuous-time Markov process. We model the vector of transition intensities of the Markov process,
 $\mu$
, by a diffusion process, and develop a model for the unfunded liabilities quantifying the systematic insurance risk of the insurance company. The insurance company faces a potential loss if the liabilities exceed the assets, that is, the unfunded liabilities are positive. The unfunded liabilities are affected by the stochastic process
 $\mu$
, and if
 $\mu$
behaves adversely, the insurance company may face a loss. Hence, it would be convenient for the insurance company if there existed a market for
 $\mu$
-linked securities to be able to minimize the risk of a potential loss and for risk management purposes. We assume in the paper that there exists a market for trading two types of
 $\mu$
-linked securities, the de-risking option and the de-risking swap, and describe the optimization problem faced by the insurance company to choose the optimal amount of de-risking. The purpose of the model is to quantify systematic insurance risks in a multi-state setup and identify the kinds of hedging strategies that minimize risks. We illustrate the de-risking strategies in a numerical example in the disability model. The numerical example is based on the stochastic model for the transition intensities. We model the transition intensities in the disability model (the transition from active to disabled and the transition from active to dead) with a Cox-Ingersoll-Ross process, and estimate the parameters on data of a cohort of the Italian population qualified for a disability benefit paid by the Italian Government to disabled people.
The stochastic process
 $\mu$
is, in contrast to for instance stock prices and interest rates, not observable, and it is based on assumptions about the state space and possible transitions of the insured. There exist a lot of statistical methods to estimate
 $\mu$
and a derivative with
 $\mu$
as the underlying is special since its value depends on the data from which
 $\mu$
is estimated. This introduces basis risk for an insurance company buying the derivative if the portfolio of the insurance company differs from the data basis of the derivative. We disregard this kind of basis risk in our model.
The structure of the paper is as follows. In Section 2, we introduce the double-stochastic multi-state Markov setup and model the assets, the liabilities, and the unfunded liabilities. Section 3 introduces the de-risking strategies: the de-risking option and the de-risking swap. The optimization problem is described in Section 4. In Section 5, we illustrate the de-risking strategies in a numerical example. Section 6 concludes the paper.
2. Setup
2.1 Doubly-stochastic Markov setup
Let
 $(\Omega, \mathbb{F}, \mathbb{P})$
be a probability space, and
 $\mathcal{J} = \lbrace 0, 1, \ldots, J \rbrace$
be some finite state space. As in Buchardt et al. (Reference Buchardt, Furrer and Steffensen2019), we consider a doubly-stochastic Markov setup, where the state of the holder of an insurance contract is described by a stochastic (jump) process on
 $(\Omega, \mathbb{F}, \mathbb{P})$
taking values in
 $\mathcal{J}$
. The number of possible transitions in the state-space is denoted by
 $K$
, and we consider a
 $K$
-dimensional stochastic process
 $\mu = (\mu _{jk})_{j,k \in \mathcal{J}, j \neq k}$
on
 $(\Omega, \mathbb{F}, \mathbb{P})$
with continuous, non-negative sample paths taking values in
 $[0, \infty )^K$
. For each
 $j, k \in \mathcal{J}$
, the process
 $\mu _{jk}$
relates to the instantaneous transition rate of a continuous time, finite-state Markov chain with state space
 $\mathcal{J}$
. The dynamics of
 $\mu$
are assumed to be in the form
 \begin{align} \text{d} \mu (t) = \alpha ^\mu (t, \mu (t)) \text{d} t + \sigma ^\mu (t, \mu (t)) \text{d} W(t), \end{align}
where
 $W$
is a
 $P$
dimensional Brownian motion,
 $\alpha ^\mu : [0, \infty )^{K + 1} \mapsto \mathbb{R}^K$
is a deterministic and sufficiently regular function satisfying the Lipschitz condition, and
 \begin{align*} \sigma ^\mu (t, \mu ) = \begin{pmatrix} \sigma ^\mu _{11}(t, \mu ) & \quad \sigma ^\mu _{12}(t, \mu ) & \quad \ldots & \quad \sigma ^\mu _{1P}(t, \mu ) \\[3pt] \sigma ^\mu _{21}(t, \mu ) & \quad \ddots & \quad & \quad \vdots \\[3pt] \vdots & \quad & \quad \ddots & \quad \vdots \\[3pt] \sigma ^\mu _{K1}(t, \mu ) & \quad \sigma ^\mu _{K2}(t, \mu ) & \quad \ldots & \quad \sigma ^\mu _{KP}(t, \mu ) \end{pmatrix}, \end{align*}
for deterministic and sufficiently regular functions
 $\sigma ^\mu _{ij} : [0, \infty )^{K + 1} \mapsto [0, \infty )$
, satisfying the Lipschitz condition to ensure the uniqueness of the solution. Furthermore, we assume that
 $\alpha$
and
 $\sigma$
are chosen such that
 $\mu (t) \in [0, \infty )^K$
almost surely. We omit the age of the insured in the notation since we assume it is a one-cohort model where the age of the insured is
 $x_0$
at time 0. The extension to also account for a multiple-cohort model requires that we include age as a parameter in
 $\mu$
and the coefficients
 $\alpha$
and
 $\sigma$
.
The assumption that the transition intensities are modeled by a diffusion process is in line with assumptions on the models of the mortality intensity for instance Dahl (Reference Dahl2004) and Jevtić et al. (Reference Jevtić, Luciano and Vigna2013). Luciano et al. (Reference Luciano, Spreeuw and Vigna2008) have a similar model for the mortality intensity, where a jump measure in the dynamics of the mortality intensity is included. The natural filtration generated by the stochastic process
 $\mu$
is
 $\mathcal{F}^\mu = \big ( \mathcal{F}^\mu _t \big )_{t \geq 0}$
, where
 $\mathcal{F}^\mu _t = \sigma (\mu (s) : 0 \leq s \leq t)$
, and we interpret
 $\mathcal{F}^\mu$
as all information about
 $\mu (t)$
for
 $t \in [0, \infty )$
. We assume that
 $\mathcal{F}^\mu$
is an augmented filtration satisfying the usual conditions.
Similar to Buchardt et al. (Reference Buchardt, Furrer and Steffensen2019), we can construct a jump process
 $Z = \big ( Z(t) \big )_{t \geq 0}$
on
 $(\Omega, \mathbb{F}, \mathbb{P})$
taking values in
 $\mathcal{J}$
with
 $Z(0) = 0$
, where
 $Z$
conditional on
 $\mathcal{F}^\mu$
is a continuous-time Markov chain with transition intensities
 $\mu$
. We assume that
 $Z$
indicates the state (e.g. Active, Disabled, or Dead) of the holder of an insurance contract who is
 $x_0$
years old at time
 $t = 0$
. The natural filtration generated by
 $Z$
is given by
 $\mathcal{F}^Z = \big ( \mathcal{F}^Z_t \big )_{t \geq 0}$
, and we interpret
 $\mathcal{F}^Z$
as information about
 $Z(s)$
for
 $s \in [0, t]$
. There exist transition probabilities of
 $Z$
conditional on
 $\mu$
given by
 \begin{align*} \mathbb{P} \big ( Z(s) = j \ \big | \ \mathcal{F}^Z_t, \mathcal{F}^\mu \big ) = \mathbb{P} \big ( Z(s) = j \ \big | \ Z(t), \mathcal{F}^\mu \big ) \,:\!=\, p^\mu _{Z(t)j}(t, s), \end{align*}
since
 $Z$
is Markov conditional on
 $\mathcal{F}^\mu$
. The fact that
 $Z$
has transition intensities
 $\mu$
conditional on
 $\mathcal{F}^\mu$
implies that
 \begin{align*} \mu _{ij}(t) = \lim _{h \downarrow 0} \frac{p^\mu _{ij}(t, t + h)}{h}, \end{align*}
for all
 $t \geq 0$
, and
 $i,j \in \mathcal{J}$
,
 $i \neq j$
. The transition probabilities conditional on
 $\mu$
satisfy Kolmogorov’s backward and forward differential equations. We introduce the processes
 $N^k(t)$
that count the number of jumps of
 $Z$
into state
 $k \in \mathcal{J}$
up to and including time
 $t$
 \begin{align*} N^k(t) = \# \big \{ s \in (0, t] \ \big | \ Z(s-) \neq k, Z(s) = k \big \}, \end{align*}
where
 $Z(s-) = \lim _{h \downarrow 0} Z(s - h)$
. If
 $\mu$
is a deterministic process, this setup corresponds to the classical Markov chain setup in life insurance as described in, for example, Hoem (Reference Hoem1969) and Norberg (Reference Norberg1991).
2.2 Insurance contract
Now, we model the payments of an insurance contract. Payments link to sojourns in states and transitions between states and therefore payments depend on
 $Z$
. The payment stream has dynamics
 \begin{align*} \text{d} B(t) = b_{Z(t)}(t) \text{d} t + \sum _{k: k \neq Z(t-)} b_{Z(t-)k}(t) \text{d} N^k(t), \end{align*}
where
 $b_j$
and
 $b_{jk}$
for
 $j,k \in \mathcal{J}$
,
 $j \neq k$
are deterministic functions. The payments
 $b_j$
link to continuous benefits or premiums during the sojourn in state
 $j$
, and the payments
 $b_{jk}$
link to payments upon transition from state
 $j$
to state
 $k$
. Benefit payments are positive and premium payments are negative. In general,
 $b_j(t)$
and
 $b_{jk}(t)$
can be stochastic processes adapted to
 $\mathcal{F}^Z_t$
.
2.3 Assets and liabilities
The basis of our model is an insurance company that sells insurance contracts with payments specified by
 $\text{d} B(t)$
to a cohort of policyholders aged
 $x_0$
at time
 $t = 0$
. The assets and liabilities of the insurance company are affected by the underlying mortality rate, disability rate, etc. of the portfolio modeled by the stochastic process
 $\mu$
. Hence, the insurance company is exposed to systematic insurance risks if its valuation basis differs from the realized
 $\mu$
. We assume that the portfolio is large such that unsystematic insurance risks are negligible. We aim to quantify the effect of systematic insurance risks on the assets and liabilities of the portfolio under the assumption that
 $\mu$
is modeled by Equation (1). Insurance companies are also exposed to financial risks. Since the focus of this paper is the hedging of systematic insurance risks, we assume that the interest rate is a deterministic function
 $t \mapsto r(t)$
and that the insurance company invests in an account with interest rate
 $r(t)$
. The interest rate
 $r(t)$
is also used for discounting the value of future payments. The deterministic assumption on the interest rate is not realistic in practice. In the paper, we use a deterministic interest rate as it provides clearer and easier-to-interpret results. However, all the results in the paper can be generalized to a stochastic model of the interest rate and the financial market.
2.3.1 Model of the assets
The expected assets at time
 $t$
are given by the expectation of premiums minus benefits in the interval
 $[0, t]$
accumulated with the interest rate. We denote the expected assets at time
 $t$
by
 $\tilde{A}(t)$
 \begin{align} \tilde{A}(t) = A_0 e^{\int _0^t r(u) \text{d} u} + \mathbb{E} \bigg [ \int _0^t e^{\int _s^t r(u) \text{d} u} \big ({-} \text{d} B(s) \big ) \bigg ], \end{align}
where
 $A_0$
is the initial assets. The assets depend on the stochastic process
 $\mu$
since the payment stream depends on
 $Z$
, which in the doubly-stochastic Markov setup, depends on
 $\mu$
. Calculation of the expectation in Equation (2) is non-trivial, and instead of focusing on
 $\tilde{A}(t)$
, we study the expected assets conditioned on
 $\mu$
 \begin{align*} A(t) = A_0 e^{\int _0^t r(u) \text{d} u} + \mathbb{E} \bigg [ \int _0^t e^{\int _s^t r(u) \text{d} u} \big ({-} \text{d} B(s) \big ) \ \bigg | \ \mathcal{F}^\mu \ \bigg ], \end{align*}
with the relation
 \begin{align*} \tilde{A}(t) = \mathbb{E}\big [ A(t) \big ]. \end{align*}
Due to the Markov property of
 $Z$
conditioned on
 $\mu$
and that
 $Z(0) = 0$
, we have that
 \begin{align*} A(t) = A_0 e^{\int _0^t r(u) \text{d} u} - \int _0^t e^{\int _s^t r(u) \text{d} u} \sum _{i \in \mathcal{J}} p^\mu _{0i}(0, s) \left( b_i(s) + \sum _{j: j \neq i} \mu _{ij}(s) b_{ij}(s) \right) \text{d} s. \end{align*}
2.3.2 Model of the liabilities
The liabilities are the expected present value of future payments of the insurance contract. We assume that the insurance company uses a deterministic valuation basis for the calculation of the liabilities given by assumptions on the interest rate
 $\hat{r}(t)$
and assumptions on the transition intensities
 $\hat{\mu }(t)$
. We assume that
 $\hat{r}(t) = r(t)$
and that
 $\hat{\mu }(t)$
is deterministic and independent of the stochastic process
 $\mu$
. The assumption that the valuation basis
 $\hat{\mu }(t)$
is deterministic and fixed in the entire time horizon of the insurance contract is strict, in the sense that in the real world, the insurance company would update its valuation basis based on the development of its insurance portfolio. A less strict assumption would be to let the valuation basis be stochastic, but such that the valuation basis determined at time
 $t$
is measurable with respect to
 $\mathcal{F}^\mu _t$
, and therefore a deterministic function of
 $\mu (t)$
at time
 $t$
.
With deterministic transition intensities, we are in the classical Markov chain setup in life insurance. The liabilities at time
 $t$
are given by
 \begin{align*} \mathbb{E}^{\hat{\mu }} \bigg [ \int _t^n e^{-\int _t^s r(u) \text{d} u} \text{d} B(s) \ \bigg | \ \mathcal{F}^Z_t \ \bigg ] = \mathbb{E}^{\hat{\mu }} \bigg [ \int _t^n e^{-\int _t^s r(u) \text{d} u} \text{d} B(s) \ \bigg | \ Z(t) \ \bigg ] \,:\!=\, \hat{V}^{Z(t)}(t), \end{align*}
where the superscript
 $\hat{\mu }$
denotes that
 $Z$
has transition intensities
 $\hat{\mu }$
. The state-wise liabilities,
 $\hat{V}^i(t)$
, where we condition on
 $Z(t) = i$
for
 $i \in \mathcal{J}$
, are deterministic and satisfy Thiele’s differential equation
 \begin{align} & \frac{\text{d}}{\text{d} t} \hat{V}^i(t) = r(t) \hat{V}^i(t) - b_i(t) - \sum _{j: j \neq i} \hat{\mu }_{ij}(t) \hat{R}^{ij}(t), \\ & \hat{V}^i(n) = 0, \nonumber \end{align}
where
 $\hat{R}^{ij}$
is the sum-at-risk upon transition from state
 $i$
to state
 $j$
and is given by
 \begin{align} \hat{R}^{ij}(t) = b_{ij}(t) + \hat{V}^j(t) - \hat{V}^i(t). \end{align}
The liabilities at time
 $t$
depend on the state of the insured at time
 $t$
,
 $Z(t)$
, and are therefore stochastic. Hence in the doubly-stochastic Markov model, the liabilities depend on the stochastic process
 $\mu$
. Similar to the model of the assets, we model the expected liabilities at time
 $t$
 \begin{align*} \tilde{V}(t) = \mathbb{E}\big [ \hat{V}^{Z(t)}(t) \big ] = \mathbb{E}\big [ V(t) \big ], \end{align*}
for
 \begin{align*} V(t) = \mathbb{E}\big [ \hat{V}^{Z(t)}(t) \ \big | \ \mathcal{F}^\mu \ \big ] = \sum _{i \in \mathcal{J}} p_{0i}^\mu (0, t) \hat{V}^i(t). \end{align*}
2.3.3 The unfunded liabilities
The insurance company faces a potential loss or gain if the development of
 $\mu$
is different from the valuation basis
 $\hat{\mu }$
. We aim to quantify the loss or gain as a basis for deciding whether a de-risking strategy described in Section 3 is useful for the insurance company. The expected unfunded liabilities at time
 $t$
are given by
 \begin{align*} \tilde{L}(t) = \tilde{V}(t) - \tilde{A}(t) = \mathbb{E}\big [ L(t) \big ], \end{align*}
for
 $L(t) = V(t) - A(t)$
. We refer to
 $L(t)$
as the unfunded liabilities. If the unfunded liabilities are positive, the insurance company faces a potential loss, since the liabilities exceed the assets, and the insurance company faces a potential gain if
 $L(t)$
is negative. Using Kolmogorov’s forward differential equations for the transition probabilities and Thiele’s differential equation in Equation (3) we obtain that
 \begin{align} \frac{\text{d}}{\text{d} t} L(t) =&\ r(t) L(t) + \sum _{i \in \mathcal{J}} \sum _{j: j \neq i} p_{0i}^\mu (0, t) \big (\mu _{ij}(t) - \hat{\mu }_{ij}(t) \big ) \hat{R}^{ij}(t), \nonumber \\ =&\ r(t) L(t) + \sum _{i \in \mathcal{J}} \sum _{j: j \neq i} l_{ij}(t), \\ L(0) =&\ \hat{V}^0(0) - A_0, \nonumber \end{align}
for
 $l_{ij}(t) = p_{0i}^\mu (0, t) \big (\mu _{ij}(t) - \hat{\mu }_{ij}(t) \big ) \hat{R}^{ij}(t)$
.
The differential equation in Equation (5) above yields that the unfunded liabilities gain interest rate and increase or decrease with a rate,
 $l_{ij}(t)$
, that is a probability-weighted sum of all possible transitions in the state space with terms that depends on the difference between the stochastic transition intensity,
 $\mu _{ij}$
, and the transition intensity from the valuation basis,
 $\hat{\mu }_{ij}$
, times the sum-at-risk. The rate
 $l_{ij}(t)$
is similar to the surplus contribution rate (see e.g. (3.7) in Norberg, Reference Norberg1999) in with-profit life insurance, where the surplus increases due to the difference between prudent technical transition intensities used for pricing and the best estimate market transition intensities used for valuation.
The unfunded liabilities have a solution given by
 \begin{align} L(t) = \left(\hat{V}^0(0) - A_0\right)e^{\int _0^t r(u) \text{d} u} + \int _0^t e^{\int _s^t r(u) \text{d} u} \sum _{i \in \mathcal{J}} \sum _{j: j \neq i} l_{ij}(s) \text{d} s. \end{align}
The representations in Equations (5) and (6) illustrate what affects the unfunded liabilities, and the effect is highest when the difference between
 $\mu$
and
 $\hat{\mu }$
is large. For instance, if the realized mortality or disability rates of the insurance portfolio differ from the rates in the valuation basis. The unfunded liabilities are stochastic since they depend on
 $\mu$
, and the insurance company faces a potential loss upon an adverse development of
 $\mu$
. Therefore, the insurance company has an interest in hedging the unfunded liabilities against systematic insurance risks.
3. De-risking strategies
In this section, we introduce
 $\mu$
-linked securities as a risk management tool for insurance companies to reduce systematic insurance risks. We assume that the insurance company can invest in
 $K$
 $\mu$
-linked securities each of them paying a continuous rate or cash flow of
 $d_{ij}\big (t, \mu _{ij}(t)\big )$
for
 $i,j \in \mathcal{J}$
,
 $i \neq j$
. There is a risk that the counterpart providing the de-risking defaults. This is denoted credit risks and is not studied here. D’Amato et al. (Reference D’Amato, Levantesi and Menzietti2020) implement the possibility that the counterpart defaults in their model as a binomial variable in discrete time.
If the insurance company invests in the securities for de-risking purposes, the unfunded liabilities including de-risking are given by
 \begin{align*} L^D(t) =&\ L(t) - \sum _{i \in \mathcal{J}} \sum _{j: j \neq i} h_{ij} D_{ij}(t), \\ =&\ \left(\hat{V}^0(0) - A_0\right)e^{\int _0^t r(u) \text{d} u} + \int _0^t e^{\int _s^t r(u) \text{d} u} \left( \sum _{i \in \mathcal{J}} \sum _{j: j \neq i} \big (l_{ij}(s) - h_{ij} d_{ij}(s, \mu _{ij}(s))\big ) \right) \text{d} s. \end{align*}
where
 $h_{ij}$
is the amount of
 $\mu _{ij}$
-linked security bought. Let
 \begin{align*} l^D_{ij}\left(t, \mu _{ij}(t)\right) = l_{ij}(t) - h_{ij} d_{ij}\left(t, \mu _{ij}(t)\right). \end{align*}
We define the hedging price of the
 $\mu _{ij}$
-linked de-risking strategy,
 $P_{ij}$
, as the sum of the expected present value of the payments of the derivative and the hedging costs,
 \begin{align*} P_{ij} = h_{ij} \bigg ( a_{ij} + \mathbb{E}\bigg [ \int _0^n e^{- \int _0^t r(u) \text{d} u} d_{ij}(t, \mu _{ij}(t)) \text{d} t \bigg ] \bigg ), \end{align*}
where
 $a_{ij}$
is the hedging cost for the derivative with cash flow
 $d_{ij}(t, \mu _{ij}(t))$
. The hedging costs are a risk premium on top of the expected value of the de-risking cash flow for the counterpart to take in the risk.
We consider two different types of de-risking strategies with different choices of
 $d_{ij}(t, \mu _{ij}(t))$
. The first is a de-risking option, and the second is a de-risking swap, and we discuss the advantages and drawbacks of each type.
3.1 De-risking option
The insurance company is interested in hedging against a scenario where
 $\mu$
differs a lot from
 $\hat{\mu }$
since then the insurance company faces a potential loss. A possible choice of
 $d_{ij}(t, \mu _{ij}(t))$
is
 \begin{align} d_{ij}^{\text{call,R}}(t, \mu _{ij}(t)) = \max \lbrace \mu _{ij}(t) - \hat{\mu }_{ij}(t), 0 \rbrace \hat{R}^{ij}(t), \end{align}
with a European call option structure exercised at time
 $t$
with strike
 $\hat{\mu }_{ij}$
. For this de-risking option, the rate
 $l^D_{ij}(t, \mu _{ij}(t))$
becomes
 \begin{align*} l_{ij}^D(t, \mu _{ij}(t)) = \begin{cases} (p^\mu _{0i}(0, t) - h_{ij})(\mu _{ij}(t) - \hat{\mu }_{ij}(t)) \hat{R}^{ij}(t), \quad &\text{if } \mu _{ij}(t) \gt \hat{\mu }_{ij}(t)\\[5pt] - p^\mu _{0i}(0, t) (\hat{\mu }_{ij}(t) - \mu _{ij}(t))\hat{R}^{ij}(t), \quad &\text{if } \mu _{ij}(t) \leq \hat{\mu }_{ij}(t) \end{cases} \end{align*}
The rate above is always negative if
 $h_{ij} \gt p^\mu _{ij}(0, t)$
and if the sum-at-risk,
 $\hat{R}^{ij}(t)$
, is positive. The sign of the sum-at-risk depends on the insurance product, and it is possible that
 $\hat{R}^{ij}(t)$
is positive for some
 $t \in [0, n]$
and negative for others. The insurance company should only choose to invest in a de-risking option with a call option structure if the sum-at-risk is positive. Otherwise, the investment increases the unfunded liabilities and introduces basis risk for the insurance company. If the sum-at-risk is negative, a European put option structure is preferred to minimize
 $l^D_{ij}(t, \mu _{ij}(t))$
 \begin{align} d_{ij}^{\text{put,R}}(t, \mu _{ij}(t)) = - \max \lbrace \hat{\mu }_{ij}(t) - \mu _{ij}(t), 0 \rbrace \hat{R}^{ij}(t). \end{align}
To make a perfect hedge of the rate
 $l_{ij}$
in the unfunded liabilities, the transition probabilities should be included in the de-risking cash flow. This is not possible, since we assume that
 $d_{ij}(t, \mu _{ij}(t))$
depends on
 $\mu _{ij}(t)$
and
 $p^\mu _{ij}(0, t)$
depends on other transition intensities as well.
Here, the cash flow of the de-risking option depends on the sum-at-risk of an insurance product, such that the option is designed to reduce systematic insurance risks of a specific product. Another possibility is a de-risking option where the rate only depends on the difference between the stochastic
 $\mu$
and
 $\hat{\mu }$
. This introduces more basis risk for the insurance company since the option is not designed for a specific insurance product, but for the counterpart selling de-risking strategies, it is a more liquid product. In this case, the European call option structure is
 \begin{align} d_{ij}^{\text{call}}(t, \mu _{ij}(t)) = \max \lbrace \mu _{ij}(t) - \hat{\mu }_{ij}(t), 0 \rbrace, \end{align}
and the European put option structure is
 \begin{align} d_{ij}^{\text{put}}(t, \mu _{ij}(t)) = \max \lbrace \hat{\mu }_{ij}(t) - \mu _{ij}(t), 0 \rbrace. \end{align}
If the sum-at-risk,
 $\hat{R}^{ij}(t)$
, for the transition from state
 $i$
to state
 $j$
is positive at time
 $t$
, the insurance company should buy the European call option, since it faces a potential loss if
 $\mu _{ij}$
exceeds
 $\hat{\mu }_{ij}$
, and the insurance company should by the European put option if
 $\hat{R}^{ij}(t)$
is negative.
D’Amato et al. (Reference D’Amato, Levantesi and Menzietti2020) study a disability option on the transition probabilities for hedging disability risks of long-term care insurance in discrete time. For long-term care insurance products, the sum-at-risk for the transition from Active to Disabled is positive, and D’Amato et al. (Reference D’Amato, Levantesi and Menzietti2020) use a European call option structure on the transition probability from Active to Disabled.
3.2 De-risking swap
Inspired by D’Amato et al. (Reference D’Amato, Levantesi and Menzietti2020), we consider a plain vanilla de-risking swap with
 $\mu _{ij}(t)$
as the underlying. The cash flow of the swap is the difference between a fixed and a floating leg. We assume that the fixed leg depends on
 $\hat{\mu }$
and that the floating leg depends on the stochastic transition intensities
 $\mu$
. By buying this contract, the insurance company agrees to pay the fixed leg to the counterpart in return for the floating leg, and the hedging cash flow is the difference between the fixed and the floating leg. One possible choice of the hedging cash flow
 $d_{ij}(t, \mu _{ij}(t))$
is
 \begin{align} d_{ij}^{\text{swap,R}}(t, \mu _{ij}(t)) = \big ( \mu _{ij}(t) - \hat{\mu }_{ij}(t)(1 + \rho ) \big ) \hat{R}^{ij}(t), \end{align}
where
 $\rho$
is a fixed proportional risk premium for the counterpart to take on the risk of paying a stochastic, floating leg,
 $\mu _{ij}(t) \hat{R}^{ij}(t)$
is the floating leg, and
 $\hat{\mu }_{ij}(t)(1 + \rho ) \hat{R}^{ij}(t)$
is the fixed leg.
For this choice of de-risking swap, the rate
 $l^D_{ij}(t, \mu _{ij}(t))$
becomes
 \begin{align*} l_{ij}^D(t, \mu _{ij}(t)) = \big ( p^\mu _{0i}(0, t) - h_{ij} \big ) \big ( \mu _{ij}(t) - \hat{\mu }_{ij}(t) \big ) \hat{R}^{ij}(t) + h_{ij} \rho \hat{\mu }_{ij}(t) \hat{R}^{ij}(t). \end{align*}
The interest of the insurance company is that
 $l^D(t, \mu _{ij}(t))$
is low and preferably negative to keep the unfunded liabilities at a minimum. The contributions to the unfunded liabilities are stochastic since they depend on
 $\mu$
, and the insurance company faces the risk of adverse development of
 $\mu$
. The de-risking swap seek to minimize the variation of
 $l^D_{ij}\big (t, \mu _{ij}(t) \big )$
by interchanging the uncertainty in
 $\mu$
with the deterministic
 $\hat{\mu }$
to reduce risk for the insurance company
As with the de-risking option, the rate of de-risking swap presented in Equation (11) depends on the sum-at-risk of a specific insurance product or combination of insurance products. For the counterpart selling the de-risking strategies, a more liquid product is to let the hedging cash flow depend on the difference between the stochastic
 $\mu$
and
 $\hat{\mu }$
such that
 \begin{align} d_{ij}^{\text{swap}}(t, \mu _{ij}(t)) = \mu _{ij}(t) - \hat{\mu }_{ij}(t)(1 + \rho ) \end{align}
since then, the de-risking swap does not depend on a specific type of insurance product. For this choice of de-risking swap, the contribution rate to the unfunded liabilities is
 \begin{align*} l_{ij}^D(t, \mu _{ij}(t)) = \big ( p^\mu _{0i}(0, t) \hat{R}^{ij}(t) - h_{ij} \big ) \big ( \mu _{ij}(t) - \hat{\mu }_{ij}(t)\big ) + h_{ij} \rho \hat{\mu }_{ij}(t), \end{align*}
which introduces more basis risks to the insurance company.
We assume that the hedging costs of both the de-risking option and the de-risking swap are proportional to the expected present value of the de-risking cash flow
 \begin{align*} a_{ij} = \delta \cdot \mathbb{E}\bigg [ \int _0^n e^{- \int _0^t r(u) \text{d} u} d_{ij}(t, \mu _{ij}(t)) \text{d} t \bigg ]. \end{align*}
The hedging price and the hedging costs are determined as the expected present value under the real-world measure of the future payments of the security. In financial mathematics, securities are priced under the risk-neutral measure determined by the market price of risk. Here, we assume a deterministic financial market governed by the deterministic interest rate
 $r(t)$
, and therefore the stochasticity in the future payments of the security comes from the stochastic process
 $\mu$
. A model of
 $\mu$
under a risk-neutral measure requires a value of the market price of insurance risk, which again requires actual market prices of de-risking securities, which do not exist. Therefore, to include the hedging price and the hedging costs as an expectation under a risk-neutral measure, we need to include the market price of insurance risk as a parameter in the model. Dahl (Reference Dahl2004) studies this in the survival model, and the extension to a multi-state model is straightforward.
4. The optimization problem
We assume that insurance companies can buy all the presented de-risking options from Section 3.1 and de-risking swaps from Section 3.2 in a frictionless market. The insurance company must choose the amount of de-risking to buy by choosing
 $h_{ij}$
for all possible transitions. In this section, we formulate an optimization model to choose the optimal amount of de-risking for the insurance company. The formulation is inspired by Lin et al. (Reference Lin, MacMinn and Tian2015), where the authors study de-risking for defined benefit plans in the survival model, and D’Amato et al., (2020), where the authors formulate an optimization model to choose the amount of de-risking disability risks in the disability model without reactivation in discrete time. Our formulation is for a general multi-state model in continuous time.
We assume that there is a capital cash flow for each transition with the rate
 $k_{ij}(t)$
such that the insurance company amortizes the unfunded liabilities continuously. Hence, if the unfunded liabilities increase, there is a capital injection with the change, and if the unfunded liabilities decrease, there is a withdrawal with the change, such that
 \begin{align*} k_{ij}(t) = l_{ij}^D \big ( t, \mu _{ij}(t) \big ), \end{align*}
where we ignore that the unfunded liabilities gain interest. Let
 \begin{align*} k(t) = \sum _{i \in \mathcal{J}} \sum _{j:j \neq i} k_{ij}(t) \end{align*}
The total discounted costs of all the de-risking strategies are
 \begin{align} TC = \sum _{i \in \mathcal{J}} \sum _{j:j \neq i} h_{ij} a_{ij} + \int _0^n e^{-\int _0^t r(u) \text{d} u} \big ( \max \lbrace k(t), 0 \rbrace (1 + \psi _1) - \max \lbrace - k(t), 0 \rbrace (1 - \psi _2) \big ) \text{d} t, \end{align}
where
 $\psi _1$
and
 $\psi _2$
are penalty factors on the capital inflow and outflow, respectively.
Inspired by Lin et al. (Reference Lin, MacMinn and Tian2015), we assume that the objective of the insurance company is to minimize its expected total costs when choosing the de-risking strategy at time 0. The constraints in the optimization problem are that the expected unfunded liabilities at the termination of the contract are less than zero such that, in expectation, the assets exceed the liabilities during the course of the contract, and that the hedging price of all de-risking strategies should be lower than the assets minus the liabilities at time 0. To control the worst-case scenarios or downside risk, we impose a constraint on the conditional value-at-risk (CVaR) of the unfunded liabilities again inspired by Lin et al. (Reference Lin, MacMinn and Tian2015).
Now, we formulate the optimization problem
 \begin{align} \min _{(h_{ij})_{i,j \in \mathcal{J}, i \neq j}} &\mathbb{E} \big [ TC \big ], && \nonumber \\ \text{subject to} & && \\ & \mathbb{E}\big [ L^D(n) \big ] \leq 0, && \nonumber \\ & CVaR_\alpha \big ( L^D(n) \big ) \leq \tau, && \nonumber \\ & \sum _{i \in \mathcal{J}} \sum _{j: j \neq i} h_{ij} P_{ij} \leq w_0, \nonumber && \end{align}
where
 $w_0$
is the initial wealth of the insurance company given by
 $w_0 = A_0 - \hat{V}^0(0)$
. We note that the optimization problem is non-linear in
 $h_{ij}$
. Calculation of the expectations and the CVaR that appear in the optimization problem requires simulation-based methods.
5. Numerical example
We consider long-term care (LTC) insurance paying a lump sum upon disability in the disability model (see Fig. 1). We consider only one level of disability, therefore there are two possible transitions from the initial state Active: the policyholder can become disabled (
 $\mu _{01}$
) or the policyholder can die (
 $\mu _{02}$
). We disregard recovery from the Disabled state, due to the chronic nature of the disability, therefore there is only one transition from the state Disabled: the disabled policyholder can die (
 $\mu _{12}$
). The insurance product is a payment upon disability,
 $b$
, paid by a single premium,
 $\pi$
, at time 0. The policyholder is
 $x_0$
years old at the policy issue (
 $t=0$
), and the insurance contract terminates at time
 $n$
.
The disability model.

First, we model the stochastic process for the transition intensities in Section 5.1, and second, we solve the optimization problem in Section 5.2.
5.1 Modelling intensities
Following Christiansen & Niemeyer (Reference Christiansen and Niemeyer2015) that study the sufficient and necessary conditions under which general transition forward rates are consistent with respect to the relevant insurance claims, we assume that
 $\mu _{01}(t)$
,
 $\mu _{12}(t)$
, and
 $(\mu _{02}(t)-\mu _{12}(t))$
are independent. Christiansen & Niemeyer (Reference Christiansen and Niemeyer2015) demonstrate that this assumption implies that
 $\mu _{02}(t)$
and
 $\mu _{12}(t)$
are dependent. It follows that
 $\mu _{01}(t)$
can be independently estimated using a standard diffusion process (e.g., Cox-Ingersoll-Ross (CIR)), and the same can be done for
 $\mu _{02}(t)$
or
 $\mu _{12}(t)$
. The difference
 $(\mu _{02}(t) - \mu _{12}(t))$
can be modeled as a constant, deterministic function or stochastic but independent with respect to
 $\mu _{02}(t)$
.
We model
 $\mu _{01}(t)$
and
 $\mu _{02}(t)$
with two different time-inhomogeneous CIR processes. The CIR process has been widely used in the actuarial literature for modeling the mortality intensity (see, e.g., Dahl, Reference Dahl2004; Biffis, Reference Biffis2005; Henriksen & Møller, Reference Henriksen and Møller2015; Zeddouk & Devolder, Reference Zeddouk and Devolder2020; and Huang et al., Reference Huang, Sherris, Villegas and Ziveyi2022). Moreover, the CIR process has the advantage of giving non-negative processes for the transition intensities. Furthermore, we assume that the difference
 $(\mu _{02}(t) - \mu _{12}(t))$
is a time-dependent constant.
Therefore, the estimated dynamics of the transition intensities are given by
 \begin{align*} & \text{d} \mu _{01}(t) = \phi _{01} \big ( \beta _{01} - \mu _{01}(t) \big ) + \sigma _{01} \sqrt{\mu _{01}(t)} \text{d} W_1(t), \\[4pt] & \text{d} \mu _{02}(t) = \phi _{02} \big ( \beta _{02} - \mu _{02}(t) \big ) + \sigma _{02} \sqrt{\mu _{02}(t)} \text{d} W_2(t), \\[4pt] & \mu _{02}(t) - \mu _{12}(t) = \Delta (t), \end{align*}
where
 $\Delta$
is a deterministic function,
 $W_1(t)$
and
 $W_2(t)$
are two independent Brownian motions.
We estimate the parameters of the CIR model for
 $\mu _{01}(t)$
(or
 $\mu _{02}(t)$
) from the survival probabilities that a person in state
 $0$
at age
 $x_0$
in the year
 $t$
will remain in state
 $0$
at age
 $x_0+n$
and year
 $t+n$
, assuming that only the cause of decrement
 $j=1$
(or
 $j=2$
) is operating,
 $p'_{01}(t,t+n)$
(or
 $p'_{02}(t,t+n)$
) (to simplify notation, we have omitted the age). The procedure followed is described in Appendix A.
We have calibrated the processes to the cohort of the Italian population aged
 $x_0=50$
in 2013 (the initialization time
 $t=0$
) and set
 $n=30$
. Data has been taken from Baione et al. (Reference Baione, Conforti, Levantesi, Menzietti and Tripodi2016), which fitted the transition probabilities to the people qualified for a disability benefit paid by the Italian Government to disabled people, consisting of a universal cash benefit not subject to age limitations and unconnected to a means’ test. The data set provides the mortality of active people, the mortality of disabled people, and the transition from active to disabled.
The values of the
 $\phi$
’s,
 $\beta$
’s, and
 $\sigma$
’s are reported in Table 1 below.
Parameter values

5.2 Solving the optimization problem
We assume that the policyholder is 50 years old and in active state at the initialization at time
 $0$
and holds an insurance contract paying a sum of
 $b = 5$
upon disability before termination at time
 $n = 30$
at the age of 80. We assume a constant interest rate,
 $r(t)=0.01 \: \forall t$
. The parameters defining the hedging cost for the de-risking option and the de-risking swap are assumed to be
 $\delta =0.1$
and
 $\rho =0.01$
, respectively. Finally, we assume the same penalty factors on the capital inflow and outflow,
 $\psi _1=\psi _2=0.1$
. All the relevant parameters defining the numerical example are reported in Table 2.
Components in numerical example
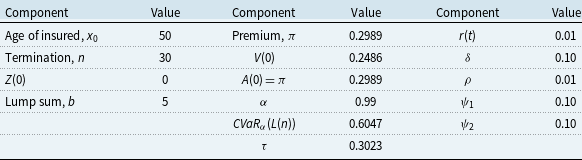
In this example, the liabilities in state 1,
 $\hat{V}^1(t)$
, and in state 2,
 $\hat{V}^2(t)$
, are equal to zero, since the only payment is upon a transition between state 0 and 1, and therefore, there are no future payments on the contract if the policyholder is disabled or dead. Hence, the sum-at-risk,
 $\hat{R}^{12}(t)$
, (see Equation (4)) is equal to zero for all
 $t$
. The unfunded liabilities depend on
 $\mu _{12}(t)$
through the rate
 $l_{12}(t)$
, which is equal to zero since
 $\hat{R}^{12}(t)$
is equal to zero (see Equation (5)). Therefore, the expected unfunded liabilities do not depend on the transition intensity
 $\mu _{12}(t)$
, and it is only necessary to define the valuation basis by the two transition intensities
 $\hat{\mu }_{01}(t)$
and
 $\hat{\mu }_{02}(t)$
. We assume that
 $\hat{\mu }_{01}(t) = 0.95 \cdot \mathbb{E} \big [ \mu _{01}(t) \big ]$
and
 $\hat{\mu }_{02}(t) = 1.05 \cdot \mathbb{E} \big [ \mu _{02}(t) \big ]$
. Under these assumptions, the single premium,
 $\pi$
, is equal to 0.2989, while the initial reserve in the active state,
 $V(0)$
, is equal to 0.2486. We choose the target level for the conditional value-at-risk as
 $\tau = 0.5 \cdot CVaR_\alpha (L(n))$
.
We calculate the expected total costs,
 $\mathbb{E} \big [ TC \big ]$
, the expected total unfunded liabilities,
 $\mathbb{E}\big [ L^D(n) \big ]$
, and the conditional value-at-risk of the unfunded liabilities,
 $CVaR_\alpha (L(n))$
, with and without de-risking based on 5000 simulations of
 $\mu _{01}(t)$
and
 $\mu _{02}(t)$
. We study the de-risking option with and without the sum-at-risk and the de-risking swap with and without the sum-at-risk. The solution to the optimization problem is the pair
 $(h_{01}, h_{02})$
that minimizes the expected total costs.
Without de-risking, the expected total costs of the insurance company is 0.0279. The objective of the insurance company is to lower the expected total costs by investing in de-risking securities. The assets at initialization of the insurance contract are 0.2989 and the liabilities equal 0.2486, hence, the insurance company has
 $w_0 = 0.0503$
to buy de-risking at time 0. We plot the sums-at-risk for the transitions from Active to Disabled and from Active to Dead, respectively, in Fig. 2.
Sums-at-risk.

5.2.1 The de-risking option
The sum-at-risk from state 0 (Active) to state 1 (Disabled) is positive. Therefore, we consider the de-risking option with the European call option structure (Equation (7) with the sum-at-risk and Equation (9) without the sum-at-risk) for this transition. On the contrary, the sum-at-risk from state 0 (Active) to state 2 (Dead) is negative. Therefore, we consider the de-risking option with a European put option structure for this transition (Equation (8) with the sum-at-risk and Equation (10) without the sum-at-risk). In Fig. 3, we illustrate the expected total costs and the constraints from the optimization problem as functions of
 $h_{01}$
for a fixed value of
 $h_{02}$
. The expected total cost, the expected unfunded liabilities, and the conditional value-at-risk decrease in
 $h_{01}$
, while the hedging price increases in
 $h_{01}$
. The values of
 $h_{01}$
that meet the constraints in the optimization problem are the values where the conditional value-at-risk is lower than
 $\tau$
and where the hedging price is lower than
 $a_0$
. Since the expected total cost has a decreasing trend, the optimal solution for
 $h_{01}$
(given
 $h_{02}$
) is given by the larger value of
 $h_{01}$
within the feasible region. This means that, given the longevity/mortality de-risking strategy, the insurance company should maximize the coverage from disability risk. We can see in Fig. 3 that the optimal values for
 $h_{01}$
are 0.47 and 2.27, respectively with and without sum-at-risk.
The optimal values of
 $h_{01}$
and
 $h_{02}$
for the de-risking options, when both are variable, are reported in Table 3. The expected total costs are negative in both cases. It can be concluded from Equation (13) that, thanks to the de-risking strategy, the weight of capital outflows (negative) is greater than the sum of the weights of capital inflows (positive) and the cost of the hedging strategy. We can also observe that the expected total cost is slightly lower for the de-risking option with the sum-at-risk than without the sum-at-risk. This indicates that the better hedge for the insurance company is to buy the de-risking option with the sum-at-risk than without, even if the difference is little. For both de-risk strategies, it is evident that the insurer must purchase higher amounts of disability options (
 $h_{01}$
) than longevity/mortality options (
 $h_{02})$
. The resulting operational indication is that the insurer should give preeminence to reducing the disability risk over the longevity/mortality risk.
Optimal amounts for the de-risking option

Illustration of the optimization problem for the de-risking option with and without the sum-at-risk. The colored dashed lines indicate the boundaries in the optimization problem, the black dashed lines indicate the feasible
 $h_{01}$
’s, and the solid black line indicates the optimal
 $h_{01}$
.

5.2.2 The de-risking swap
We illustrate the expected total costs and the constraints from the optimization problem as functions of
 $h_{01}$
for fixed
 $h_{02}$
in Fig. 4 for the de-risking swap with and without the sum-at-risk. Different from the de-risking option, the conditional value-at-risk and the expected total costs are decreasing in
 $h_{01}$
first and then become increasing in
 $h_{01}$
making the lowest feasible
 $h_{01}$
optimal in Fig. 4 where
 $h_{02}$
is fixed.
The optimal values of
 $h_{01}$
and
 $h_{02}$
are reported in Table 4. For the de-risking swap without the sum-at-risk, the expected total costs are increasing in
 $h_{02}$
since the sum-at-risk
 $\hat{R}_{01}(t)$
is negative, and therefore the optimal strategy is
 $h_{02} = 0$
. This is not the case for the de-risking swap with the sum-at-risk, and we note that the de-risking swap including the sum-at-risk results in the lowest expected total costs in this example for all the considered de-risking securities.
5.2.3 De-risking in one scenario
The objective, when the insurance company chooses to buy de-risking securities, is to lower the total costs. It affects the total costs when the insurance company amortizes the unfunded liabilities with the
 $k(t)$
rate. Now, we consider one scenario and illustrate how the de-risking option decreases the rate
 $k(t)$
. The simulated path of
 $\mu _{01}(t)$
and
 $\mu _{02}(t)$
and the valuation basis
 $\hat{\mu }_{01}(t)$
and
 $\hat{\mu }_{02}(t)$
are illustrated in Fig. 5.
Optimal amounts for the de-risking swap

Illustration of the optimization problem for the de-risking swap with and without the sum-at-risk. The colored dashed lines indicate the boundaries in the optimization problem, the black dashed lines indicate the feasible
 $h_{01}$
’s, and the solid black line indicates the optimal
 $h_{01}$
.

Simulation of
 $\mu _{01}(t)$
and
 $\mu _{02}(t)$
(solid lines) and
 $\hat{\mu }_{01}(t)$
and
 $\hat{\mu }_{02}(t)$
(dashed lines).

In this scenario, the disability intensity
 $\mu _{01}(t)$
exceeds the valuation basis
 $\hat{\mu }_{01}(t)$
for
 $t \in [2, 8]$
and for
 $t \in [11, 17]$
, and since the sum-at-risk upon disability is positive, the insurance company faces a loss for these values of
 $t$
if it does not invest in de-risking securities. The mortality intensity
 $\mu _{02}(t)$
is lower than the valuation basis
 $\hat{\mu }_{02}(t)$
for all
 $t \lt 27$
, and since the sum-at-risk upon death is negative the insurance company faces a loss. We illustrate the rate
 $k(t)$
in Fig. 6 for the de-risking option and the de-risking swap with and without the sum-at-risk.
The rate
 $k(t)$
without de-risking and for the de-risking option and the de-risking swap with and without the sum-at-risk.

Fig. 6 illustrates that the de-risking option lowers the rate
 $k(t)$
such that, including de-risking, the insurance company faces a lower loss than without de-risking. For the de-risking option, the solid red line and the dashed red line in Fig. 6 are almost identical indicating that the optimal de-risking option with and without the sum-at-risk, respectively, results in an almost identical de-risking cash flow. We can see from Fig. 6 that the de-risking strategy based on options reduces the capital inflows (
 $k\gt 0$
) and leaves the capital outflows unchanged (
 $k\lt 0$
). The de-risking swap, results in a more stable rate
 $k(t)$
compared to the de-risking option and affects both the capital inflows and the capital outflows.
5.2.4 Parameter sensitivities
We have chosen the values for the parameters
 $\delta$
,
 $\psi _1$
,
 $\psi _2$
and
 $\rho$
according to Table 2. The parameter
 $\delta$
determines the hedging costs and affects the expected total costs and the hedging price in the optimization problem. Therefore, the higher
 $\delta$
is, the less amounts of feasible de-risking strategies exist.
The parameters
 $\psi _1$
and
 $\psi _2$
are penalty factors on the capital inflow and outflow, respectively, and they only affect the expected total costs in the optimization problem. If
 $\psi _1$
and
 $\psi _2$
increase, so does the expected total costs, but the region of feasible de-risking strategies is unaffected.
The parameter
 $\rho$
influences the fixed leg of the de-risking swap and thus impacts all the quantities in the optimization problem. If the hedging cash flow does not depend on the sum-at-risk (Equation (12)), a low value of
 $\rho$
and thus a low fixed leg make the de-risking strategy more attractive for the insurance company, and more amounts of feasible de-risking strategies exist since it faces a potential loss without de-risking if
 $\mu _{jk}$
is high. The same is true if the hedging cash flow depends on the sum-at-risk (Equation (11)) and the sum-at-risk upon the transition from state
 $i$
to state
 $j$
is positive. If the hedging cash flow depends on the sum-at-risk and the sum-at-risk upon the transition from state
 $i$
to state
 $j$
is negative, more amounts of feasible de-risking strategies exist for a higher value of
 $\rho$
.
6. Conclusion
Managing longevity, disability, and health-related risks is a growing issue for insurance companies. While the longevity securitization market has begun to develop, the securitization of systematic insurance risks in a multi-state setup is having trouble getting started. However, the systematic nature of longevity, disability, and other health-related risks makes the capital market attractive, considering that the hedging demand for these risks is expected to increase in future years due to the aging population. These concerns stress the importance of developing solutions for securitizing the systematic risks affecting a life or health insurance portfolio.
This work introduced potential tools for biometric systematic risk coverage: options and swaps with underlying transition intensities between insurance states. Following D’Amato et al. (Reference D’Amato, Levantesi and Menzietti2020), we have defined a problem of search for the strategy of optimal de-risking by assuming that the objective of the insurance company is to reduce, at the same time, the opportunity cost deriving from the capital flows (outflows and inflows) required to offset the unfunded liabilities and the cost of the de-risking strategy.
The optimal problem is solved under the constraint of a maximum level of CVaR admissible for the insurance company and with respect to a budget constraint. We have thus introduced a multiple-state setup in continuous time. In the numerical application, we applied the optimal problem to the case of LTC insurance and verified the effectiveness of the different hedging strategies. Some essential implications emerge from the numerical results: the swap-based hedging strategy is more effective than the one based on options when the derivatives pay-offs include the sum-at-risk. In other words, tailor-made de-risking tools (such as the swaps) work better when considering the sum-at-risk in the pay-offs and the basis risks are minimized. Moreover, in both strategies, the weight of the disability risk hedging tools is higher than that of the tool covering the risk of longevity/mortality.
On one hand, it should be noted that the results obtained in the numerical application are the result of the specific database used and the structure of the insurance policy taken into account. On the other hand, the suggested approach for defining the optimal strategy and the de-risking tools considered can be applied to different insurance contracts based on a multi-state framework and under different assumptions on technical bases.
Data availability statement
The data and code that support the findings of this study are available from [website for information: www.ania.it/studi-e-rapporti-demografici, email for request: direzione_vita@ania.it]. Restrictions apply to the availability of the data, which were used under license for this study. Data are available on request from the authors with the permission of [ANIA - Associazione Nazionale fra le Imprese Assicuratrici].
A. Appendix
Consider the single-decrement probability
 $p'_{ij}(t,t+1)$
with
 $i\neq j$
, that a person in state
 $i$
at a given age
 $x$
in the year
 $t$
, will be in the state
 $j$
at age
 $x+1$
in the year
 $t+1$
(note that we omit the age for convenience). For each cause
 $j$
, the collection of values
 $\left \{p'_{ij}(t,t+1)\right \}$
for various year
 $t$
is known as the associated single-decrement table for cause
 $j$
. These are annual probabilities of failure for the particular cause
 $j$
, assuming that no other causes of decrement are operating.
Following Promislow (Reference Promislow2015), the relationship between the two sets of probabilities (one set from the multiple-decrement table providing
 $p_{01}(t,t+1)$
and
 $p_{02}(t,t+1)$
, and the other set from the single-decrement table providing
 $p'_{01}(t,t+1)$
and
 $p'_{02}(t,t+1)$
) is as follows:
 \begin{align*} p_{01}(t,t+1)+p_{02}(t,t+1)= p'_{01}(t,t+1)+p'_{02}(t,t+1)-p'_{01}(t,t+1) p'_{02}(t,t+1) \end{align*}
Assuming a uniform distribution of failures for each part, over each year, we have:
 \begin{align*} p_{01}(t,t+1)=p'_{01}(t,t+1)-\frac{1}{2} p'_{01}(t,t+1)p'_{02}(t,t+1), \end{align*}
 \begin{align*} p_{02}(t,t+1)=p'_{02}(t,t+1)-\frac{1}{2} p'_{01}(t,t+1)p'_{02}(t,t+1). \end{align*}
Moreover, the following relation holds:
 \begin{align*} p_{01}(t,t+1)-p_{02}(t,t+1)=p'_{01}(t,t+1)-p'_{02}(t,t+1) \end{align*}
Therefore, we obtain the following (Promislow, Reference Promislow2015):
 \begin{align*} p_{01}(t,t+1)=p'_{01}(t,t+1)-\frac{1}{2} \left [p'_{01}(t,t+1)\right ]^2+\frac{1}{2} p'_{01}(t,t+1) \Delta \end{align*}
where
 $\Delta =p_{01}(t,t+1)-p_{02}(t,t+1)$
. Finally, we get the single-decrement probabilities from a multiple-decrement table with two decrements, disability (cause 1), and death (cause 2), from:
 \begin{align*} p'_{01}(t,t+1)=2+\Delta -\sqrt{(2+\Delta )^2-8p_{01}(t,t+1)}, \end{align*}
 \begin{align*} p'_{02}(t,t+1)=p'_{01}(t,t+1)-\Delta. \end{align*}
Now, we can calculate the survival probabilities
 $p'_{00(1)}(t,t+n)$
that a person in state 0 in the year
 $t$
will remain in state 0 after
 $n$
years (i.e. in the year
 $t+n$
), assuming that only the cause of decrement 1 (disability) is operating by:
 \begin{align*} p'_{00(1)}(t,t+n)=\prod _{k=t}^{t+n-1}\left [1-p'_{01}(k,k+1)\right ] \end{align*}
Similarly, we calculate the survival probabilities
 $p'_{00(2)}(t,t+n)$
that a person in state 0 in the year
 $t$
will remain in state 0 after
 $n$
years, assuming that only the cause of decrement 2 (death) is operating by:
 \begin{align*} p'_{00(2)}(t,t+n)=\prod _{k=t}^{t+n-1}\left [1-p'_{02}(k,k+1)\right ] \end{align*}
In the CIR case, we have for
 $j=1,2$
:
 \begin{align*} p'_{00(j)}(t,t+n)=e^{\eta _{0j}(n)+\theta _{0j}(n)\mu _{0j}(t)}, \end{align*}
where:
 \begin{align*} \eta _{0j}(n)=-\frac{2\phi _{0j}\beta _{0j}}{\sigma _{0j}^2}\ln{\left (\frac{f_{0j}+g_{0j} e^{c_{0j} n}}{c_{0j}}\right )}+\frac{\phi _{0j}\beta _{0j}}{f_{0j}}n, \end{align*}
 \begin{align*} \theta _{0j}(n)=\frac{1-e^{c_{0j} n}}{f_{0j}+g_{0j} e^{c_{0j} n}}, \end{align*}
with
 \begin{align*} c_{0j} = -\sqrt{\phi _{0j}^2+2\sigma _{0j}^2}, \end{align*}
 \begin{align*} f_{0j} = \frac{c_{0j} - \phi _{0j}}{2}, \end{align*}
 \begin{align*} g_{0j} = \frac{c_{0j} + \phi _{0j}}{2}. \end{align*}



