


There are two forms of diabetes, type 1 and type 2. While diabetes in its type 1 form can occur at any age, it mainly develops during childhood and adolescence (Craig et al., Reference Craig, Twigg, Donaghue, Cheung, Cameron, Conn, Jenkins and Silnik2011). It is a chronic autoimmune disease that develops when the immune system destroys the insulin-producing cells of the pancreas. Without insulin, glucose cannot be transported into the cells (where it can be used for future energy needs), leading to a rise in glucose levels. When blood glucose levels fluctuate beyond an accepted range, both short- and long-term health complications can arise that include stroke, coronary heart disease, peripheral vascular disease, nerve disease, ulcers, limb amputations, kidney failure, vision impairment and blindness. Diabetes can also affect psychological wellbeing, contributing to distress, anxiety and depression (Australian Institute of Health and Welfare, 2015; Clay, Reference Clay2017).
In contrast to type 1, which is an unpreventable disease, type 2 can be managed with a combination of exercise, diet and weight loss. It is also the most common form of diabetes, accounting for about 85% of all cases and is considered to have increased in line with obesity rates. In 2011–12 it was recorded that 12–25% of Australian children aged 5–17 were overweight or obese. Among young people in Australia, the risk of type 2 diabetes increases with age, from an average annual rate of new cases of 3 per 100,000 population in 10- to 14-year-olds, to 8 per 100,000 for those aged 15–19 and 16 per 100,000 for those aged 20–24. From 2002–2003 to 2011–2012, there were around 4,000 new cases of type 2 diabetes among those aged 10–24 — an average of nearly 400 new cases per year. In 2006–2011, the age-specific rate of type 2 diabetes for Indigenous Australians was 8 times higher than non-Indigenous Australians among 10- to 14-year-olds and around 4 times as high for those aged 15–19 and those aged 20–24 (Australian Institute of Health and Welfare, 2014).
Due to the chronic and progressive nature of type 2 diabetes, individuals with the condition often need to combine self-management strategies with oral medication and/or insulin injections to keep it under control (Diabetes Australia, Reference Australia2015; Weaver, Lemonde, Payman, & Goodman, Reference Weaver, Lemonde, Payman and Goodman2014). An added complication is that treating diabetes in children and adolescents is more difficult as levels of compliance are lower than those for adults (Australian Institute of Health and Welfare, 2014). A diagnosis and response to diabetes impacts others. Indeed, for every person diagnosed with diabetes, there is usually a family member or other carer providing assistance, leading to an estimated 2.4 million Australians who are affected by diabetes every day (Diabetes Australia, Reference Australia2015). Interestingly, the size of the epidemic in the United States almost guarantees that most psychologists will end up treating somebody with diabetes (Clay, Reference Clay2017).
A diagnosis of diabetes can have a significant impact on a student's life. The need for regular medication, frequent medical appointments, and lifestyle changes can lead to a number of emotional responses, including depression and anxiety, eating disorders, and problems with personal relationships (Clay, Reference Clay2017; Hunter, Reference Hunter2016; de Groot, Golden & Wagner, Reference de Groot, Golden and Wagner2016). School counsellors and psychologists, therefore, may be called upon to play a vital role in helping students with the emotional responses to diabetes and enabling students with diabetes to independently self-manage their condition, which may result in students having increased control over their personal health and decreased demand on family members and other carers to provide assistance (Diabetes Australia, Reference Australia2015; Phillips, Reference Phillips2016). It is now considered that self-management is the most appropriate strategy for chronic diseases where lifestyle is critical to management (Hale, Capra, & Bauer, Reference Hale, Capra and Bauer2015). Indeed, within their current scope of practice, school counsellors and psychologists who are familiar with goal setting, self-monitoring and evaluation are well positioned to assist those students who may be at risk for a substandard management of their condition.
Self-Management
Following the principles of self-management, diabetes can be effectively managed through a combination of healthy eating, weight loss and regular exercise (Conroy, Yang, & Maher, Reference Conroy, Yang and Maher2014; Diabetes Australia, Reference Australia2015; Doshi, Patrick, Sallis, & Calfas, Reference Doshi, Patrick, Sallis and Calfas2003; Weaver, Lemonde, Payman, & Goodman, Reference Weaver, Lemonde, Payman and Goodman2014). The use of smartphone applications (apps) have the potential to occupy an important role in assisting the school professional and students to manage this condition (El-Gayer, Timsina, Nawar, & Eid, Reference El-Gayar, Timsina, Nawar and Eid2013). Because of the prevalence of type 2 diabetes, the present study will focus on the management of this category, although some of the apps can be used for the management of both type 1 and type 2.
While one-to-one interventions over long periods with short follow-ups and regular reinforcement are effective, these interventions are expensive and difficult to sustain; therefore, it has been argued that less intensive interventions are required for chronic health conditions and apps may be helpful as they are affordable, practical, and increase patient participation (Hale, Capra, & Bauer, Reference Hale, Capra and Bauer2015). Apps designed to facilitate, or assist in, the self-management of type 2 diabetes may also represent an effective, convenient, portable, self-management tool (Waki et al., Reference Waki, Fuki, Hayasha, Kimura, Kobayashi, Nangaku, Kadowaki and Ohe2016).
For the purposes of this study, self-management is defined as the personal application of behaviour change tactics that produce a desired change in behaviour (Miltenberger, Reference Miltenberger2012). For a full review of self-management for school students see Busacca, Anderson, and Moore (Reference Busacca, Anderson and Moore2015). Crucial to self-management is goal setting, self-monitoring and self-evaluation. Ideally, goals involve specifying a level of performance that then regulates action by providing a reference point for mental and physical action (Locke & Latham, Reference Locke and Latham2006).
Content Analysis
A content analysis typically involves an analytical process that includes the following seven steps: (1) formulating the research questions to be answered, (2) selecting the sample to be analysed, (3) defining the categories to be applied, (4) outlining the coding process, (5) coder training, (6) implementing the coding process, (7) determining trustworthiness, and (8) analysing the results of the coding process (Kaid, Reference Kaid, Emmert and Barker1989). This process differs depending on the specific content analysis approaches used, which are either: conventional, in which the study starts with observation; directed, in which codes are defined before and during data analysis; or summative, in which keywords are identified before and during the data analysis. As a research tool, it can be used to take qualitative data and to transform it into quantitative data. For a full review, see Hsieh and Shannon (Reference Hsieh and Shannon2005), and Cavanagh (Reference Cavanagh1997).
Key differences among conventional, directed, and summative approaches to a content analysis focus on how the initial codes are constructed and used. For example, using a conventional content analysis, categories are derived from data during data analysis, allowing richer understanding of a phenomenon. In turn, a directed approach uses existing theory or prior research to create the initial coding scheme prior to beginning to analyse the data (Kyngas &Vanhanen, Reference Kyngas and Vanhanen1999), with additional codes developed as the analysis precedes after the initial coding scheme is revised and refined. This approach is often used to extend or refine existing theory. Finally, the summative analysis is used to approach text as single words or in relation to particular content rather than analysing the data as a whole (Hsieh & Shannon, Reference Hsieh and Shannon2005).
However, the success of a content analysis, while time consuming, depends on the quality of the coding process. The basic coding process in content analysis is to arrange large quantities of text into fewer content categories (Weber, Reference Weber1990). Categories are patterns or themes that are directly expressed in the text or are derived from them through analysis. Then, relationships among categories are identified. In the coding process, researchers using content analysis create or develop a coding scheme to guide coders to make decisions in the analysis of content. The development of a good coding scheme is pivotal to trustworthiness in this form of research (Folger, Hewes, & Poole, Reference Folger, Hewes, Poole, Dervin and Voigt1984).
Apps and Behaviour Change Strategies
There is evidence demonstrating that if apps are to be used successfully in the implementation, adherence, and maintenance over time of behaviour change they should contain effective behaviour change strategies (Committee on Health and Behavior: Research, Practice and Policy, Board on Neuroscience and Behavioral Health, 2001). In a systematic review of measures used to assess the behavioural content of type 2 diabetes smartphone apps, the Behaviour Change Technique Taxonomy version 1 (BCTTv1; Michie et al., Reference Michie, Richardson, Johnston, Abraham, Francis, Hardeman, Eccles, Cane and Wood2013) was found to be the best measure available for assessing health self-management apps (Ostojic et al., Reference Ostojic, Chung, Di Mattia, Furlonger, Busacca and Chittleborough2018). The BCTTv1 is an extensive taxonomy of 93 consensually agreed, distinct behaviour change tactics that offer a step change as a method for specifying interventions. The BCTTv1 is one of the only behaviour change rating measures generalisable to all health conditions and has been identified as being the most comprehensive in behaviour change content, incorporating 13 key behaviour change strategies (see Ostojic et al., Reference Ostojic, Chung, Di Mattia, Furlonger, Busacca and Chittleborough2018, for a full review). Secondary assessment measures can also be used to evaluate apps, and one of the most widely used is the User Version of the Mobile Application Rating Scale (uMARS), which is employed to examine design, technical features and overall quality of the apps themselves.
Accordingly, in this article we aimed to present a method by which school psychologists and counsellors could identify quality apps for the purpose of supporting students who need to self-manage their type 2 diabetes. The method of identification included a content analysis and a mobile rating scale. The content analysis was used to assess high-ranking Apple and Android free and paid apps designed for type 2 diabetes self-management for behaviour change techniques. For overall app quality, the User Version of the Mobile Application Rating Scale (uMARS) was used (Stoyanov, Hides, Kavanagh, & Wilson, Reference Stoyanov, Hides, Kavanagh and Wilson2016a). The content analysis was considered to be methodologically sound and capable of being used to select quality evidence-based apps in line with behavioural theory, while the uMARS was used as a secondary measure of app quality.
Method
Content Analysis
Content analysis was used as it is a research technique for making replicable and valid inferences from text or other meaningful matter such as images, sound, signs, symbols, and numerical records (Krippendorff, Reference Krippendorff2004). In the present study, the process used was as follows: the data were collected, data were read to the level of familiarity, coding units were identified, data were analysed by applying coding units and then a tally was made of the number of times a coding unit appeared.
Inclusion/Exclusion Criteria
Apps were included if: (1) the app was in English; (2) the patient was the intended user of the app; (3) the app was a stand-alone app (i.e., able to operate without the need for specific additional equipment); (4) the app was specific to, or included, type 2 diabetes; and (5) the app was focused on actively facilitating the self-management of type 2 diabetes. Alternatively, apps were excluded from the study if: (1) the app was not in English; (2) the app was only available in a bundle containing other apps; (3) the app was specific to type 1 diabetes or other conditions; (4) the app did not incorporate a self-management component; and (5) the app required the use of additional equipment in conjunction with the smartphone (i.e., its use was not optional).
Search Strategy
The apps included in the study sample were found in the Apple App Store and Google Play Store. The initial search was conducted using the word ‘Diabetes’ as the only search term, as it was believed that this was the term that the majority of users searching for such apps would use. The 10 highest ranking free and paid apps of each store to meet the inclusion criteria were included in the final sample, as it was considered that these apps best represented those that would be selected by the majority of users who were seeking type 2 diabetes self-management apps.
Screening Procedure
Two independent raters were used, one of whom has a background in the pathophysiology of type 2 diabetes, to assess all of the apps in the study. The initial screening procedure was conducted followed by the categorisation of the apps as satisfying the inclusion/exclusion criteria. Criteria was based upon the information provided in the descriptions and screenshots of each app in their respective stores. During the screening process, ranking order was decided to be the order in which the apps appeared following the search, and separate ranking orders were used for free and paid apps in each store (i.e., a free app ranked ‘1’ was the first free app that appeared in that store and a free app ranked ‘9’ was the ninth free app that appeared, while a paid app ranked ‘1’ was the first paid app that appeared in that store, and so forth). Once the initial short list of 10 paid and 10 free apps from each store was established, a second rater searched each app in the list and assessed the descriptions and screenshots with the same inclusion/exclusion criteria as the first independent rater.
Data Extraction
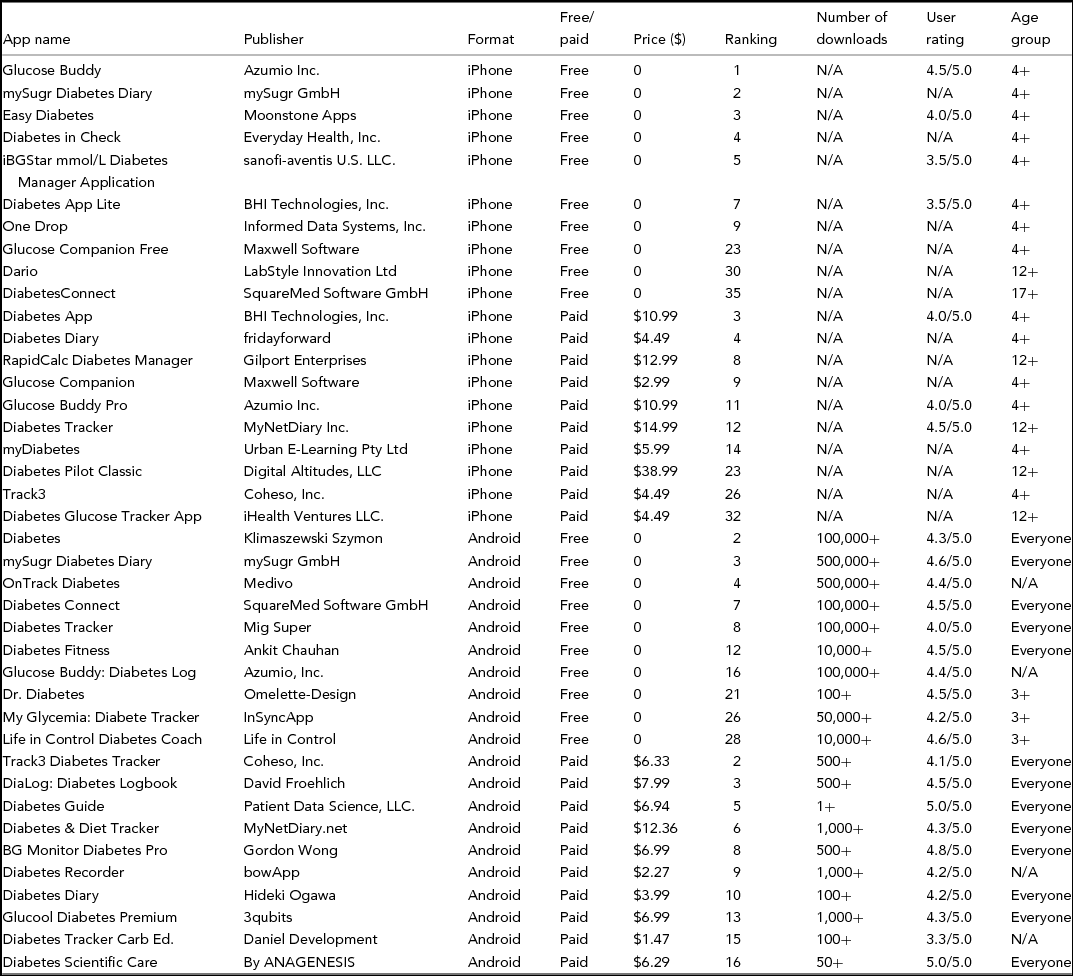
Upon reaching a consensus on the inclusion of an app, descriptive data about the app, including the app name, the name of the publisher, the app format, free/paid status, price in Australian dollars, respective ranking, number of downloads, user rating, and target age group was recorded. A summary of descriptive data for included apps can be viewed in Table 1.
Descriptive Information of Included Apps

BCTTv1
The BCTTv1 is a taxonomy of 93 BCTs arranged into 16 groups, based on the similarity of the ‘active ingredients’ of each technique. BCT taxonomy v1 is an extensive taxonomy of 93 consensually agreed, distinct BCTs that offers a step change as a method for specifying interventions (for a full review, see Michie et al., Reference Michie, Richardson, Johnston, Abraham, Francis, Hardeman, Eccles, Cane and Wood2013). Of the15 content analyses reviewed, the BCTTv1 was identified as one of the most effective taxonomies for evaluating health related apps (Ostojic et al., Reference Ostojic, Chung, Di Mattia, Furlonger, Busacca and Chittleborough2018).
uMARS
The uMARS is a version of the MARS (Mobile App Rating Scale; Stoyanov et al., Reference Stoyanov, Hides, Kavanagh and Wilson2016a). As the uMARS is designed to enable users to rate app quality, several items in the original MARS were omitted from the uMARS, resulting in a more user-friendly, easier-to-use assessment tool. Items were omitted so that users could rate apps without needing to do research outside of the app, without being aware of the app goals, and assessing whether the apps were scientifically tested; resulting in a more user-friendly, easier-to-use assessment tool. Stoyanov et al. (Reference Stoyanov, Hides, Kavanagh and Wilson2016a) simplified the original MARS by first reviewing and removing complex terminology from its items and response scales. As a result, the team of reviewers deleted three items requiring professional expertise: pertaining to evidence base, app goals, and accuracy of app description. Readability of the MARS and the draft uMARS was then determined using the Flesch Reading Ease test, scores indicated that the uMARS was written in plain English and that its required reading level was approximately grade 8.
Each item of the uMARS was rated on a 5-point scale from 1 = inadequate to 5 = excellent. The subscales allowed calculations of mean scores for engagement, functionality, aesthetics, and information, and the mean score of these subscales gave the total mean score. Test–retest reliabilities indicated that the uMARS provided a reliable measure of app quality in target users. An online training video for the use of the MARS was used to educate the raters in the application of the tool (Stoyanov, 2016). For the current study, only the App Quality Ratings portion of the uMARS was used.
Materials
At the time of writing, an iPhone 6S with the latest software available was used for testing and scoring of Apple format apps. A Samsung Galaxy S4 Mini was used for the testing and assessment of Android format apps. IBM SPSS Statistics 23 was used for all statistical analyses.
Assessment Procedure
Rater training
Prior to downloading any of the apps, each rater completed the online BCTTv1 training and viewed the training video for the use of the uMARS. An online training program for the BCTTv1 was undertaken by both raters (Wood et al., Reference Wood, Richardson, Johnston, Abraham, Francis, Hardeman and Michie2015). The training not only familiarised the raters with the definitions of each of the BCTs, but also provided descriptions and examples, and had the raters identify BCTs in real intervention descriptions (Wood et al., Reference Wood, Richardson, Johnston, Abraham, Francis, Hardeman and Michie2015).
Following this, the raters independently downloaded and tested the first five iPhone apps for 24 hours. Following testing, each rater coded the first five iPhone apps for each BCT using the BCTTv1, scoring a ‘0’ for an absent BCT and ‘1’ for a present BCT. Initial interrater reliability on the first five apps was compared and coding discrepancies were discussed and resolved via consensus, and BCT definitions clarified for application with remaining smartphone apps. Each rater then downloaded and independently tested each of the remaining 35 apps for at least 24 hours before scoring them using the BCTTv1.
Interrater reliability of inclusion/exclusion criteria
Percent interrater agreement was used to assess interrater reliability of the inclusion/exclusion criteria for the selection of apps, with the raters agreeing in all but two instances (95% agreement). Both apps upon which there was disagreement regarding inclusion were free Android apps, and the disagreement was discussed, with a consensus reached in deciding to exclude both of the apps and include the next two highest ranked free Android apps in their place.
Data analysis
Following this, overall interrater reliability was calculated, and then all coding discrepancies were discussed and decisions reached via consensus. Due to the subjective nature of the uMARS, it was decided that assessment of apps using the uMARS would be conducted by the two raters together after the coding for BCTs was completed. The uMARS rating was then conducted, with the raters agreeing on a score of 1–5 for each of the items of the engagement, functionality, and aesthetics subscales, and a score of 1–5 or ‘N/A’ for each of the information subscale items. Following this, mean scores for each of the subscales were calculated, and a mean total quality score calculated from these. All data were then entered into IBM SPSS Statistics 23 for statistical analysis (i.e., descriptives, ANOVA to compare mean number of BCTs and quality ratings between Apple/Android, free/paid and Pearson correlations looking at app quality scores and number of BCTs).
Interrater reliability of individual BCTs
Interrater reliability was calculated using exact agreement for each measure within the BCTTv1 and then averaged within the 16 subsets of the BCTTv1. Overall agreement for the coding using the BCTTv1 averaged 96%.
Results
Using the framework, 10 high-ranking Apple and 10 Android free and paid apps designed for type 2 diabetes self-management were identified that included only 30 BCTs overall, with the average number of BCTs per app a little over 7. The overall app quality as determined by using the uMARS was 3.3 from a total of 5.
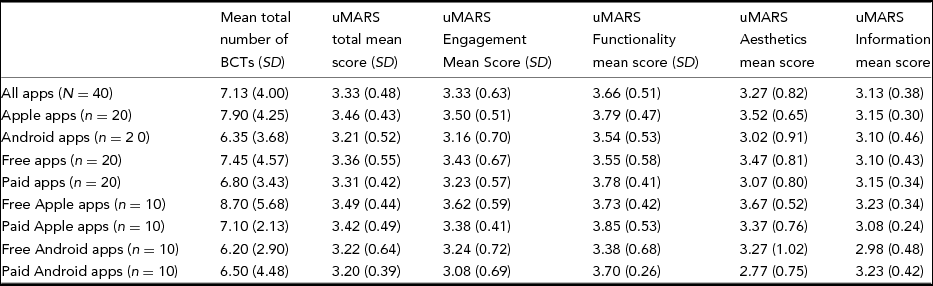
The mean number of BCTs found across all apps was 7.13 (SD = 4.00), with a mean of 7.90 (SD = 4.25) for Apple apps and 6.35 (SD = 3.68) for Android apps, and a mean of 7.45 (SD = 4.57) for free apps and 6.80 (SD = 3.43) for paid apps. Free Apple apps had a mean number of BCTs of 8.70 (SD = 5.68), paid Apple apps a mean of 7.10 (SD = 2.13), free Android apps a mean of 6.20 (SD = 2.90), and paid Android apps a mean of 6.50 (SD = 4.48). A two-way between groups ANOVA was conducted to analyse the differences in total mean number of BCTs between Apple apps and Android apps, as well as free apps and paid apps. No significant differences were found with alpha set at the .05 level. Additionally, a two-way between groups ANOVA revealed no significant differences in the mean total number of BCTs between free Apple apps, paid Apple apps, free Android apps, and paid Android apps.
The uMARS total mean score across all apps was 3.33 (SD = 0.48), with subscale means across all apps of 3.33 (SD = 0.63) for engagement, 3.66 (SD = 0.51) for functionality, 3.27 (SD = 0.82) for aesthetics, and 3.13 (SD = 0.38) for information. A two-way between-groups ANOVA was undertaken to investigate the differences in uMARS total mean scores and subscale mean scores between Apple apps and Android apps, and free apps and paid apps, with no significant differences found with alpha set at .05. Further investigation revealed no significant differences between free Apple apps, paid Apple apps, free Android apps, and paid Android apps. The means for total number of BCTs, and uMARS total and subscale scores across all apps and subgroups can be found in Table 2.
Mean Scores of Total BCTs, uMARS Scale, and uMARS Subscales

Thirty unique BCTs were identified in total, with six of those (2.4 self-monitoring of outcome(s) of behaviour; 2.3 self-monitoring of behaviour; 11.1 pharmacological support; 2.7 feedback on outcome(s) of behaviour; 7.1 prompts/cues; and 1.3 goal setting (outcome) present in over half of the sample. Frequencies of identified BCTs can be viewed in Figure 1.
Frequency of identified BCTs.

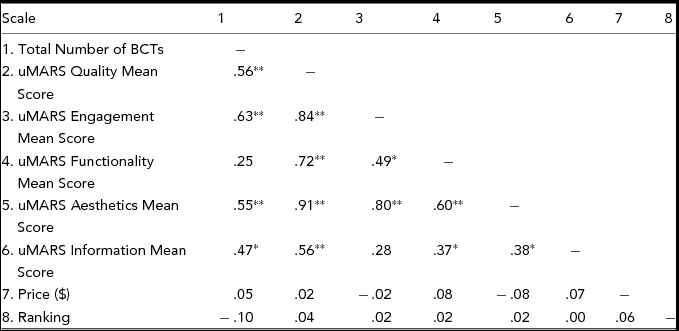
The relationships between total number of BCTs, uMARS quality mean score, uMARS engagement mean score, uMARS functionality mean score, uMARS aesthetics mean score, uMARS information mean score, price ($) of apps, and ranking of apps, was investigated using the Pearson product-moment correlation coefficient. Several significant, positive correlations were identified, the most noteworthy of which was a strong, positive correlation between total number of BCTs and uMARS quality mean score. Other strong correlations were evident between the total number of BCTs and uMARS aesthetics mean score, between uMARS quality mean score and uMARS engagement mean score, between uMARS quality mean score and uMARS functionality mean score, between uMARS quality mean score and uMARS information mean score and between the uMARS engagement mean score and uMARS aesthetics mean score. A full table displaying correlations is presented in Table 3.
Correlation Matrix: Pearson Correlations Between Total Number of BCTs, uMARS Score and Subscale Scores, Price ($), and Ranking

Note: *p < .05 (2-tailed). **p < .001 (2-tailed)
Interrater Reliability
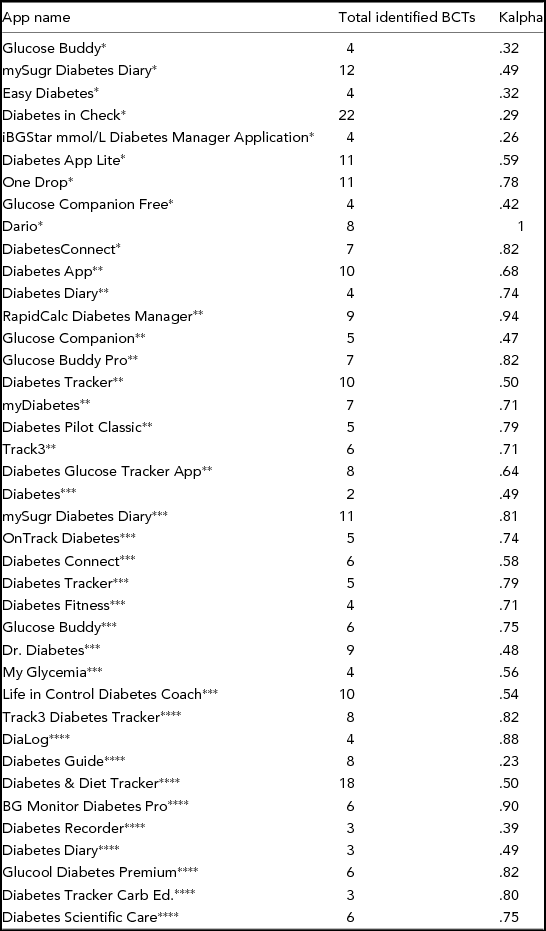
Krippendorff's alpha (Kalpha) was used to assess interrater reliability for the coding of apps in the study. Kalpha was selected as it is a measure of interrater reliability designed specifically for use in content analysis study designs, and can be applied to any number of values, missing data, binary values, and adjusts itself to small sample sizes (Krippendorff, Reference Krippendorff2004). Initially, interrater reliability for the first five coded apps was assessed, with a low Kalpha rating of .34. The overall Kalpha value for all 40 coded apps was .63, which is an acceptable level of interrater reliability. The total number of identified BCTs and Kalpha values for each of the 40 apps can be viewed in Table 4.
Total Number of Identified BCTs and Inter-Rater Reliability of BCT App Ratings

Note: *free Apple app, **paid Apple app, ***tree Android App, ****paid Android App.
Discussion
In this article, a framework was described to assist school psychologists and counsellors in identifying high quality apps for supporting the self-management of type 2 diabetes. This is one of the first studies to assess type 2 diabetes self-management apps using the BCTTv1, as well as the first to assess the quality of these apps using the uMARS.
The reviewed apps contained an average of 7.13 BCTs. Given that it is possible for apps to contain up to 93 BCTs, this result can be considered relatively low. The app with the highest number of BCTs present was the free Apple app named Diabetes in Check, with 22 identified BCTs, while the app with the lowest number of BCTs present was the free Android app named Diabetes, with only two identified BCTs. Analysis demonstrated that the mean number of BCTs did not significantly differ between Apple and Android apps. There was also no significant difference for this variable between free and paid apps. Further analysis revealed no significant differences in the number of BCTs between free Apple apps, paid Apple apps, free Android apps, and paid Android apps. This finding suggests that, setting aside individual app differences, consumers will have access to similar amounts of behavioural content across apps, regardless of their format (i.e., Apple or Android), or their price (i.e., free or paid).
Despite no significant between-groups variance in the total number of identified BCTs, some individual app differences were evident. The BCTs identified in the Glucose Buddy apps varied for all three versions of the app included in the study. The free Apple version included four identified BCTs, while the free Android version included six identified BCTs. The paid Apple version, Glucose Buddy Pro, included seven identified BCTs, and included more features than its free counterpart. Other apps, such as mySugr Diabetes Diary also varied, with 12 identified BCTs in the free Apple version, and 11 identified BCTs in the free Android version. These findings suggest that there are differences in the same app depending on the format, with an app for one format potentially offering the user more BCTs than the same app on the other format.
Findings in the current study resulting from BCTTv1 evaluation are consistent with the results of a previous study conducted by Yang, Maher, and Conroy (Reference Yang, Maher and Conroy2015), who used the BCTTv1 to assess the behavioural content of smartphone apps for physical activity. They identified a mean of 6.6 BCTs across a sample of 100 included apps, indicating that there was a similar lack of behavioural content present in those apps as in Type 2 diabetes apps. Even fewer BCTs were identified when the BCTTv1 was used to assess the behavioural content of apps for alcohol reduction and medication adherence. In a study by Crane, Garnett, Brown, West, and Michie (Reference Crane, Garnett, Brown, West and Michie2015) on the behavioural content of smartphone apps for alcohol reduction, they identified a mean of only 3.6 BCTs across 61 apps, while in a later study conducted by Morrissey, Corbett, Walsh, and Molloy (Reference Morrissey, Corbett, Walsh and Molloy2016), a mean of only 2.77 BCTs across 166 apps for medication adherence were found. Results of the current study, combined with those of previous studies using the BCTTv1 to investigate the behavioural content of health self-management apps, indicate a general lack of evidence-based behaviour change techniques in apps where such techniques are crucial to the interventions they encompass.
As was the case with the between-groups analysis of total BCTs, there were no significant between-groups differences on the total app quality scores, or any of the uMARS subscale scores. These results indicate that app quality was generally consistent across all apps, regardless of the format or whether they were free or paid. The overall uMARS quality mean across all apps of 3.33 meant that apps were generally of a good quality, and similar overall means of 3.33 for engagement, 3.66 for functionality, 3.27 for aesthetics, and 3.13 for information, meaning that the apps tended to be of a similarly good standard across the uMARS subscales.
Some of the apps included in the current study were of a more basic nature, often only offering users a journal in which they could self-monitor their diabetes self-management. Others were of a more complex nature, offering more interactive content and integration with social media, and would offer the user tailored suggestions based on their input. When scoring apps using the uMARS, it was noticed that many of the more basic apps scored highly on the functionality subscale. It is thought that this was because many of the basic apps only had limited operations to perform, and as such had lower loading times than some of the more complex apps, meaning they scored highly on functionality items such as response time.
The frequencies of identified BCTs give a good indication of the behavioural strengths and weaknesses of the current sample of apps. The most frequently identified BCT, 2.4 (self-monitoring of outcome(s) of behaviour; n = 39), was present in all but one of the included apps. Most reviewed apps included a journal or diary that users could use to track their diabetes self-management outcomes. Self-management outcomes were defined as blood glucose levels, while self-management behaviours were defined as any behaviour intended to manage blood glucose levels, such as exercise or insulin injections. BCT 2.3 (self-monitoring of behaviour; n = 36), was the next most frequently identified, with most apps allowing users to track self-management behaviours in addition to diabetes outcomes; 11.1 (pharmacological support; n = 32) was also offered in the majority of apps, indicating that this, along with the self-monitoring of the behaviour and outcomes, were techniques incorporated into most type 2 diabetes self-management apps.
The significant positive correlation between the total number of BCTs present in an app and the total mean uMARS score suggested that apps that were of a better quality in terms of engagement, functionality, aesthetics, and information also tended to include more behaviour change strategies. It appeared then that apps of a better quality across uMARS domains presented users with a higher number of behaviour change strategies. However, the low correlation between app pricing and store ranking with the total number of BCTs and uMARS quality score suggests that consumers cannot confidently associate app price or store ranking with behavioural content or quality. The results of the correlation analysis may highlight a potential shortcoming of the uMARS. As the aesthetics score was positively correlated with all other uMARS subscale scores and the overall quality score, such a result could lead to the conclusion that apps of a better aesthetical nature might be given higher scores on other uMARS subscales, rather than independently and objectively scoring each item of each subscale.
Strengths
The BCTTv1 enabled assessment of the apps with a taxonomy developed through research, using evidence-based BCTs. Another strength of this study was the use of two raters, both of whom had completed the BCTTv1 training, and viewed the training video for the use of the uMARS. This increased the objectivity and reliability of the data analysis not typically reported in other studies.
Limitations
Though the strengths of the BCTTv1 as an evaluative tool were evident it remains unknown which of the 93 BCTs were the most effective. It is possible that apps containing a lower number of more effective BCTs may be of more benefit to the user than one containing a higher number of less effective BCTs. The initial coding is crucial in establishing the categories to be analysed and while coding in the present study was cross-checked, errors can never be completed eliminated. In addition, during the quantification process there is an attempt to determine the direction of responses, that is, the extent to which responses are graded on a continuum (i.e.,’for’, ‘against’ or ‘neutral’). However, despite such scales, direction is not always so easily analysed (Kracauer, Reference Kracauer1952).
Professional Implications
Taking into account the relatively low number of identified BCTs across apps, a taxonomy such as the BCTTv1 may lend itself as a useful tool to school psychologists and counsellors who wish to evaluate or develop apps. The BCTTv1 could serve as a checklist of techniques to include when developing the app, ensuring the maximum possible number of evidence-based BCTs has been incorporated.
Some reviewed apps (e.g., Diabetes in Check), included links to informative articles, which contained BCTs such as 5.1 (Information About Health Consequences) and 5.3 (Information About Social and Environmental Consequences) in their text. These articles were included in collections of articles under submenus in the apps, and covered topics such as the benefits of effective type 2 diabetes self-management, incorporating type 2 diabetes self-management into a busy lifestyle, and information on the pathophysiology of type 2 diabetes. Such informative articles in self-management apps are a means by which developers can enhance the amount of behaviour change strategies presented in their apps.
School psychologists and counsellors interested in reviewing apps also need to be aware of the ever-changing mobile application environment. The changes made to update apps, combined with new apps being made available and other advances in technology, mean that the current study provides more of a snapshot in time of apps available at the time of selection and download, and does not necessarily provide longstanding information regarding the behavioural content of the apps. For this reason, we were not motivated to create a list of the best apps for managing diabetes as the list may have become outdated at the time of publication; rather, we wanted to provide a method by which school psychologists and counsellors could evaluate apps themselves. By being aware of the need to check for updates, school psychologists and counsellors will be better positioned to understand the strengths and limitations of content analyses to evaluate apps for use with chronic health conditions.
Conclusions
The potential for health apps to play a role in supporting the self-management of diabetes is substantial. Indeed, apps may have already become indispensable instruments for both people with diabetes and those individuals who support them. When used as an aide, quality apps may increase the effectiveness of therapy. However, students may need guidance from school psychologists and counsellors for matching apps to their health needs and goals. School psychologists and counsellors are well positioned to guide students in the most effective use of apps to assist in the management of this chronic condition. Finally, as apps are continually being updated, support professionals need to be alert to these changes and to be able to assess new apps and refine selection tools for matching apps with the needs of students with diabetes.
Funding
There are no funding agencies associated with this article.
Disclosure Statement
There are no conflicts of interest, financial or otherwise connected with this study.