I. INTRODUCTION
Due to their low density, beneficial strength to weight ratio and good casting properties, magnesium alloys have got considerable interests for light weight applications. Reference Liu, Jiang, Cao, Mei, Wu, Zhang, Xiao, Wang and Ding1 It has been considered as the excellent material to meet the lightweight requirement in the automobile, electrical equipment, aerospace, and national defense with its advantages. Reference Chang, Guo, Fu, Peng and Ding2,Reference Li, Wu, Chen and Jafari Nodooshan3 For many structural applications such as engine blocks and engine cradles that involve cyclic loading, Reference Luo4 it is important to understand the fatigue behavior of these alloys.
To date, with the increasing demand of magnesium alloys as lightweight parts for automobiles and personal computers applications, the thermodynamic properties, especially the thermal conductivity, have played an essential role in determining the performance of these magnesium parts. Reference Zhu, Gharghouri, Medraj, Lee and Pelton5 It has been found that magnesium alloys with rare earth usually have favorable casting property and mechanical properties at both room temperature and elevated temperature, which draw interests in aerospace industry. Reference Jiang, Liu, Wu and Ding6 But the most available studies about magnesium alloys with rare earth were based on metal mold casting which had a high cooling rate. However, the studies on sand mold casting whose cooling rate was slower than metal mold casting were relatively scanty. Reference Huo, Han and Liu7 The metal mold castings generally promoted some fatigue crack initiation due to the presence of casting defects such as gas pores or shrinkage at or below the casting surface which were detrimental to fatigue strength of alloys. Reference Horstemeyer, Yang, Gall, McDowell, Fan and Gullett8 It was suggested that the crack initiation takes up most of the fatigue life via high cycle fatigue tests. Reference Xu, Liu, Xu and Han9 Therefore, the fatigue properties of the castings were adversely affected by those casting defects.
Mg–10Gd–3Y–0.5Zr alloy has higher mechanical strength at both ambient temperature and elevated temperature, and has better creep resistance than existing magnesium alloys such as WE54 alloy. Reference Anyanwu, Kamado and Kojima10 It has been found that magnesium alloys with heavy rare earth elements, such as Gd and Y, were of the highest strength in all the Mg–RE alloys. Reference Li, Chen, Ma and Ke11 So, the Mg–Gd–Y–Zr alloys would meet greater application prospects in the aerospace and racing automotive industries, where weight saving means great value. In the past few years, the microstructure, deformation behavior, mechanical properties, and microstructural evolution of the Mg–Gd–Y–Zr series have been widely reported. Reference He, Zeng, Peng, Gao, Nie and Ding12 Due to safety and reliability requirements, it is necessary to study the fatigue behavior particularly at high cycle properties. The fatigue behavior of Mg–Gd–Y–Zr alloys prepared with permanent mold casting in different conditions has been investigated. Reference Liu, Wu, Zhai, Ding and Korsunsky13–Reference Dong, Liu, Song, Zhang, Ding and Korsunsky15 However, the comparison of fatigue strength between sand mold casting Mg–Gd–Y–Zr alloys and metal mold casting Mg–Gd–Y–Zr alloys was rarely reported.
Based on the above mentioned details, the present study aims to investigate the influence of different casting processes on high cycle fatigue behaviors of Mg–10Gd–3Y–0.5Zr alloy (named as GW103K) at ambient temperature.
II. EXPERIMENTAL PROCEDURE
A. Materials and sample preparation
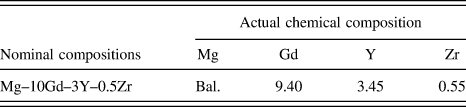
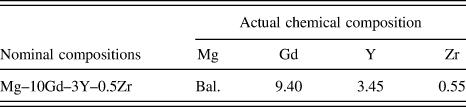
The materials used in this work were low-pressure sand mold (LPS) bars and gravity permanent mold (GPM) ingots of GW103K (Mg–10Gd–3Y–0.5Zr) alloy, as shown in Fig. 1. The GW103K were produced with pure metal Mg, and Mg–25Gd, Mg–25Y, Mg–30Zr master alloys. The details of the process were as follows. First, magnesium alloy was melted in a high-frequency induction furnace with appropriate MF magnesium covering flux. Then Mg–25Gd and Mg–25Y master alloys were added through the covering flux when the furnace temperature was up to 730–750 °C. The master alloys were completely melted at ∼780 °C for 30 min. The preheated Mg–30Zr master alloy was added at ∼800 °C. The MJ refining agent for magnesium alloy was added when the temperature is decreased to ∼760 °C. The slag was cleaned out after 4–6 min stirring. The molten metal was heated to ∼780 °C again after adding some MF flux. Reference Jiang, Liu, Li, Wu and Ding16 The molten metal was cast into the prepared mold. The mold temperature was 200 °C. Then the samples were slowly cooled at room temperature in atmosphere. Actual chemical compositions were measured by an inductively coupled plasma analyzer (ICP, Plasma-400; Perkin Elmer Inc., Waltham, Massachusetts), and the results are listed in Table I.
(a) Low-pressure sand mold (LPS) bars; (b) gravity permanent mold (GPM) ingots.

Chemical composition (wt%) of the Mg–10Gd–3Y–0.5Zr alloys.
Based on the experimental results in Ref. Reference Liu, Jiang, Cao, Mei, Wu, Zhang, Xiao, Wang and Ding1, after casting, the bars (LPS) and ingots (GPM) were T6 heat treated, i.e., for LPS bars, first solutionized at 525 °C for 12 h, cooled in the air and then aged at 250 °C for 10 h. While GMP ingots were first solutionized at 500 °C for 6 h, cooled in the air and then aged at 225 °C for 16 h.
B. Tensile testing
Specimens for tensile testing were machined with the load axis parallel to the cast bars for LPS and cast block shape for GPM, respectively. Tensile properties of the tested samples were performed at the initial strain rate of 5 × 10⁻⁴ s−1 referred to the relevant standard of ASTM: E8M-13a using cylindrical specimen with marked dimension of 33 mm gauge length and 5 mm diameter on Zwick/Roell Z020 tensile machine at room temperature.
C. High cycle fatigue testing
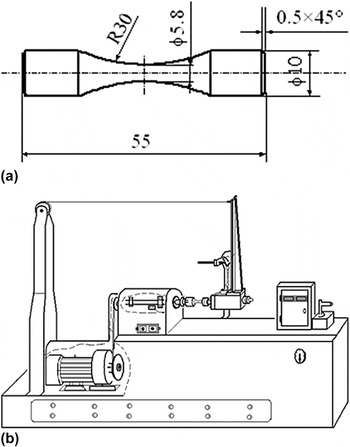
The hour-glass-shaped round specimens [Fig. 2(a)] were used for stress-controlled high cycle fatigue tests at room temperature. The dimensions of the specimens follow the instruction of the ASTM E 466 specification with a gauge diameter of 5.8 mm. After machining, a layer of thickness of about 200 µm was removed from the specimen surface by electrolytic polishing in a solution of 90% (volume fraction) ethylene-glycol-monomethyl-ether and 10% hydrochloric acid at −25 °C and 17 V to avoid the influence of machining on the fatigue results.
(a) Hour-glass shaped round fatigue specimens; (b) rotating bend fatigue machine.

Stress-controlled high cycle fatigue tests were performed on the rotating bending fatigue machine [Fig. 2(b), stress ratio R = −1] at a frequency of about 100 Hz in laboratory air. The test method followed the procedure described in former report. Reference Zhang and Lindemann17 The ‘Standard Method' of fatigue testing was utilized, which is the most common method typically used when only a few test specimens are available. In this method, a low number of tests (1–3) were conducted at a set of stress amplitudes which spanned the expected stress range of material; the stress amplitude and number of cycles to failure were then recorded for each specimen.
The formula to calculate fatigue load is as follows,
 $${\sigma _{\rm{a}}} = 32mgL/\left( {\pi {d^{\rm{3}}}} \right)\quad ,$$
where m for load, g for constant of gravity acceleration, L for the arm of force, and d for the diameter of sample.
All samples were loaded to fracture or the maximum cycles (N = 107). If sample did not fracture until 107 cycles, it was disposed as ‘run out'. According to the former research results, Reference Dong, Liu, Song, Zhang, Ding and Korsunsky15 the fatigue testing should be started from the stress that is slightly higher than expected fatigue strength, and the stress increment is 5 MPa. If the sample runs out, the stress should increase 5 MPa for next sample. Otherwise, the stress should decrease 5 MPa for next sample. 12–15 samples were chosen for each experimental group.
The S–N curve was obtained with point by point tracing method according to the results of fatigue testing. Ordinate is stress (σ) and abscissa is lgN f (N f for fatigue life of alloy). Then, the distinction of fatigue invalidation behavior of two conditions of the alloy could be compared according to S–N curve.
D. Microstructural and fractographic analyses
The microstructures of the GW103K alloy were carried out with ZEISS Optical Microscope (OM). Samples for microstructural analysis were intercepted from the fatigue samples, polished and then etched in 4% nitric acid alcohol solution for 25–35 s.
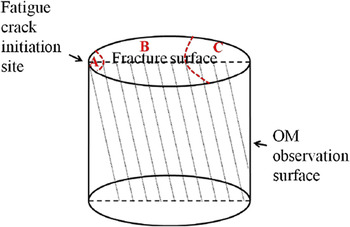
Fracture surface of the fatigue samples was observed by a Philip-505 scanning electron microscope (SEM; FEI Company, Almelo, The Netherlands). The specimens for SEM were intercepted from fractured samples using a water-cooled low speed diamond wheel along the longitudinal direction and fatigue crack propagation direction starting from the crack initiation site, as shown in Fig. 3. To avoid the fracture oxidation and pollution, the SEM should be done as soon as possible after mechanical properties testing, and proper fracture surface protection measures should be done.
Illustration of the OM observation surface.

III. RESULTS
A. Microstructure
Figure 4 presents the typical microstructures of the LPS and GPM GW103K alloy in as-cast and T6 conditions. As can be seen from Fig. 4, the metallographic structure of the LPS and GPM alloy in as-cast condition is obviously different. They are all composed of α-Mg matrix and divorced eutectic phase. But the eutectic phase of the LPS alloy distributes in the grain boundary of α-Mg matrix. In addition, there is some small eutectic phase which extends to the interior of the crystal. While the eutectic phase of the GPM alloy only distributes in grain boundary [see Fig. 4(c)]. After T6 heat treatment, the microstructure of the LPS and GPM alloy has no obviously distinction [see Figs. 4(b) and 4(d)]. The eutectic phase cannot be found in grain boundary, and the structure is mainly isometric crystal.
Microstructures of GW103K alloys by different casting process: (a) LPS (as-cast); (b) LPS (T6); (c) GPM (as-cast); (d) GPM (T6).

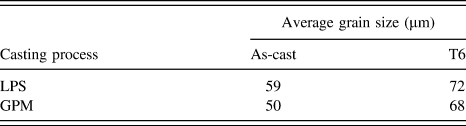
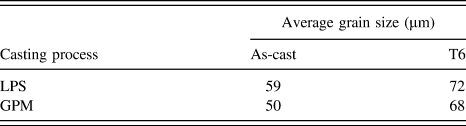
Meanwhile, the average grain size of the LPS and GPM alloy in as-cast and T6 conditions is shown in Table II, which is obtained using liner interception method. As can been known, the grain size of the LPS alloy (59 µm) is a little larger than that of the GPM alloy (50 µm) in as-cast condition. In the state of T6, the grain size of two tested casting methods (72 and 68 µm) is similar.
Average grain size of the GW103K alloys in different conditions.
The biggest difference between LPS and GPM is the solidification cooling rate. The cooling rate of the LPS alloy is slower than that of the GPM alloy, which leads to finer grain size of the GPM alloy. For LPS, the alloy cools slowly, which could be equivalent to the short-term solid solution treatment. It could be also explained that a small amount of γ phase (cuboid-shaped phase) exists in the LPS GW103K alloy. When the temperature is slightly higher or similar to the aging heat treatment temperature, the alloy would be equivalent to the short-term aging heat treatment or after aging heat treatment. So the flocculent eutectic phase found in α-Mg matrix can be explained.
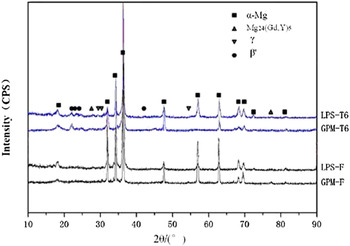
Figure 5 shows x-ray diffraction (XRD) analysis result of the GW103K alloy in different conditions. As can be seen from Figs. 4 and 5, the LPS alloy in as-cast condition mainly consists of α-Mg matrix, Mg24 (Gd, Y)5, secondary phase and γ phase (cuboid-shaped phase), while there is no γ phase in GPM alloy in as-cast condition. After solid solution treatment, α-Mg matrix and few γ phases can be found under both casting methods. There is no obvious distinction between the two methods after T6 treated (see Figs. 4 and 5), the microstructure of the LPS and GPM alloy both mainly consists of α-Mg + γ + β′ in T6 condition. Reference Liu, Jiang, Cao, Mei, Wu, Zhang, Xiao, Wang and Ding1
XRD patterns of the GW103K alloys in different conditions.

B. Tensile properties
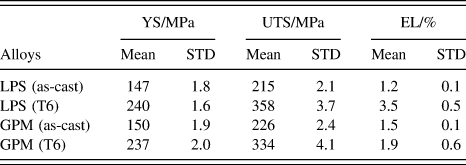
Table III shows the tensile properties of both LPS and GPM GW103K alloy in as-cast and T6 conditions at ambient temperature, respectively. For as-cast alloy, the yield strength (YS), ultimate tensile strength (UTS), and elongation (EL) of the LPS alloy are a bit lower than those of the GPM alloy. Compared to the sand-cast LPS alloy, large improvements of the YS, UTS, and EL are obtained by T6 heat treatment, i.e., the YS, UTS, and EL of the T6 treated LPS alloy increased to 240 MPa, 358 MPa, and 3.5%, respectively. In addition, the YS, UTS, and EL of the T6 treated GPM alloy increased to 237 MPa, 334 MPa, and 1.9%, respectively. It is easy to find that the improvements of the LPS GW103K alloy are more obvious than those of the GPM alloy.
Tensile properties of the GW103K alloys in different conditions a .
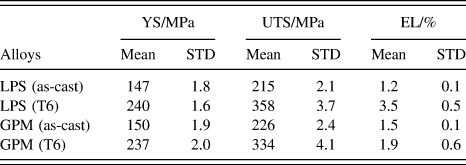
a STD refers to the standard deviation from the mean value.
C. S–N curve
The S–N curves of the LPS and GPM GW103K alloy under rotating bending loading (R = −1) at a frequency of about 100 Hz in air are presented in Fig. 6. The results showed that the fatigue strengths (at 107 cycles) of both LPS and GPM alloy in as-cast condition are both approximately 90 MPa. After T6 heat treatment, the fatigue strength and fatigue life of the LPS alloy both increase obviously. The fatigue strength of the T6 treated LPS alloy is about 110 MPa, i.e., the improvement of 22.6% in fatigue strength has been achieved. However, the fatigue strength and fatigue life of the T6 treated GPM alloy does not improve much, and the fatigue strength is approximately 100 MPa, which increases by 11.1%. In addition, the dispersion of fatigue life of the GPM alloy is large, which becomes further larger after T6 heat treatment.
S–N curves of the GW103K alloys produced by different casting process (The figures indicate the number of samples that do not fracture after 107 cycles.).

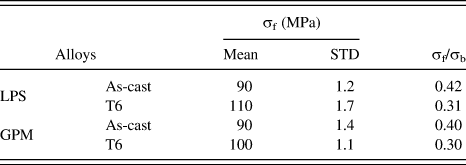
To correlate the fatigue strength (σf, at 107 cycles) with the UTS (σb), the ratio σf/σb for the investigated alloy are shown in Table IV. As seen from Table IV, the fatigue strength of the T6 alloy is higher than that of the as-cast alloy for both LPS and GPM conditions; meanwhile, the fatigue strength of the LPS GW103K alloy is higher than that of the GPM GW103K alloy in T6 condition. The ratios for the investigated alloy in as-cast condition are about 0.42 and 0.40, respectively. While those for the alloy in T6 condition are about 0.31 and 0.30, in agreement with the value of magnesium (0.25–0.5) reported in literature. Reference Liu, Jiang, Cao, Mei, Wu, Zhang, Xiao, Wang and Ding1,Reference Zhu, Gharghouri, Medraj, Lee and Pelton5,Reference Horstemeyer, Yang, Gall, McDowell, Fan and Gullett8,Reference He, Zeng, Peng, Gao, Nie and Ding12 The distinction of the S–N curves and the fracture morphologies between LPS and GPM alloy should be ascribed to the different microstructures and casting defects, which will be discussed as follows.
Fatigue properties of the GW103K magnesium alloys in different conditions a .

a STD refers to the standard deviation from the mean value.
D. Fatigue fracture analysis
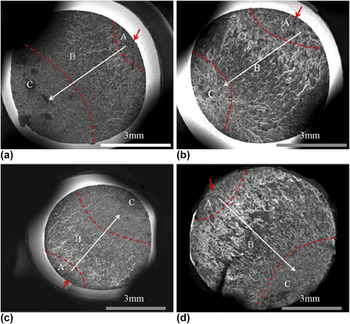
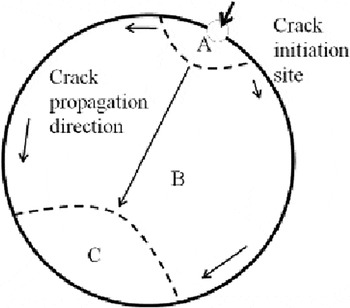
Figure 7 shows the SEM images of fatigue fractures of the GW103K alloy in different conditions, where the fractures are relatively flat. The all fractures can be divided into three regions, including crack initiation region (Region A), steady crack propagation region (Region B), and fracture region (Region C), as shown in Fig. 8.
SEM images showing the full views of the fatigue fracture surface: (a) LPS (as-cast, 100 MPa, 8.9 × 10⁵), (b) LPS (T6, 120 MPa, 2.25 × 10⁶), (c) GPM (as-cast, 100 MPa, 1.16 × 10⁶), (d) GPM (T6, 120 MPa, 1.03 × 10⁶).

Illustrations of fractograph under rotating bend loads.

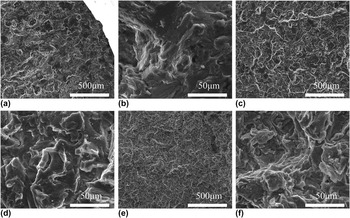
The secondary electron images of fatigue fracture of the LPS GW103K alloy in as-cast condition are shown in Fig. 9. As seen in Figs. 9(a) and 9(b), the large and broken eutectic phases can be seen near fracture crack initiation region. And as shown in Figs. 9(c) and 9(d), fracture images (Region B) obviously differ from Region A, some fatigue ditches can be seen from Fig. 9(c). Also, some broken eutectic phases can be observed on fracture surface, but content is less than that in Region A. It is indicated that the crack neither propagates along interface of eutectic phase or α-Mg matrix, nor grows mainly through the eutectic phase. In addition, some secondary cracks can be found in the α-Mg matrix. At last, in Figs. 9(e) and 9(f), fracture images differ from the other two regions which tend to be rough (Region C). The content of secondary phase in Region C is more than that in other two regions, and a large amount of secondary cracks can be observed in the phase of divorced eutectic. The fracture surface is composed of broken secondary phase, cleavage plane, and the tearing edges.
SEM images of fatigue fracture surface for LPS GW103K alloy in as-cast condition: (a) and (b) crack initiation region; (c) and (d) crack propagation region; (e) and (f) fracture region.

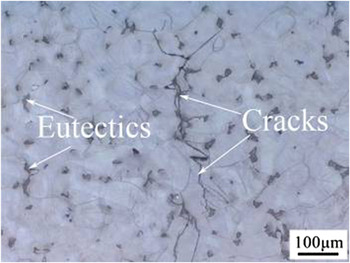
To further analyze the crack propagation mechanism of the LPS GW103K alloy in as-cast condition, the microstructures of fracture samples were investigated by using OM, as shown in Fig. 10. The broken eutectics and cracks in α-Mg matrix can be observed in crack initiation region. It shows that the crack of as-cast LPS alloy mainly initiates from eutectic phases.
Optical image of the specimens section parallel to the gauge length near the crack initiation beneath the fracture surface of the LPS GW103K alloy in as-cast condition (under 100 MPa).

Figure 11 shows the fatigue fracture images of the LPS GW103K alloy in T6 condition. The characteristic of different regions in the T6 alloy is more obvious than that of the as-cast alloy. As seen from Figs. 11(a) and 11(b), some larger plane with size close to grain size can be observed on fracture surface. Some secondary cracks can be observed near the position of fracture initiation (Region A). As shown in Figs. 11(c) and 11(d), fracture images (Region B) obviously differ from Region A, less secondary cracks can be found, and the amount and size of grain boundaries are bigger than that of Region A. In addition, there are some micro cracks that are vertical with main crack. From Figs. 11(e) and 11(f), fracture images differ from the other two regions which tend to be rough (Region C). The fracture surface is composed of cleavage plane and the tearing edges. Meanwhile, a small amount of grain boundary can be observed.
SEM images of fatigue fracture surface for LPS GW103K alloy in T6 condition: (a) and (b) Crack initiation region; (c) and (d) Crack propagation region; (e) and (f) Overloading region.

Figure 12 presents the OM images of fatigue fracture of the LPS GW103K alloy in T6 condition. Some slip lines can be observed near the crack, and the lines are parallel to each other in a grain. The secondary crack of the T6 alloy initiates within the grain, and is consistent with the slip line orientation, and the long crack is also connected with the slip line. All of these indicate that the final fatigue crack is likely to initiate from cracking slip bands.
Optical image of the specimens section parallel to the gauge length near the crack initiation beneath the fracture surface of the LPS GW103K alloy in T6 condition (under 100 MPa).

Figures 13 and 14 present the fracture images of the GPM GW103K alloy in as-cast and T6 conditions, respectively. Compared with the LPS alloy, the fatigue cracks of the GPM alloy not only initiate from the surface of samples but also partly initiate from the porosity and inclusion around the surface of samples. The most crucial factors that influence the microstructure and performance of alloy are the amount of casting defects, size, and distribution. As seen from the crack propagation and fracture regions of the GPM alloy in as-cast and T6 conditions, the main fracture images are similar to the LPS alloy. However, some fatigue cracks may propagate along the casting defects in GPM alloy.
SEM images of fatigue fracture surface for GPM GW103K alloy in as-cast condition: (a) and (b) crack initiation region; (c) and (d) crack propagation region; (e) and (f) fracture region.

SEM images of fatigue fracture surface for GPM GW103K alloy in T6 condition: (a) and (b) crack initiation region; (c) and (d) crack propagation region; (e) and (f) fracture region.

IV. DISCUSSION
The fatigue strength of cast metal materials is generally determined by the microstructure, such as the matrix and the size and distribution of casting flaws which have bearing on the casting parameters. Reference Dong, Liu, Song, Zhang, Ding and Korsunsky15
As-cast Mg–Gd–Y–Zr magnesium alloy is mainly composed of α-Mg matrix and irregular eutectic phase. The lower concentration of solute atoms in matrix induces the smaller lattice distortion extent. In addition, the strength of matrix is low, but it is easy to slip and twin. However, eutectic phase that distributes around matrix is hard and brittle, which can be observed in tensile fracture images. Although the phase has some role for hardening, it seriously damage alloy plastic properties. The fracture under tensile loading is mainly caused by eutectic phase fracture.
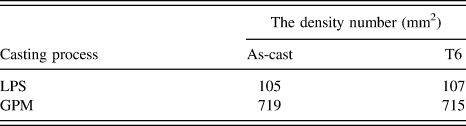
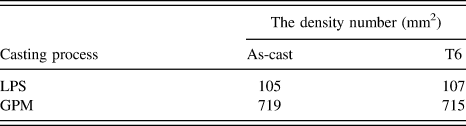
After T6 treatment, the precipitation of β′ phase is meanly distributed in α-Mg matrix, which obstructs twinning deformation and dislocation slip. The dislocation which moves under exterior loading has to bypass β′ phase and leaves a dislocation ring around β′ phase. So the dislocation density increases which leads to higher motion resistance of dislocation and higher alloy strength. Similar results have been reported in Refs. Reference Fu, Peng, Nie, Jiang, Ma and Bourgeois18–Reference Ren, Huang, Zhou, Xu and Liu20. On the other hand, the stress load on T6 alloy would uniformly distribute in alloy which would increase plastic property because of smaller grain size. However, the defects and inclusions existing in GPM alloy significantly damaged the performance of alloy. The number density of the porosities in T6 conditions is presented in Table V. It can be found that the number density of the GPM alloy is higher than the LPS alloy. It was found that casting defects have a detrimental effect on fatigue life by shortening not only the crack propagation period, but also the initiation period. Reference Wang, Apelian and Lados21
The number density of the porosities in both conditions of different casting methods.
In defect-free specimens, as analysis above, fatigue cracks mainly initiate related to slip bands, which are also respectively indicated by Refs. Reference Li, Fu, Peng, Wang, Jiang and Wu22–Reference Höppel, Prell, May and Göken25, since twinning deformation hardly occurs due to the suppression effect of precipitates in the grains. Reference Clark26
Comparing the fracture images of the LPS and GPM GW103K alloy, there is no obvious difference in SEM or OM images. In as-cast condition, there are fatigue dimples, secondary crack, and broken eutectic phase in propagation region. The image of fracture region is similar to the tensile fracture images. Mainly, there are divorced eutectic phase, tearing edges, and cleavage plane. In T6 condition, there are fatigue ditches, fatigue striation, and secondary crack in propagation region. Meanwhile, there are a large amount of tearing edges, cleavage plane, and few grain boundaries in fracture region. The difference is that some porosities and precipitations can be observed in GPM GW103K alloy.
V. CONCLUSIONS
In this present study, the influence of different casting processes on high cycle fatigue behavior of the Mg–10Gd–3Y–0.5Zr alloy was investigated by using porosity-free low-pressure sand-casting bars (LPS) and gravity permanent mold casting ingots (GPM). The following conclusions can be drawn:
-
(1) The microstructure of the LPS alloy in as-cast condition is composed of α-Mg matrix and eutectic phase which mainly distributes in the grain boundary of the matrix. Compared with the LPS alloy, some inclusions and flaws can be found in the as-cast GPM alloy. After T6 heat treatment, the eutectic phase of both LPS and GPM alloy dissolves into matrix and grain size increases slightly while the inclusions still remains in the GPM alloy.
-
(2) The fatigue properties of both LPS and GPM alloy in as-cast condition are determined by Mg matrix and eutectic phase, and the 107 cycles fatigue strengths are both approximately 90 MPa. However, the fatigue property improvement for LPS alloy by T6 heat treatment is significantly superior to that of GPM alloy, i.e., the fatigue strength of the T6 treated LPS and GPM alloy increased to 110 and 100 MPa after T6 heat treatment, respectively. This corresponded to the improvement of about 22 and 11%, respectively.
-
(3) The different degree of enhancement of fatigue properties for LPS and GPM alloy by T6 heat treatment is related to different crack initiation mechanism. The fatigue crack of the LPS alloy initiates from the free surface of the sample, while the crack of the GPM alloy initiates from porosities or inclusions near the surface of the sample. Meanwhile, the crack of slip band has a crucial effect on the fatigue crack initiation of both as-cast and T6 conditions for LPS alloy.
ACKNOWLEDGMENTS
This work was sponsored by Aerospace Science and Technology Innovation Fund of China Aerospace Science and Technology Corporation (No. SAST2015047), Shanghai Rising-Star Program (No. 14QB1403200) and National Natural Science Foundation of China (No. 51275295).