INTRODUCTION
Ecological specialization has been long debated and inconsistently used in the literature. Particularly in Parasitology, where hosts may vary in spatial aggregation, abundance and quality, to test this assumption more thoroughly is extremely difficult (Gandon et al. Reference Gandon, Ebert, Olivieri, Michalakis, Mopper and Strauss1997). In the last two decades, there have been a growing number of indices proposed in the literature to measure specialization for different levels of biological organization from individuals to community (reviewed by Devictor et al. Reference Devictor, Clavel, Julliard, Lavergne, Mouillot, Thuiller, Venail, Villéger and Mouquet2010). In the last years, many researchers have used tools derived from graph theory to study the interaction patterns between parasites and their hosts all around the world. Such studies have shown that host–parasite networks tend to be more specialized and compartmentalized compared with other types of ecological interactions (e.g. pollination or seed-dispersal) (Poulin, Reference Poulin2010; Wells et al. Reference Wells, Lakim and Beaucournu2011; Krasnov et al. Reference Krasnov, Fortuna, Mouillot, Khokhlova, Shenbrot and Poulin2012; Bellay et al. Reference Bellay, de Oliveira, Almeida-Neto, Abdallah, de Azevedo, Takemoto and Luque2015).
Most studies dealing with host–parasite networks use the H 2′ index proposed by Blüthgen et al. (Reference Blüthgen, Menzel and Blüthgen2006) to calculate complementary specialization in host–parasite interaction networks. This quantitative index is derived from Shannon Entropy and is based on the deviation from the expected probability distribution of interaction frequency. However, although this index is not affected by changes in sampling intensity (Blüthgen et al. Reference Blüthgen, Menzel and Blüthgen2006, Reference Blüthgen, Menzel, Hovestadt, Fiala and Blüthgen2007), little is the knowledge about how this index could be sensitive to changes by random allocation of species interactions in small networks (but see: Blüthgen et al. Reference Blüthgen, Menzel and Blüthgen2006; Dormann et al. Reference Dormann, Fründ, Blüthgen and Gruber2009).
We recently read the article entitled ‘The effects of seasonality on host–bat fly ecological networks in a temperate mountain cave’ written by Rivera-García et al. (Reference Rivera-García, Sandoval-Ruiz, Saldaña-Vázquez and Schondube2016), and we agree with many of their statements. Studying geographical and seasonal variation of host–parasite interactions allow us to increase our knowledge about the ecological and evolutionary dynamics of species interactions. Further, this kind of data is extremely useful to evaluate the susceptibility of a host species to a parasite species or even for public policy. However, the authors used the H 2′ index and one extremely limited dataset (only four parasites species and two bats species in dry-cold and dry-warm seasons) to conclude that the specialization of host-bat fly networks differed throughout the year and they attributed part of this variation to the arrival of migratory species. We strongly disagree with part of the analysis performed and the manuscript's conclusion mainly because two of their networks have only a 4 × 2 matrix as presented in their Figure 3. In this study, we conducted a series of analyses based on both simulated and empirical data to show that H 2′ values in small matrices are strongly affected by randomly allocation of species interactions to another cell in the network matrix and that therefore, the results and conclusions presented in Rivera-García et al. (Reference Rivera-García, Sandoval-Ruiz, Saldaña-Vázquez and Schondube2016) are only an artefact of the dataset used.
METHODS
Simulations and analyses
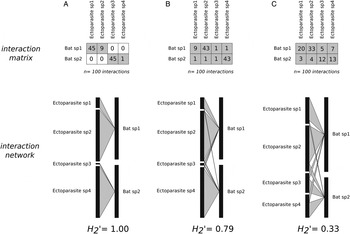
Initially and to show that the H 2′ values are very sensitive to changes for small networks, we build a theoretical network similar to that shown in the Figure 3 available in Rivera-García et al. (Reference Rivera-García, Sandoval-Ruiz, Saldaña-Vázquez and Schondube2016) and calculated the observed H 2′. Then, we maintained the total number of interactions fixed and moved just some few interactions among species under two different scenarios (‘rewiring’). As a result, we observed that for small matrices we can get a large variation in the H 2′ values (from 0·33 to 1, approximately 67% of variation) (Fig. 1).
Theoretical examples of bat–ectoparasite interactions with different distributions of interactions between species where we are keeping stable the total number of species (two bats and four ectoparasites) and interactions (n = 100) and looking for its effects on the values of network specialization (H 2′).

Additionally, we tested if the network observed by Rivera-García et al. (Reference Rivera-García, Sandoval-Ruiz, Saldaña-Vázquez and Schondube2016) was more specialized than expected under a null distribution. For this, we used Table 2 available in such study to build an interaction network involving only five parasites species and five bats species. We then estimated the significance of the observed H 2′ value with a Monte Carlo procedure in which 1000 random matrices were generated using two quantitative null models: swap.web (where the marginal totals and connectance are identical to those observed) and shuffle.web (where the number of interactions, links, connectance are identical to those observed). Both null models are implemented in the bipartite package (Dormann et al. Reference Dormann, Fründ, Blüthgen and Gruber2009) of R (R Development Core Team, 2016). Note that, even though the authors did not report the size of the networks over the months it is expected that the observed network by month were even smaller than the data available in Table 2 of their paper.
Finally, we also carried out a systematic simulation study on the 50 empirical host–parasite networks to compare the effect of network size (i.e. number of species and interactions) on the H 2′ values. Data were easily obtained from the Supplementary Material available in Hadfield et al. (Reference Hadfield, Krasnov, Poulin and Shinichi2013) involving flea abundance on small mammals (Soricomorpha and Rodentia) in different regions of the Palearctic. To test our prediction that small networks would be more sensitive to changes in the distribution of interactions, we randomized each of the 50 networks (n = 1000 randomization for each) using the two above-listed null models and calculated the Coefficient of Variation (CV), as a standardized measure of dispersion of the distribution in the H 2′ values. If our prediction is correct, small networks will have higher CV values compared with larger networks. We used a GLM (General Linear Model) to test the effects of network dimensions on the observed H 2′ (with a Quasibinomial error distribution) and CV (with a Gamma error distribution) values. All analyses were performed in R version 3.3.2 (R Development Core Team, 2016).
RESULTS
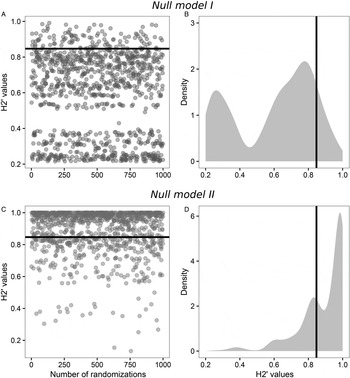
We observed that the H 2′ value found by Rivera-García et al. (Reference Rivera-García, Sandoval-Ruiz, Saldaña-Vázquez and Schondube2016) (H 2′ = 0·84) in their total network did not differ from expected for networks of equal species richness and similar heterogeneity with regard to interactions among species (Null Model I: Meansimulated ± s.d.: 0·59 ± 0·23, P = 0·45; Null Model II: Meansimulated ± s.d.: 0·88 ± 0·13, P = 0. 33). Moreover, for both null models the H 2′ values varied from highly specialized (H 2′ = 1·0) to highly generalized (H 2′ = 0·2) (Fig. 2).
Comparison in the values of specialization (H 2′) between the total bat–ectoparasite network (black line) extracted from Rivera-García et al. (Reference Rivera-García, Sandoval-Ruiz, Saldaña-Vázquez and Schondube2016) and the expected for random networks. In the left graphs, each point represents one value of H 2′ for each randomized network according to: (A) null model I (P = 0·45) and (B) null model II (P = 0·33) (n = 1000 replicates for each null model). The graphs in the right represent the distribution of H 2′ values for the randomized networks according to: (C) Null model I (swap.web) and (D) Null model II (shuffle.web). (See text for further details about each null model).

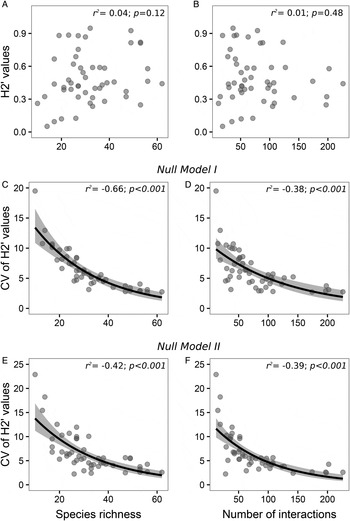
When we evaluated the effects of network dimensions on the H 2′ values, it seems that the observed values of this index are stable independent of the number of species and interactions (Fig. 3A and B). However, our simulations indicate that the H 2′ values are much more sensitive to the redistribution of interactions in small networks compared to large networks, with CV values approximately ranging from 2·1% for larger networks to 22·8% for small networks (more than ten times) (Fig. 3C–F).
Effects of (A) species richness and (B) number of interactions on the observed values of specialization (H 2′) of 50 empirical host–parasite networks extracted from Hadfield et al. (Reference Hadfield, Krasnov, Poulin and Shinichi2013), and (C–F) on the Coefficient of Variation (CV) of the H 2′ values of each of the networks randomized according to: Null model I (swap.web) and Null model II (shuffle.web) (n = 1000 replicates for each null model). The smoothed area represents the best-fit model with 95% of confidence intervals.

DISCUSSION
In this study, we show that the results found by Rivera-García et al. (Reference Rivera-García, Sandoval-Ruiz, Saldaña-Vázquez and Schondube2016) are induced by the limited database used for their study, since the authors used very small networks, in which are highly sensitive to small changes (as shown by us) to conclude that ‘Specialization of host-bat fly ecological networks was lower in the rainy season’. Comparing only the observed values of H 2′ between the seasons for very small networks leads the reader to biased conclusions, mainly because these networks may do not differ from random expectation.
In conclusion, we call attention to the risk of use H 2′ to calculate specialization in small networks, mainly because this index is strongly affected by randomly allocation of species interactions to another cell of the matrix in small networks. To avoid this mistake, we highly recommend the use of null model corrections (e.g., Δ- and z-transformations) to standardize the effects of network size on the observed H 2′ values as previously proposed by Dormann et al. (Reference Dormann, Fründ, Blüthgen and Gruber2009). It is important to mention that species interaction networks are proposed to study complex systems composed of several parts that interact among them to generate new qualities in the collective behaviour. Therefore, we should carefully evaluate whether the dataset we are studying fits within that definition. In short, Rivera-García et al. (Reference Rivera-García, Sandoval-Ruiz, Saldaña-Vázquez and Schondube2016) present a remarkable study to measuring specialization in bat–parasite networks; however, since they used very small matrices without any correction, we recommend revisions to their local and regional conclusions in order to avoid erroneous interpretation about the ecological dynamics of ‘specialization’ in host–parasite networks.
ACKNOWLEDGEMENTS
Thiago Izzo, Victor Rico-Gray and Carlos Cultid provided us valuable advice on analysis approaches and discussion. Nico Blüthgen has provided us useful information on the effect of network dimensions on H 2′ values.
FINANCIAL SUPPORT
This research received no specific grant from any funding agency, commercial or not-for-profit sectors.