1 Background
Over the past 30 years, defined contribution (DC) pension plans have become the norm in the private sector in the USA, as employers have used them to replace more traditional defined benefit (DB) plans. Unlike DB plans, workers offered a DC plan are not required to participate. Because participation often requires a contribution out of one's salary and into a tax-deferred savings account, many individuals choose not to take part in the plan, even when eligible. The decision not to participate in an available DC plan is especially common amongst low-income individuals, who are also less likely to be offered a plan in the first place.Footnote 1 This ‘double-whammy’ of high rates of voluntary non-participation and low rates of DC availability amongst low-income workers has become a serious concern of policy makers, especially as demographic shifts and impending reforms will likely result in Social Security replacing a smaller share of pre-retirement earnings in the future.Footnote 2
Although analysts debate the degree of retirement preparedness, most agree that within the bottom of the income distribution there is a significant share of individuals at risk of not being able to maintain their standard of living in retirement.Footnote 3 One suggested approach for improving the retirement security of this group, which has recently gained momentum, focuses on shrinking or eliminating the gap in pension coverage and/or sponsorship between low-income workers and others. Simply put, the policy would require firms that currently do not offer retirement plans to set up individual retirement accounts (IRAs) or a form of tax-deferred retirement savings vehicles for their employees.Footnote 4
However, given the voluntary nature of participation in these tax-deferred, DC-type saving vehicles, it is unclear how effective such a policy would be, since low-income workers could always decline to participate. For example, the standard lifecycle theory suggests various reasons for why an eligible worker might refuse to contribute to a tax-deferred pension plan even when offered a matching employer contribution: those include liquidity constraints, short-sidedness, strong preference for current versus future consumption (low discount factor), risk-aversion and the unwillingness to tie up money in less-liquid assets such as a 401(k) plan, expectation of higher future tax rates. Advocates of the policy, however, note that even among low-income workers, the majority of individuals currently offered a DC pension plan participate. Thus, it would follow that if more low-income workers had access to a plan, most would participate. Of course, care must be taken in rendering this interpretation. As is always the case when looking at a group that has self-selected into an outcome (e.g., college entry, program participation, etc.) one must be concerned that the group that has selected in, in this case workers offered a DC pension, differ in unobservable ways from those who have not. For example, it seems possible that low-income workers with access to DC pensions may be ‘savers’ who looked hard for a job that offered a tax-deferred channel for saving, and are thus more likely to participate in the plan than would be other low-income workers. Thus, in this paper we control for selection into the pensioned job. In doing so, we seek to answer the fundamental question of interest to policy makers: how likely are workers, and in particular low-income workers, to participate in a DC pension plan that they did not have access to prior to the policy? To our knowledge, this is not a question that has been addressed in the literature to date.
DC plans have been present and gaining popularity for more than 30 years now, which in turn has stimulated a growing literature that examines the determinants of individuals’ participation and saving decisions in these plans. Studies have used varied sources of data – household survey data, administrative earnings and contribution data, employee records in the specific firms, as well as plan-level data, and have found generally similar results. Among the strongest positive determinants of participation and contribution are age, marital status, income or earnings, wealth, education, as well as the existence of an employer match and more recently, the plan having an automatic enrollment provision (Bassett et al., Reference Bassett, Fleming, Anthony and Rodrigues1998; Kusko et al., Reference Kusko, Poterba, Wilcox, Mitchell and Schieber1998; Munnell et al., Reference Munnell, Sunden and Taylor2003; Even and Macpherson, Reference Even and MacPherson2005; Huberman et al., Reference Huberman, Iyengar and Jiang2007; Beshears et al., Reference Beshears, Choi, Laibson, Madrian and Wise2010; Dushi et al., Reference Dushi, Iams and Tamborini2011).
Whereas previous studies have used a variety of empirical techniques, they have all based their analysis on individuals who currently have access to a plan through their employer. However, that does not include the entire population of workers and importantly does not include workers without a plan – the group policy makers are most interested in with respect to the automatic-IRA policy. This paper addresses this deficiency by estimating a participation model that controls for selection into a plan, allowing accurate out-of-sample (i.e., to individuals without a pension) predictions on the effect of expanding pension coverage. We find that individuals currently without a DC pension are less likely than those with a pension to participate in an offered DC plan, even when controlling for observable characteristics. Thus, while the expansion of DC plans to workers not currently covered by such plans will improve pension coverage, the effect may not be as large as expected based on currently observed pension participation rates.
2 Data and trends in pension coverage and participation
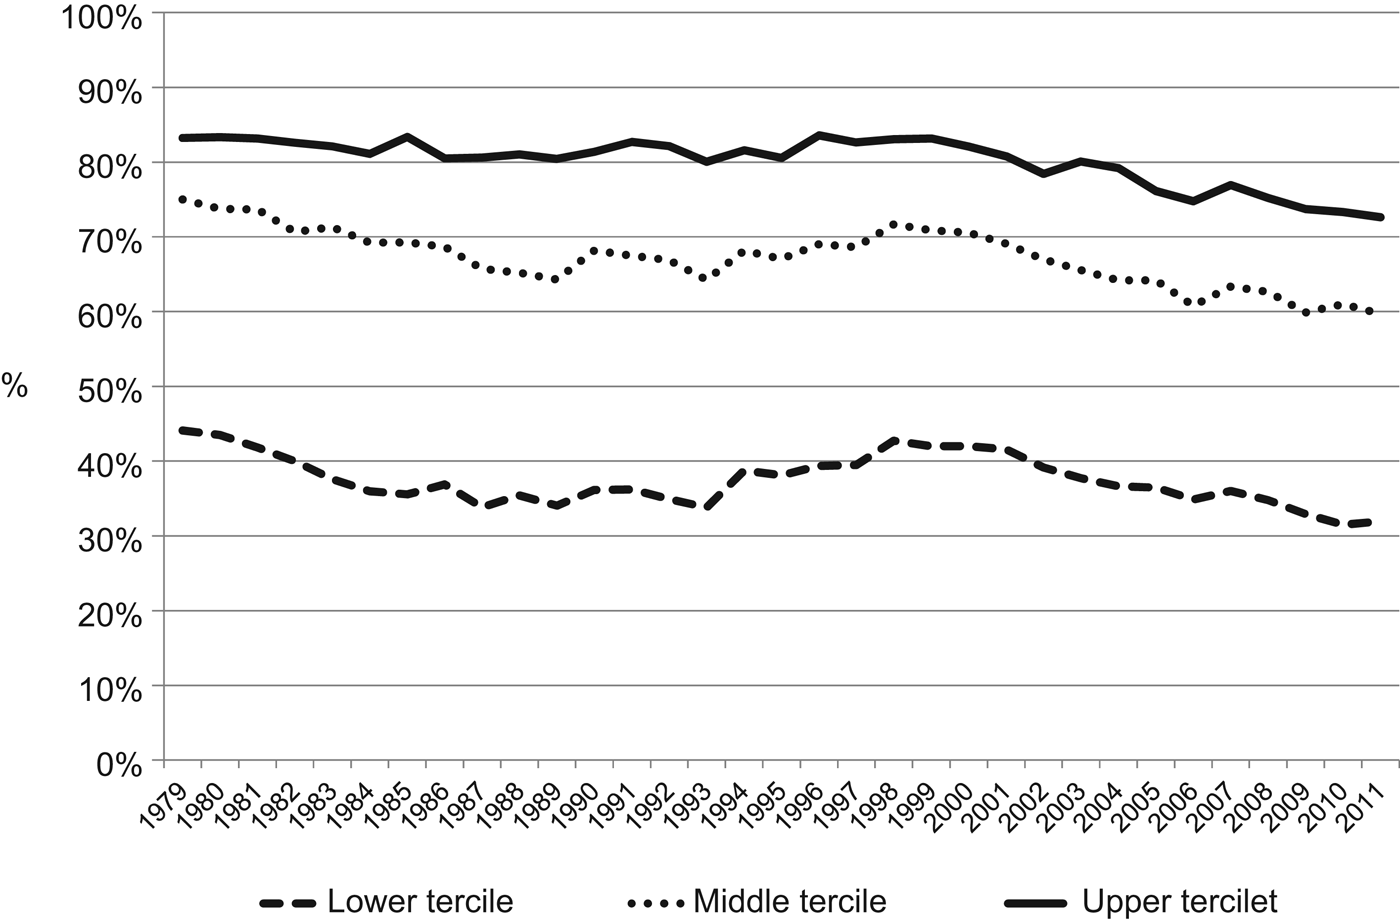
Pension participation is the result of two events: (1) access to a retirement plan through an employer, and (2) the individual's enrollment in the plan. Using data from the March Supplement of the Current Population Survey (CPS), Figures 1–3 document the trends in pension access and participation, drawing comparisons among income groups. Figure 1 shows the share of individuals working for an employer that sponsors a plan over the past 3 decades, that is what we denote as ‘plan sponsorship’. The prevalence of plan sponsorship clearly differs by earnings group. Less than one-third of individuals in the bottom third of earnings, work for an employer that sponsors a plan, compared with close to 70% for the highest earnings group.Footnote 5 Except for the past decade and despite the shift from DB to DC plans, pension sponsorship has remained relatively stable and it has been evolving similarly for the three earnings groups.
Pension Sponsorship (or Percent of Employees Who Work at an Employer Who Sponsors a Pension Plan), all Private Sector Male Workers Ages 25–64, by Earnings Tercile, 1979–2011.

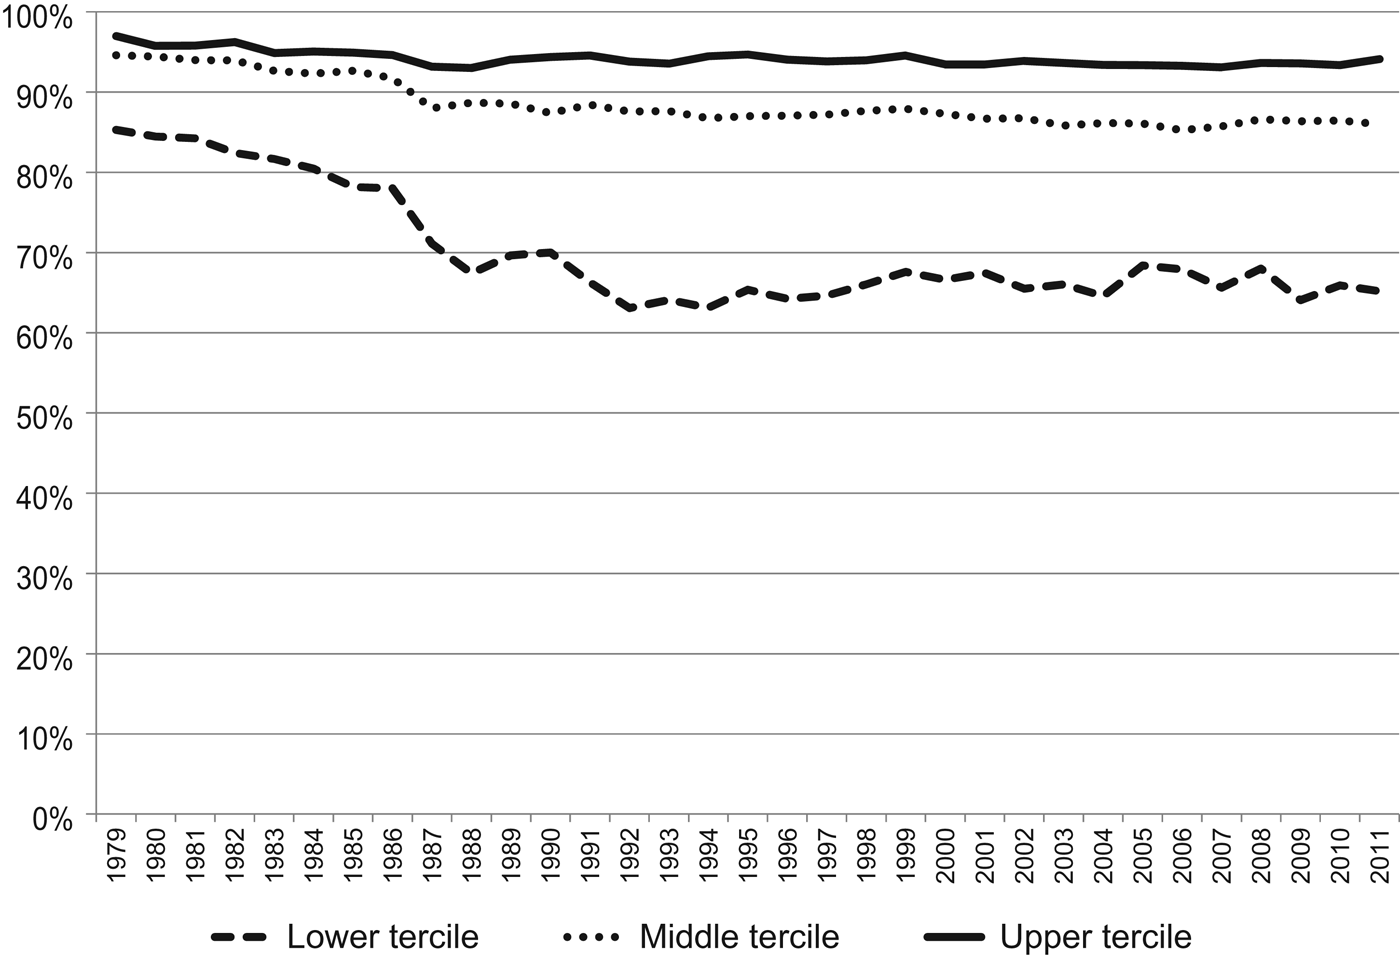
In contrast, the participation rates for workers whose employers provide a plan have shown considerable divergence among earnings groups over time (see Figure 2). While workers in the top third have had a nearly constant participation rate over the past 30 years, the rate for the middle third declined considerably – from 95% to 86% – and for the lowest third fell sharply – from 85% to 65%. Although the CPS does not ask about the type of pension plan an individual has, these declines in participation have occurred as pensions have shifted from mandatory (DB) to voluntary (DC) plans.
Pension Participation Rate for Private Sector Male Workers Ages 25–64 at Employers that Sponsor a Pension Plan, by Earnings Tercile, 1979–2011.
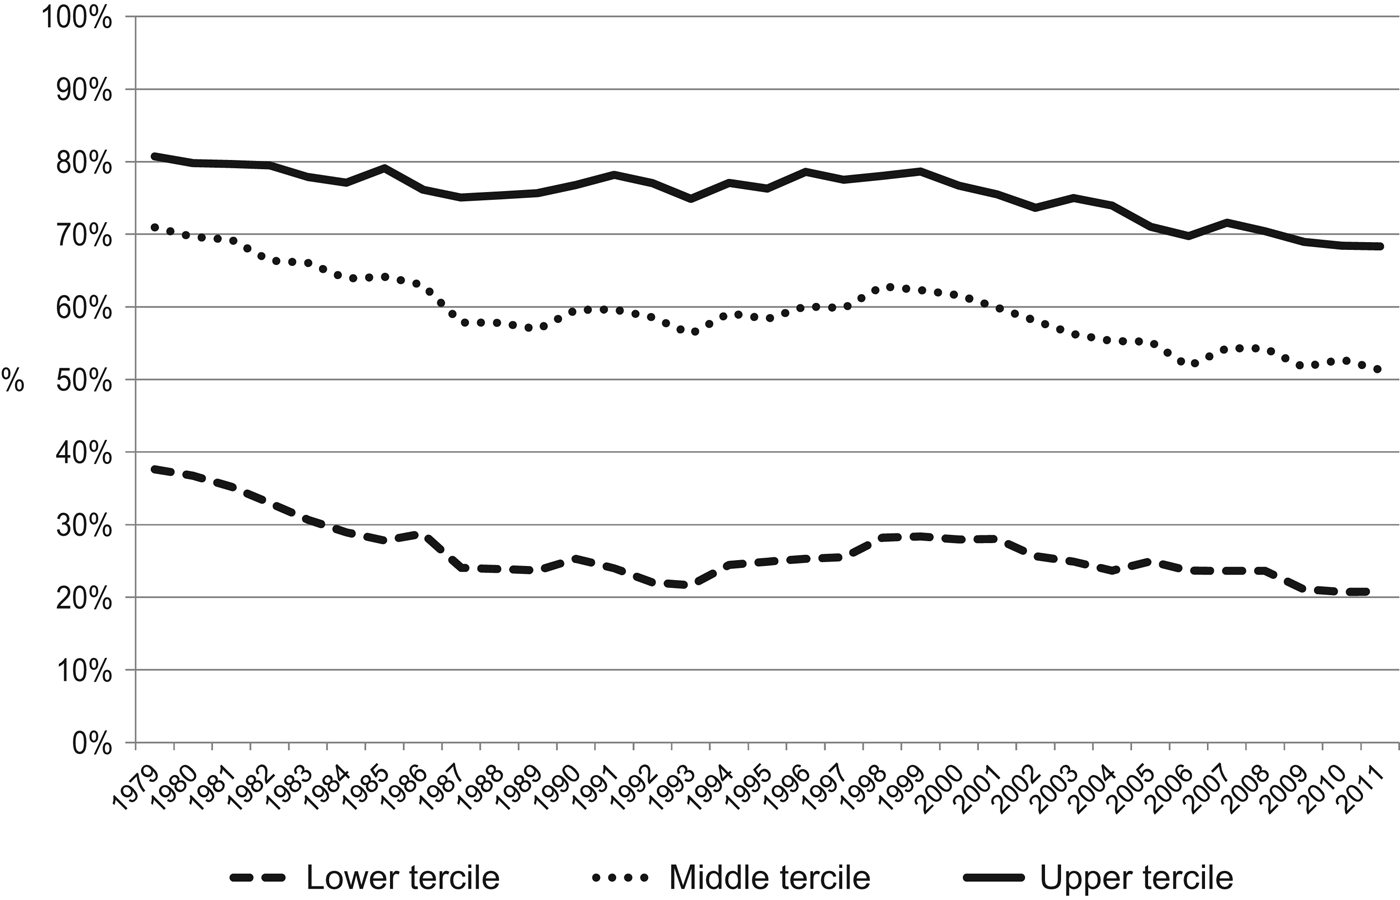
The data on pension access (Figure 1) and participation (Figure 2) together determine the overall participation rate, as shown in Figure 3. The biggest drops in overall participation occurred between middle and low earners, where the rate fell by 28% and 45% (or 20 and 17 percentage points), respectively. These declines drive policy makers’ interest in expanding pension coverage. However, decreasing participation rates among low earners at sponsoring employers seems to be the bigger driver of the group's overall decline in participation rather than any dramatic change in its access to pensions. Still, the fact that low-income workers participate in offered plans a majority of the time leaves policy makers hopeful that an expansion of pension coverage would result in a large increase in pension participation.
Pension Participation Rate for all Private Sector Male Workers Ages 25–64, by Earnings Tercile, 1979–2011.
However, it is unclear whether workers not currently offered pensions would participate at this high of a rate. To the extent that workers not offered plans differ from those offered plans, either observably or unobservably, the participation rate may be lower amongst workers covered by the new 401(k)-type plans. Thus, when making out-of-sample predictions, these characteristics must be controlled for. Because the CPS does not provide the necessary set of socio-demographic characteristics or pension information needed for a more rigorous analysis of the determinants of participation in 401(k) plans, we turn to the Survey of Income and Program Participation (SIPP), which is a national household survey overseen by the US Census Bureau.
We use data from the 2001 panel of the SIPP, in which workers were asked a topical module entitled ‘Retirement Expectations and Pension Plan Coverage.’ This topical module was conducted in 2004 and posed a series of questions on whether or not workers’ present employer provided a pension, whether or not the individual participated in that pension, the type of pension the individual was offered, and whether the employer provides a matching contribution.Footnote 6 This information, combined with the SIPP's core information on individuals’ demographic characteristics and employer attributes make the SIPP a good data set for estimating the relationships we have in mind.
The SIPP asks individuals if their employer sponsors a pension plan and if they participate in it. For workers who participated in their plan, individuals who claimed their benefit was based on earnings or years on the job are classified as having been offered a DB plan, as their main plan, while workers who claimed they had an individual account plan are classified as being offered a DC plan. Besides asking about their main plan, the SIPP includes an additional question about the availability and participation in a tax-deferred plan, similar to a 401(k), the answers to which we also take into account in determining the overall pension availability at the job.
Aside from pension plans, the core data of the SIPP provides information on individual and employer characteristics that are likely to be associated with pension offers and participation. This information includes an individual's age, race, education, marital status, whether he has children, tenure at the firm and state of residence. The data also include individuals’ income from work and net worth. On the employer side, the size of the worker's employer, and the industry of employment were also obtained from the SIPP. Tables 1–5 present descriptive statistics of the workers in our sample. These descriptive statistics suggest workers sort into pensioned jobs, in observable ways for certain, and perhaps in ways that are unobservable.
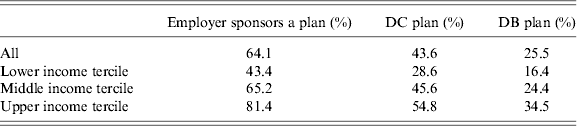
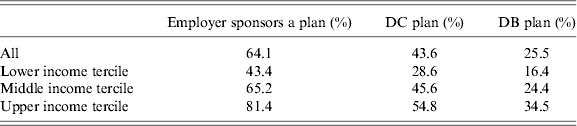
Table 1 examines pension coverage by type of plan across income groups. Overall 64.1% of the workers in our sample work for an employer who sponsors a pension plan: 43.6% are at a firm that has a DC plan, and 25.5 are at a firm with a DB plan.Footnote 7 Overall pension coverage increases by income terciles – 43.4% for the bottom income group compared with 81.4% for the top one. In addition, both DC and DB coverage increase with income: 28.6% of those in the bottom income tercile have access to a DC plan and 16.4 have DB coverage, compared with those at the top where 54.8% have DC coverage and 34.5% have a DB plan.
Percent of Workers with Pension Coverage by Type of Plan and by Income1
1 Some employers sponsor both DB and DC plans.
Source: Authors’ calculations, based on data from the 2001 panel of the SIPP.
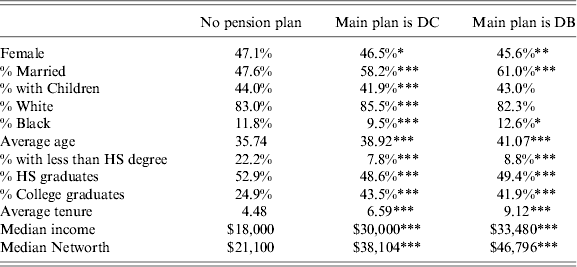
Table 2 shows differences in observable characteristics of those who are currently at firms that sponsor pensions compared to those who are not. The descriptive statistics show that workers at pensioned jobs are significantly less likely to be female, more likely to be married, are older and have longer tenure at the job. Those at pensioned jobs are also much more likely to have a college degree. These observable differences suggest workers may sort into pensioned jobs, but are also consistent with the notion that ‘better’ jobs that hire more experienced or educated workers are also more likely to offer pensions. If these observable differences were the only source of the selection, we would expect the differences to dissipate once we control for income.
Characteristics of Workers by Pension Plan Sponsorship
Source: Authors' calculations, based on data from the 2001 panel of the SIPP.
Notes: Significance levels refer to conducted tests for difference in means or medians between the ‘no pension plan’ category and the DC and DB categories, respectively.
*** Significant at the 1% level.
** Significant at the 5% level.
* Significant at the 10% level.
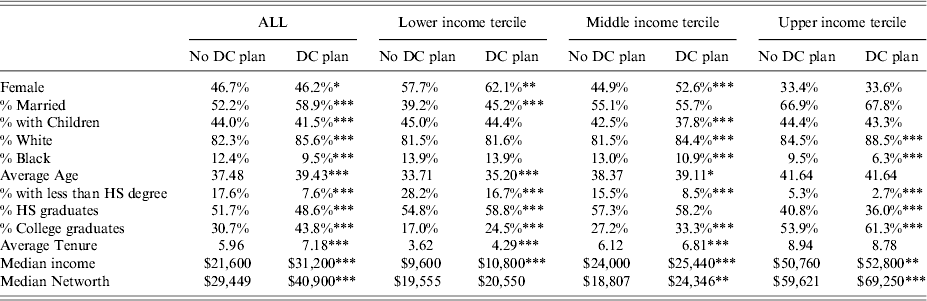
Table 3 compares the characteristics of workers at firms with DC plans and those without DC plans, while also controlling for income. We continue to observe significant differences. Even within each income tercile, workers at jobs with DC plans are more likely to be married, less likely to not have a high school degree, significantly more likely to have a college degree, and have higher median income and earnings than those without DC plans. These results suggest that pension coverage is not random in the population, and that there might be some unobservable factors in addition to observable factors that are behind the sorting mechanism of workers into firms with different pension coverage.
Characteristics of Workers by DC Plan Sponsorship and by Income
Source: Authors’ calculations, based on data from the 2001 panel of the SIPP.
Notes: Significance levels refer to conducted tests for difference in means or medians between each two categories.
*** Significant at the 1% level.
** Significant at the 5% level.
* Significant at the 10% level.
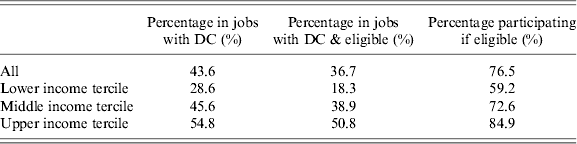
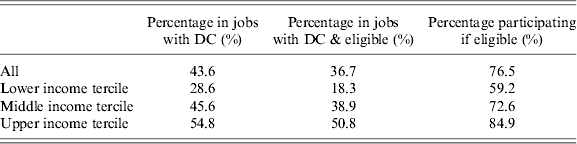
As mentioned earlier, pension participation is the result of pension sponsorship, eligibility and the decision to participate. Since the goal of the empirical specification in the next section is to uncover the determinants of voluntary participation, the focus is on individuals who are both in jobs with employer plans and are eligible to participate. As Table 4 shows, 43.6% of workers in our sample are with an employer that sponsors a DC-type plan, however only 36.7% are eligible to participate. Both eligibility and voluntary participation correlate highly with income. Eligibility is particularly low among low-income workers – 18.3% of those in the bottom income tercile are eligible to take part in a DC plan, compared with 50.8% of those at the top third of the income distribution. Among workers who are eligible, 76.5% chose to participate – 59.2% for those in the lowest income tercile, compared with 84.9% for those in the highest.
401(k) Sponsorship, Participation and Contribution Rates by Income
Source: Authors’ calculations, based on data from the 2001 panel of the SIPP.
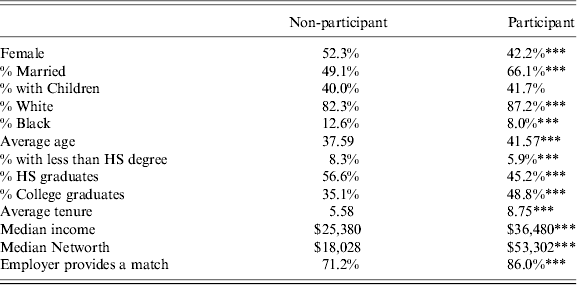
Table 5 provides a descriptive analysis of some of the main determinants of voluntary plan participation within the sample of workers with access (those who work for an employer who sponsors a plan and are eligible to participate) and motivates the observable variables to be included in our analysis. The statistics are consistent with prior research and show that participants are more likely to be male and to be married, are older, and have been with the employer on average 4 years longer. Those who participate are also more educated and have significantly higher median income and net worth. Finally, the existence of an employer match is an important determinant of plan participation – overall participation rate is 86% in firms that match employees’ contributions, and 71.2 in those that do not.Footnote 8
Characteristics of Workers by DC Plan Participation1
1 Among individuals in jobs with DC plan sponsorship who are eligible.
Source: Authors’ calculations, based on data from the 2001 panel of the SIPP.
Notes: Significance levels refer to conducted tests for difference in means or medians between the two categories.
1 Significant at the 1% level.
**Significant at the 5% level.
*Significant at the 10% level.
Overall, the descriptive statistics show significant differences between the socio-economic characteristics of workers currently at jobs with pension plans and those without, and further between participants and non-participants. Some are not surprising, as the standard life-cycle model would suggest some factors such as age, education, marital status, current versus permanent income to be important determinants of current savings rate, and thus plan participation. However, the differences remain wide even within income groups and suggest that there might be other, potentially unobservable factors at play, which affect both selection into a pension-type job and voluntary participation.
Put differently, workers who are currently at DC-sponsoring jobs may be different from those who are not, due to unobservable differences in tastes or constraints, which make them more or less likely to participate in an offered DC plan. As an example, consider low-income workers who are searching for a job and that would like to have access to a DC-type pension plan. These workers may face considerable costs to finding the right job, since a few employers are likely to offer these workers a DC plan (as is shown in Table 1). Thus, low-income workers who are likely to participate are also more likely to make their way to an employer with a plan; the others will end up at employers who won't. In this case, basing the prediction that low-income workers will participate in an offered DC plan on workers who are currently in jobs with DC plans will be erroneous; those workers are more likely to participate than the rest.
If workers select into DC-pensioned jobs based on a high propensity to participate, estimating the effects of potential participation determinants only on the selected sample would give biased and inconsistent results for the population coefficients. Moreover, if the self-selection and the decision to participate are positively correlated, policies aimed at providing voluntary savings plans to non-pensioned individuals would likely have lower participation rates than are seen in the pensioned population. Employers offering either an ‘Auto-IRA’ or a DC-type plan should expect lower participation than might be indicated when examining the current covered population.Footnote 9 The next two sections describe our empirical strategy and results of estimating the determinants of pension plan coverage and voluntary participation.
3 Empirical strategy
In our empirical approach, we start with a standard probit specification to model the decision to participate in an offered 401(k) plan, estimated on the sample of individuals who are working for an employer sponsoring a 401(k) plan and are eligible to participate (see equation (1)). This provides us with results easily comparable with those in previous literature.
3.1 Probit
 $$y^* = x'\beta + \varepsilon, {\rm} \quad {\rm where}\;\varepsilon \sim N(0,\sigma ^2 )$$
 $$y = \left\{ \matrix{1\;{\rm if}\;y^* \gt 0 \cr 0\;{\rm if}\;y^* \leqslant 0 } \right.$$
or
 $$p = {\rm Pr}[{\rm Participate} = 1|x{\rm,} \;{\rm Offered\ DC} = 1] = \Phi (x'\beta )$$
where y * is the latent propensity to participate and x={demographics, tenure at current job, annual income, wealth, etc.}.
In the specifications that follow we allow the unobservable that affects the probability of being offered a 401(k) plan to be correlated with the unobservable that affects the worker's decision to choose participation. The empirical setup that achieves this in the probit specification is a bivariate probit model with sample selection as described in Green (Reference Green, Milles and Patterson2008). At its core this is a Heckman-type model that corrects for the sample selection bias in the main equation of interest – the decision to participate. As in Heckman's seminal paperFootnote 10 the selection mechanism has a dichotomous outcome (offered or not offered a 401(k) plan), however unlike his model, our structural equation also has a dichotomous outcome (participate or not). Previous literature has shown that in these situations, the nonlinearity of the probit model poses serious difficulties for the standard two-step Heckman correction procedure and can even exacerbate the bias, making likelihood techniques the preferred choice of estimation (Freedman and Sekhon, Reference Freedman and Sekhon2010). Thus, instead of the two-step procedure, we use the bivariate probit formulation, first presented by Van de Ven and Van Pragg (Reference Van de Ven and Van Pragg1981). Applied to our question of interest it has the following basic set up, which has two equations: (1) an equation that models whether or not a person is offered and eligible for a DC pension, denoted y 1* and (2) an equation that models whether or not a person offered a DC pension chooses to participate, denoted y 2*.
3.2 Bivariate probit with sample selection
 $$y_1^* = x_1 {\rm \prime} {\rm} \beta _1 + \varepsilon _1, \quad {\rm where}\;\varepsilon _1 \sim N(0,\sigma ^2 _1 )$$
 $$y_2^* = x_2 {\rm \prime} \beta _2 + \varepsilon _2, \quad {\rm where}\;\varepsilon _2 \sim N(0,\sigma ^2 _2 )$$
where y 1* and y 2* are two latent variables observed according to the following rule:
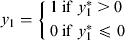 $$y_1 = \left\{ \matrix{1\;{\rm if}\;y_1^* \gt 0 \cr 0\;{\rm if}\;y_1^* \leqslant 0 } \right.$$
 $$y_2 = \left\{ \matrix{1\;{\rm if}\;y_2^* \gt 0 \; {\rm and}\ y_1^* \gt 0 \cr 0\;{\rm if}\;y_2^* \leqslant 0 \; {\rm and}\ y_1^* \gt 0 \cr - \quad {\rm if} \; y_1^* \leqslant 0 } \right.$$
Thus we estimate jointly the probability of being offered a 401(k) pension plan (y 1=1) and the decision to participate in an offered 401(k) plan (y 2=1). In addition, x 1 and x 2 are vectors of exogenous variables, the error terms are assumed to be independently and identically distributed as bivariate normal, and ρ is the correlation parameter. The correlation parameter captures the extent to which people select into DC jobs; if it is positive then the people we observe in DC-covered jobs will be more likely to participate than similar individuals who are not in DC-covered jobs.
 $$\left[ {\matrix{ {\varepsilon _1} \cr {\varepsilon _2} \cr}} \right] \sim N\left[ {\left[ {\matrix{ 0 \cr 0 \cr}} \right],} \right]\left[ {\left[ {\matrix{ 1 & {\sigma _{12}} \cr {\sigma _{12}} & {\sigma _2^2} \cr}} \right]} \right] \; {\rm or} \; \left[ {\matrix{ {\varepsilon _1} \cr {\varepsilon _2} \cr}} \right] \sim N\left[ {\left[ {\matrix{ 0 \cr 0 \cr}} \right],\left[ {\matrix{ 1 & \rho \cr \rho & 1 \cr}} \right]} \right]$$
Alternatively we can write the model in the following way where equation (5) models the probability of being offered a DC plan, and equation (6) models the likelihood of participating if offered. Since the correlation coefficient ρ denotes the extent to which the two errors covary, when ρ≠0, standard probit techniques applied to equation (6) yield biased results. To achieve a consistent and asymptotically efficient estimate of β 2 we need to account for the sample selection and estimate the two equations jointly. The parameter vector β=(β 1, β 2, ρ) can be recovered via by maximum likelihood.
 $$p_1 = \Pr [{\rm Offered} \; {\rm DC} = 1] =} \Phi {\rm (}x_1 ^\prime \beta _1 )$$
 $$p_2 = {\rm Pr}[{\rm Participate} = 1|{\rm Offered} \; {\rm DC} = 1] = \Phi (x_2 ^\prime \beta _2 )$$
3.3 Identification
Although most selection type models are technically identified simply through functional form, it has become an established practice in the literature to include at least one exclusion regressor in the selection equation as a way to improve identification and lead to more stable and reliable estimates. This exclusionary regressor should affect the probability an individual is offered a DC pension (selected) without influencing pension participation (the outcome).Footnote 11 For this purpose, we have chosen several variables that vary by state of residence and reflect the availability of DC plans. These variables are the ratio of DC plans to all pension plans, the proportion of firms with more than 100 workers, and the proportion of firms with 25–99 workers in a worker's state of residence. Our assumption is that these variables capture variation in the availability of 401(k) plans coming from the employer side and are exogenous factors in the workers’ saving decisions.
Although it is impossible to test the validity of the exclusion restrictions, simple OLS regressions results suggest that these variables are strongly correlated with the probability a person is offered a DC plan and are not significant determinants of the decision to participate. For these to be valid exclusion restrictions, the underlying assumption is that people do not move to a state because they are more likely to participate in a DC plan once offered. This would be the case if, for example, individuals moved to a state because the culture was one of thrift and they identified with that culture, or if state-wide preferences toward savings and tax-deferred forms of compensation are simultaneously leading to more firms offering plans and more workers choosing to participate. This is indeed a possibility, which would severely jeopardize the validity of our instruments, and which unfortunately we are not able to fully control for without having information on individuals’ preferences for saving. Instead, to mitigate the confounding effects of such unobservable factors, we include controls for political attitudes and net migration flows by state. Specifically, we include year 2004 state-wide political attitudes in the form of percent leaning democrat, and the democrat-republican percentage gap, as well as a variable that captures net state migration between 2004 and 2005.Footnote 12
4 Results
4.1 Determinants of participation
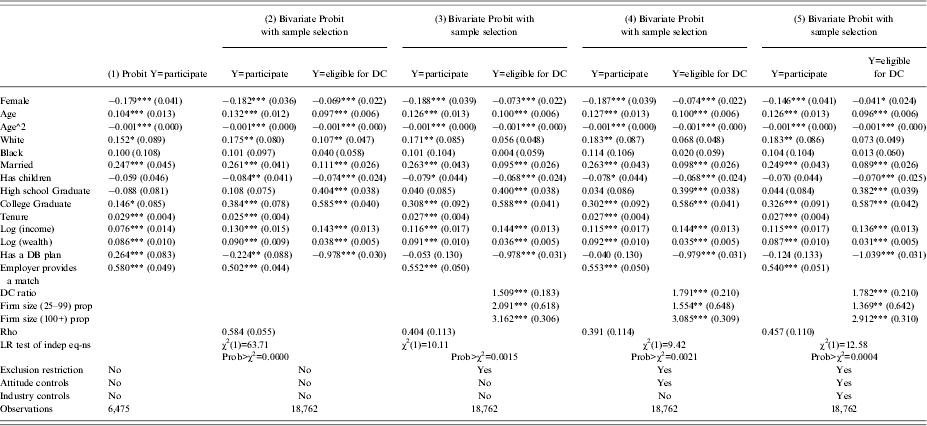
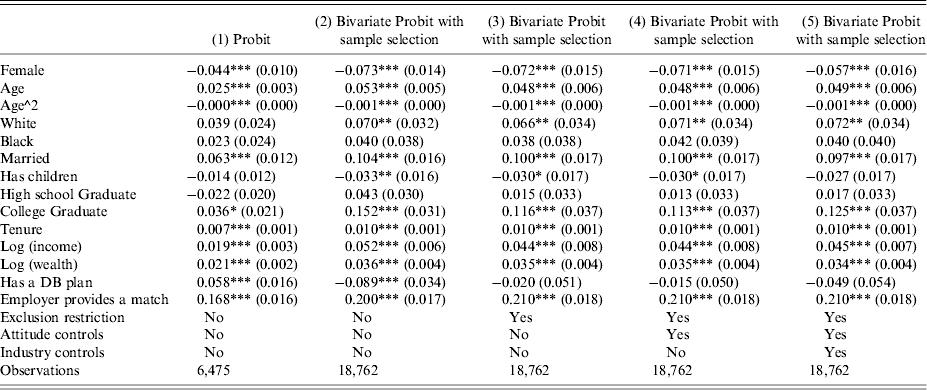
Table 6a compares estimates from a standard probit model with one which in addition controls for selection. Specifications (2) to (5) differ based on the availability of additional controls and exclusion restrictions. Table 6b presents the estimated marginal effects of the same specifications.
401(k) Participation Models
Source: Authors’ calculations, based on data from the 2001 panel of the SIPP.
Notes: Standard errors in brackets; *** Significant at the 1% level; ** Significant at the 5% level; * Significant at the 10% level.
401(k) Participation Models: Marginal Effects
Source: Authors’ calculations, based on data from the 2001 panel of the SIPP.
Notes: Marginal effects calculated at means using discrete changes for the dummy variables. Standard errors in brackets.
*** Significant at the 1% level.
** Significant at the 5% level.
* Significant at the 10% level.
The results of the probit and the probit with selection are largely consistent with the literature with respect to sign and significance. Similarly to previous studies,Footnote 13 we find that individuals who are married, well educated, have high tenure at their firm, and work at firms with an employer match are all more likely to participate than others. Blacks and younger individuals are less likely to participate, and so are women as compared with men. Also consistent with expectations, individuals with high wealth and high income are more likely to participate in an offered DC plan than other individuals. Interestingly, having a DB plan is positively correlated with participation in a DC plan in the probit specification, but its coefficient turns negative and its significance disappears in the specifications with selection. Having a DB plan, however is strongly negatively associated with being offered a DC plan in the first place, likely driven by the fact that employers who already sponsor a DB plan are less likely also sponsor a DC plan. The positive coefficient of having a DB plan in the probit specification could be the result of self-selection of more saving-prone individuals into jobs with pension plans.
The estimated correlation coefficient is positive and strongly significant in specifications (2) to (5) and so are the coefficients on the exclusion restrictions. These results support the hypothesis of a possible self-selection effect and suggest that indeed individuals in DC jobs are more likely to participate than similar individuals in jobs not offering these pension plans, based on factors unobservable to the estimation. Table 6a also shows the importance of the instruments for improving identification. Not using any additional factors to identify the selection separately from the main equation, results in an overestimated correlation coefficient (see model 2) and somewhat overestimated marginal effects for most variables (Table 6b, model 2).
Our preferred specification is model (4) as it results in the most conservative estimate of correlation between the two equations; however, the estimated coefficients on the main variables of interest have high significance and intuitive direction. The estimated marginal effects in Table 6bb show that women have 0.071 lower probability of participation in an offered 401(k) plan, while being married raises the probability by 0.10. Having a college degree is associated with a 0.113 higher likelihood of participation, having children however decreases it by 0.03. The existence of an employer match is also an important determinant raising the probability of participation by 0.21. Both income and wealth are also significant determinants with marginal effect of log(income) and log(wealth) of 0.044 and 0.035, respectively. Overall the results of models 3) to 5) are not surprising – previous literature has already documented similar (in terms of direction and significance) relationships between the independent variables and 401(k) plan participation. What is interesting is the change in the magnitudes of the effects comparing this specification with a more standard probit on the selected sample specification (model 1). Not allowing for the correlation between the errors terms in the DC offer and participation equations results in underestimation of the population effects of many of the important participation determinants. From a policy point a view if the goal is to predict the effect of policies targeted at the whole population, using estimates based on specifications (3) to (5) might result in better population predictions.
4.2 Pension participation gap with universal coverage
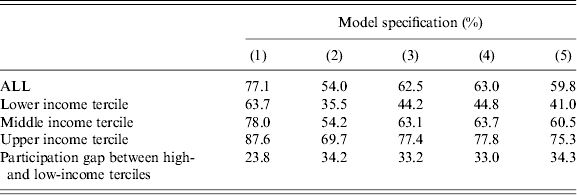
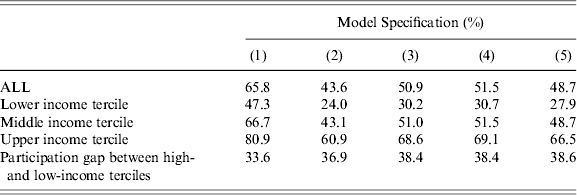
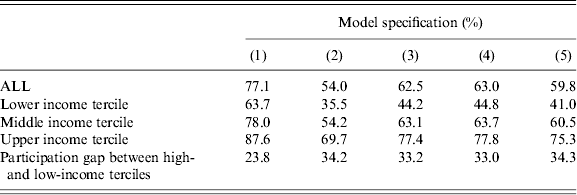
Tables 7a and 7b illustrate this point by comparing predicted participation rates by income groups using the results from Table 6a. Given the dichotomy of the employer match provision, instead of assuming an employer match structure that will be available to currently uncovered individuals, we present two scenarios. Table 7a assumes that all new DC plans (i.e., plans offered to workers who previously did not have DC pension access) include an employer match at the same matching rate as the average firm in our sample, whereas Table 7b assumes that none of the new DC plans provide an employer match. Both tables show a considerable participation gap that remains between low- and high-income individuals. To the extent that universal coverage is achieved through the expansion of similar in nature to the existing tax-deferred voluntary participation plans, policy makers should expect a remaining participation gap between low and high earners ranging between 33% and 38%, and a lower on average coverage rate than the one observed in current pension-sponsoring jobs.
Predicted Probabilities of Participation in 401(k) if All Newly Offered 401(k) Plans Provide an Employer Match, by Model Specification and Income
Source: Authors’ calculations, based on data from the 2001 panel of the SIPP.
Predicted Probabilities of Participation in 401(k) if No Newly Offered 401(k) Plans Provide an Employer Match, by Model Specification and Income
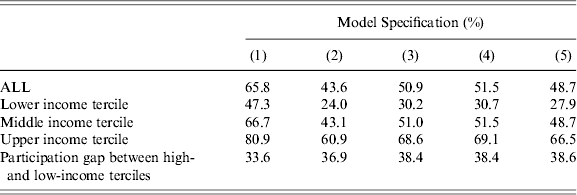
Source: Authors' calculations, based on data from the 2001 panel of the SIPP.
The benefit of controlling for the unobserved characteristics of individuals that select into pensioned jobs can be seen by examining Table 7b. For the lowest income tercile, a simple probit, which exploits only observable features of the data, would predict a DC participation rate of 47% if all newly covered individuals were offered a DC pension plan without an employer match. Once unobservable characteristics are taken into account the predicted participation rate drops to 31%.Footnote 14 For all workers, a simple probit would predict that overall DC participation would expand from 28%Footnote 15 to 66% when employers offering a new DC plan do not provide a match, whereas our preferred specification predicts 52% of workers would be participating in a DC plan if new plans do not offer a match. This analysis illustrates that policy makers should be wary of basing predictions regarding the success of expanding pension coverage on those currently covered.
Missing from our analysis is the effect of automatic enrollment – an increasing in popularity feature of DC plans. In contrast to the standard opt-out regime, under which individuals have to take active steps to participate in the plan, under automatic enrollment eligible workers are enrolled by default unless they actively opt-out of the plan. The Pension Protection Act of 2006 included a number of provisions that encouraged the adoption of automatic enrollment and it has been increasing in popularity ever since (Purcell, Reference Purcell2007; PSCA, 2012). Previous literature has documented that firms that switched from opt-in to opt-out regimes experienced significant increase in their employees’ participation rates, at least in the short term, sometimes even in the absence of an employer match (Madrian and Shea, Reference Madrian and Shea2001; Choi et al., Reference Choi, Laibson, Madrian, Metrick and Wise2004; Beshears et al., Reference Beshears, Choi, Laibson, Madrian and Wise2010).
Unfortunately data limitations do not allow us to control for the effect of this provision. To the extent that the effect of automatic enrollment on participation might differ based on workers’ observed and unobserved characteristics, the results presented above should be interpreted with caution. On the other hand, the current estimates of the effect of the automatic enrollment provision are all based on firm-level studies that follow workers’ actions for a relatively short period of time and are not yet able to capture the long-term population-wide effects on participation. To the extent that low-income workers, as well as those currently uncovered, are more likely to opt-out (e.g., due to liquidity constraints or the unobservable self-selection factors that we found evidence for), and as a result are less influenced by these provisions, the estimates of the remaining participation gap (Tables 7a and 7b) will likely not be too far off from the true population effects even if automatic enrollment becomes the norm in the future. Moreover, recent papers point to the possibility of employers responding to the increased costs of automatic enrollment by setting relatively low default contribution rates or lowering the employer match or employer contribution rates in their plans, which in turn might decrease workers’ benefit of participating (Soto and Butrica, Reference Soto and Butrica2009; Butrica and Karamcheva, Reference Butrica and Karamcheva2012). The extent to which the effects of instituting automatic enrollment on the one hand, and employers’ cost-reducing actions on the other hand, might have offsetting effects on participation, is an interesting avenue for future research.
5 Conclusion
Over the past 3 decades, pension participation in the USA amongst low-income individuals has dropped in half to just above 20%. Policy makers and researchers have sought to remedy this decline, and given that private pension plans currently cover only half of the workforce, some of the suggested proposals have called for extending the availability of tax-deferred private saving vehicles, similar to 401(k)s or IRAs to all workers, thus achieving almost universal coverage. Given the voluntary nature of participation in these plans, however, having access to a plan, often does not translate into actually participating and contributing to the plan. Understanding what determines participation is vital in assessing the potential effects of policy proposals.
Using data on workers currently at employers who sponsor plans, previous literature has consistently identified certain factors such as age, education, marital status, tenure, income, wealth and the availability of an employer match, as important determinants of participation. Using data from the 2001 panel of the SIPP, this paper confirms those findings, but also builds on previous results by controlling for an important but often omitted factor that affects individuals' choice of participation. Observations of significant differences in characteristics between workers at pension jobs and those without, as well as between participants and non-participants hint at potential unobservable factors that might be behind the self-selection of workers with higher propensity to save into jobs that offer tax-deferred savings plans. The implication of this selection is that individuals who are currently at jobs with no pension plans may be especially unlikely to contribute, when given the option. Our estimates suggest that this selection effect is non-trivial. Whereas, extending tax deferred plan coverage will likely lead to increased participation on average, our findings point to a remaining participation gap between low- and high-income workers between 33 and 38 percentage points, which might be higher than what policy makers hope for and expect based on the participation patterns of workers currently offered these kinds of pensions.