




1. Introduction
The flow around bluff bodies with sharp corners is encountered frequently in practical applications, especially in the field of vortex-induced oscillations (Williamson & Govardhan Reference Williamson and Govardhan2008), and is also of importance for fundamental research. The flow is complex, with massive separations at the corners producing shear layers that may reattach, several recirculating regions that may foster different instabilities, and a large downstream wake.
The rectangular cylinder is the prototype of such bodies. Varying its aspect ratio  ${A{\kern-4pt}R}$, i.e. the ratio between the length
 $L$ and the cross-stream dimension
 $D$, a set of blunt bodies is obtained, ranging from the flat plate perpendicular to the incoming flow (
 ${A{\kern-4pt}R} = 0$), to the square cylinder (
 ${A{\kern-4pt}R} =1$) and to the flat plate parallel to the flow (
 ${A{\kern-4pt}R} \rightarrow \infty$). Already at moderate Reynolds numbers, the flow dynamics depends on the aspect ratio. For small
 ${A{\kern-4pt}R}$, i.e.
 ${A{\kern-4pt}R} \le 1$, two shear layers separate from the leading edge (LE) corners and roll up to create the classic von Kármán vortex street. In contrast, for intermediate
 ${A{\kern-4pt}R}$, i.e.
 $1 < {A{\kern-4pt}R} \le 3$, the shear layers separating from the LE reattach intermittently over the lateral sides of the cylinder. For large
 ${A{\kern-4pt}R}$, the shear layers reattach permanently and the flow eventually separates at the trailing edge (TE) corners, leading to vortex shedding from both LE and TE. When the Reynolds number
 $Re$ (defined with the unperturbed velocity
 $U_\infty$ and the thickness
 $D$) is large enough, say
 $Re \ge 300$, the two sheddings lock to the same frequency, leading to an almost stepwise dependence of the Strouhal number
 $St$ – i.e. the shedding frequency made dimensionless with
 $U_\infty$ and
 $L$ – on the aspect ratio (Okajima Reference Okajima1982; Nakamura, Ohya & Tsuruta Reference Nakamura, Ohya and Tsuruta1991; Ozono et al. Reference Ozono, Ohya, Nakamura and Nakayama1992; Mills et al. Reference Mills, Sheridan, Hourigan and Welsh1995). The number
 $n$ of LE vortices present simultaneously over the cylinder side increases in a quantised manner with
 ${A{\kern-4pt}R}$, being for example
 $n=1$ for
 ${A{\kern-4pt}R} =4$,
 $n=2$ for
 ${A{\kern-4pt}R} =7$, and
 $n=3$ for
 ${A{\kern-4pt}R} =11$. In a previous work (Chiarini, Quadrio & Auteri Reference Chiarini, Quadrio and Auteri2022b), we have found that the flow assumes different configurations depending on the prevalence of either shedding. When the overall frequency is selected by the LE vortices,
 $St \approx nU_c$, where
 $U_c \approx 0.55 U_\infty$ is the mean convection velocity of the LE vortices (Mills, Sheridan & Hourigan Reference Mills, Sheridan and Hourigan2002; Tan, Thompson & Hourigan Reference Tan, Thompson and Hourigan2004), as the shedding frequency locks to the passing frequency of the LE vortices over the TE. In contrast, when the TE shedding dominates, the flow matches the shedding frequency of elongated bodies with rounded LE that do not produce shedding. When allowed by the phasing of the LE vortices, the flow preferentially assumes the latter configuration.
The primary and secondary instability of the flow past a square cylinder has been studied by several scholars. The onset of the primary, two-dimensional (2-D) instability resembles closely that of the circular cylinder, where the flow undergoes a Hopf bifurcation, albeit at a slightly lower Reynolds number (Sohankar, Norberg & Davidson Reference Sohankar, Norberg and Davidson1999; Saha, Muralidhar & Biswas Reference Saha, Muralidhar and Biswas2000; Jiang & Cheng Reference Jiang and Cheng2018). A Floquet analysis was used by Robichaux, Balachandar & Vanka (Reference Robichaux, Balachandar and Vanka1999), Blackburn & Lopez (Reference Blackburn and Lopez2003) and Blackburn & Sheard (Reference Blackburn and Sheard2010) to study the secondary, three-dimensional (3-D) instability; again, it was found to be quite similar to the circular cylinder case, with unstable synchronous A and B Floquet modes. At larger  $Re$, a further unstable quasi-periodic mode, called QP, was identified for circular and square cylinders (Blackburn & Lopez Reference Blackburn and Lopez2003; Blackburn, Marques & Lopez Reference Blackburn, Marques and Lopez2005). Modes A and B were also observed via a direct numerical simulation (DNS) by Jiang, Cheng & An (Reference Jiang, Cheng and An2018), who remarked that the instability of mode A is hysteretic. Sheard, Fitzgerald & Ryan (Reference Sheard, Fitzgerald and Ryan2009) and Sheard (Reference Sheard2011) studied how the angle of incidence affects the unstable modes: mode A is the most unstable one at small and large incidences, while a subharmonic mode, called C, is the most unstable at intermediate angles. Park & Yang (Reference Park and Yang2016) studied how instabilities change when the sharp edges become rounded and the square shape approaches the circular one. For the 3-D instability, they found that rounding does not alter the sequence at which the three modes become unstable, yet their critical Reynolds number, i.e. the Reynolds number evaluated at their first onset, is affected because of changes of the periodic base flow.
The instabilities of the flow past rectangular cylinders with  ${A{\kern-4pt}R} \ne 1$ have received less attention, perhaps under the assumption that no substantial changes from the square cylinder are to be expected. However, studying the primary instability for
 $0.25 \le {A{\kern-4pt}R} \le 30$, Chiarini, Quadrio & Auteri (Reference Chiarini, Quadrio and Auteri2021) observed recently that already at low Reynolds numbers, some characteristics of the flow instabilities do change with the aspect ratio. They found that the primary instability is invariably the result of a Hopf bifurcation, but that the increase of
 ${A{\kern-4pt}R}$ consistently delays its first onset, with the critical Reynolds number going from
 $Re \approx 34$ for
 ${A{\kern-4pt}R} =0.25$ to
 $Re \approx 140$ for
 ${A{\kern-4pt}R} =30$. Moreover, the stabilising/destabilising effect of rounded LE and/or TE corners was shown to depend on
 ${A{\kern-4pt}R}$, being related to different modifications of the base flow with respect to the sharp-corner configuration. Choi & Yang (Reference Choi and Yang2014) studied the secondary instability of the flow past rectangular cylinders ranging from a flat plate normal to the flow (
 ${A{\kern-4pt}R} \rightarrow 0$) to the square cylinder (
 ${A{\kern-4pt}R} =1$): the decrease of
 ${A{\kern-4pt}R}$ was found to stabilise modes A, B and QP, while two other (synchronous and quasi-periodic) modes, called A2 and QP2, become unstable (see also Thompson et al. Reference Thompson, Hourigan, Ryan and Sheard2006). Chaurasia & Thompson (Reference Chaurasia and Thompson2011) and Huang et al. (Reference Huang, Zhou, Tang and Zhang2017) studied the flow past a semi-indefinite plate of finite thickness, i.e.
 ${A{\kern-4pt}R} \rightarrow \infty$. With a Floquet stability analysis, they found that the vortices arising from the Kelvin–Helmholtz instability of the LE shear layer become globally unstable to 3-D perturbations at
 $Re \approx 380$, and that the unstable mode is subharmonic. Ryan, Thompson & Hourigan (Reference Ryan, Thompson and Hourigan2005) observed that the onset of the 3-D instability for elongated cylinders depends on the aspect ratio even in the simplified case without LE shedding. They investigated the transition to 3-D flow for cylinders with elliptic LE and square TE using both Floquet analysis and 3-D DNS. They found mode A and two new modes as well, called B
 $^{\prime }$ and S
 $^{\prime }$ in analogy with the circular and square cylinder cases. They observed that for small
 ${A{\kern-4pt}R}$, i.e.
 ${A{\kern-4pt}R} \le 7.5$, the first mode that becomes unstable is mode A, while for larger
 ${A{\kern-4pt}R}$, the first unstable mode is B
 $^{\prime }$. For elongated rectangular cylinders with sharp LE corners, the scenario is likely to be complicated further, as vortex shedding occurs from both LE and TE. However, the 3-D instability of the flow past elongated rectangular cylinders has not yet been properly addressed. To the best of our knowledge, only Hourigan, Thompson & Tan (Reference Hourigan, Thompson and Tan2001) performed DNS for rectangular cylinders with
 ${A{\kern-4pt}R} =6,10,13$ at
 $Re=350\unicode{x2013}400$ to describe the structure of the 3-D flow in the laminar regime. For the two largest
 ${A{\kern-4pt}R}$, they observed hairpin-like structures arranged in a staggered manner on both sides of the cylinder, closely resembling those classified as pattern B in Sasaki & Kiya (Reference Sasaki and Kiya1991) for a flat plate parallel to the flow.
The rectangular cylinder with  ${A{\kern-4pt}R} =5$ defines the benchmark of the aerodynamics of a rectangular 5 : 1 cylinder or BARC (see https://www.aniv-iawe.org/barc-docs), which aims to characterise the flow and set the standards for simulations and experiments in the turbulent regime. At large Reynolds numbers, the small-scale velocity fluctuations associated with the turbulent motions coexist and interact with the large-scale motions due to the flow instabilities, giving rise to a self-sustaining cycle (Cimarelli, Leonforte & Angeli Reference Cimarelli, Leonforte and Angeli2018; Moore, Letchford & Amitay Reference Moore, Letchford and Amitay2019; Chiarini et al. Reference Chiarini, Gatti, Cimarelli and Quadrio2022a). Hence the study of the flow instabilities at low Reynolds numbers and the comprehension of their triggering mechanisms is crucial also to understand the complex and multiscale flow dynamics in the turbulent regime.
The present study addresses the 3-D instability of the flow past a rectangular cylinder with  ${A{\kern-4pt}R} =5$ via Floquet analysis and 3-D DNS. An unstable mode of almost subharmonic nature, undetected for other bluff bodies, will be characterised, and a physical interpretation of the triggering mechanism will be proposed. The paper is organised as follows. After this Introduction, brief descriptions of the mathematical formulation and the numerical methods are provided in § 2. Then the 2-D periodic base flow is detailed in § 3. The unstable mode resulting from both the Floquet analysis and the 3-D DNS is characterised in § 4. Section 5 describes the onset of a second 2-D instability of the 2-D base flow at larger
 $Re$. Finally, a concluding discussion is presented in § 6. The Appendix concludes the paper and addresses the dependence of the results on the domain size and grid resolution.
2. Problem set-up, mathematical formulation and discretisation
2.1. Flow configuration
The incompressible flow past a 2-D rectangular cylinder with aspect ratio  ${A{\kern-4pt}R} \equiv L/D = 5$ is considered, with
 $L$ and
 $D$ being the cylinder length and thickness. Figure 1 shows the geometry, the reference system and the notation. A Cartesian coordinate system is used, with origin at the LE of the cylinder, with the
 $x$-axis aligned with the flow direction, and the
 $y$-axis denoting the cross-stream direction. The cylinder is placed in a uniform stream with velocity
 $U_\infty$. The computational domain
 $\varOmega$ is rectangular with dimensions
 $L_x$ and
 $L_y$. The Reynolds number, based on the undisturbed velocity
 $U_\infty$ and the cylinder thickness, is defined as
 $Re=U_\infty D/\nu$, where
 $\nu$ is the kinematic viscosity. The flow is governed by the incompressible Navier–Stokes equations written in dimensionless form:
 \begin{equation} \left. \begin{gathered} \displaystyle \frac{\partial \boldsymbol{U}}{\partial t} + \boldsymbol{U} \boldsymbol{\cdot} \boldsymbol{\nabla}\boldsymbol{U} ={-}\boldsymbol{\nabla}P + \frac{1}{Re}\,\Delta \boldsymbol{U},\\ \boldsymbol{\nabla} \boldsymbol{\cdot} \boldsymbol{U} =0, \end{gathered} \right\} \end{equation}
where  $\boldsymbol {U}$ is the velocity vector of components
 $(U,V,W)$, and
 $P$ is the reduced pressure. No-slip and no-penetration boundary conditions are applied on the cylinder surface, whereas an undisturbed uniform velocity is assumed in the far field. The outflow boundary condition
 $P\boldsymbol {n} - ({1}/{Re})\,\boldsymbol {\nabla } \boldsymbol {U} \boldsymbol {\cdot } \boldsymbol {n}=0$, where
 $\boldsymbol {n}$ is the normal vector, is used at the outflow boundary.
Sketch of the computational domain  $\varOmega$ containing the rectangular cylinder, and the reference system.

2.2. Secondary instability: Floquet analysis
When the value of the Reynolds number is above the critical value  $Re_{c1}$ of the Hopf bifurcation for the primary instability, but below the critical value
 $Re_{c2}$ for the secondary instability, the flow is periodic and 2-D. The Floquet theory is used to study the linear stability analysis of the 2-D and time-periodic base flow to 3-D disturbances. As long as
 $Re_{c1} \le Re \le Re_{c2}$, the flow field
 $\{\boldsymbol {U},P\}$ is written as the sum of a 2-D base flow
 $\{\boldsymbol {U}_b,P_b\}$, which is periodic with period
 $T$, and an unsteady 3-D perturbation with small amplitude
 $\epsilon$:
 \begin{equation} \left. \begin{gathered} \boldsymbol{U}(x,y,z,t) = \boldsymbol{U}_b(x,y,t) + \epsilon\,\frac{1}{\sqrt{2 {\rm \pi}}} \int_{-\infty}^{\infty} \boldsymbol{u}(x,y,k,t)\,{\rm e}^{{\rm i}kz}\,{\rm d}k,\\ P(x,y,z,t) = P_b(x,y,t) + \epsilon\,\frac{1}{\sqrt{2 {\rm \pi}}} \int_{-\infty}^{\infty} p(x,y,k,t) {\rm e}^{{\rm i}kz}\,{\rm d}k, \end{gathered} \right\} \end{equation}
where  $\textrm {i}$ is the imaginary unit,
 $\boldsymbol {u}$ and
 $p$ indicate the Fourier transform of the velocity and pressure disturbances in the homogeneous spanwise direction
 $z$, and
 $k$ is the corresponding wavenumber.
Introducing the decompositions (2.2) into the governing equations (2.1), the 2-D base flow equation is obtained at order  $\epsilon ^{0}$, while the eigenproblem describing the linear evolution of the 3-D disturbances is obtained at order
 $\epsilon$. By applying the Fourier transform in
 $z$, the linearised Navier–Stokes equations (LNSEs) read for each
 $k$:
 \begin{equation} \left. \begin{gathered} \displaystyle \frac{\partial \boldsymbol{u}}{\partial t} + \boldsymbol{L}_k \{\boldsymbol{U}_b, Re \}\, \boldsymbol{u} + \boldsymbol{\nabla}_k p = 0,\\ \boldsymbol{\nabla}_k \boldsymbol{\cdot} \boldsymbol{u} = 0, \end{gathered} \right\} \end{equation}
where  $\boldsymbol {\nabla }_k \equiv (\partial / \partial x, \partial / \partial y, \textrm {i}k)$ is the Fourier-transformed gradient operator, and
 $\boldsymbol {L}_k$ is the Fourier-transformed linearised Navier–Stokes operator:
 \begin{equation} \boldsymbol{L}_k \{ \boldsymbol{U}_b, Re \}\,\boldsymbol{u}= \boldsymbol{U}_b \boldsymbol{\cdot} \boldsymbol{\nabla}_k \boldsymbol{u} + \boldsymbol{u} \boldsymbol{\cdot} \boldsymbol{\nabla}_k \boldsymbol{U}_b - \frac{1}{Re}\,\Delta_k \boldsymbol{u} , \end{equation}
in which  $\Delta _k \equiv \boldsymbol {\nabla }_k \boldsymbol {\cdot } \boldsymbol {\nabla }_k$ is the Fourier-transformed Laplacian operator. According to the Floquet theory, we assume the functional form for the perturbation field
 $\{ \boldsymbol {u}, p \}$ given by
 \begin{equation} \left. \begin{gathered} \boldsymbol{u}(x,y,k,t)=\boldsymbol{\hat{u}}(x,y,k,t)\,{\rm e}^{\sigma t}, \\ p(x,y,k,t) = \hat{p}(x,y,k,t)\,{\rm e}^{\sigma t}, \end{gathered} \right\} \end{equation}
where  $\sigma$ is the Floquet exponent, and
 $\{\boldsymbol {\hat {u}},\hat {p} \}$ is the Floquet mode associated with
 $\sigma$ and
 $k$, possessing the same periodicity of the base flow:
 \begin{equation} \{ \boldsymbol{\hat{u}}, \hat{p} \}(x,y,k,t+T) =\{ \boldsymbol{\hat{u}}, \hat{p} \}(x,y,k,t). \end{equation}
These modes can be obtained by a Krylov subspace method together with the Arnoldi iteration algorithm (Barkley & Henderson Reference Barkley and Henderson1996). The stability of the system is determined by the sign of the real part  $\mathrm {Re}(\sigma )$ of the Floquet exponent or, equivalently, by the modulus of the Floquet multiplier
 $\mu =\textrm {e}^{\sigma T}$. If all
 $\mathrm {Re}(\sigma )<0$, or
 $|\mu |<1$, then the perturbations decay and the flow remains 2-D; otherwise, if at least one exponent exists with
 $\mathrm {Re}(\sigma )>0$, or
 $|\mu |>1$, then the perturbations grow exponentially and the flow becomes 3-D if
 $k \ne 0$.
2.3. Structural sensitivity
A better understanding of the instability can be obtained through the structural sensitivity, introduced by Giannetti & Luchini (Reference Giannetti and Luchini2007) for the primary instability and then extended by Giannetti, Camarri & Luchini (Reference Giannetti, Camarri and Luchini2010) to the secondary instability. It is based on direct and adjoint modes.
The adjoint LNSEs are
 \begin{equation} \left. \begin{gathered} \displaystyle - \frac{\partial \boldsymbol{f}^{+}}{\partial t} + {L}_k^{+} \{\boldsymbol{U}_b, Re \}\,\boldsymbol{f}^{+} - \boldsymbol{\nabla}_k m^{+} =0,\\ \boldsymbol{\nabla}_k \boldsymbol{\cdot} \boldsymbol{f}^{+} = 0, \end{gathered} \right\} \end{equation}
where  ${L}_k^{+} \{\boldsymbol {U}_b, Re \}$ is the Fourier-transformed adjoint linearised Navier–Stokes operator:
 \begin{equation} {L}_k^{+} \{\boldsymbol{U}_b, Re \}\,\boldsymbol{f}^{+} ={-} ( \boldsymbol{U}_b \boldsymbol{\cdot} \boldsymbol{\nabla}_k )\,\boldsymbol{f}^{+} + (\boldsymbol{\nabla}_k \boldsymbol{U}_b ) \boldsymbol{\cdot} \boldsymbol{f}^{+} - \frac{1}{Re}\,\Delta_k \boldsymbol{f}^{+}. \end{equation}
The adjoint solution  $\{\boldsymbol {f}^{+}, m^{+}\}$ provides the receptivity of the modes to an external forcing, so that direct and adjoint perturbation modes highlight the regions of maximum perturbation and maximum receptivity. The structural sensitivity tensor
 $\boldsymbol{\mathsf{S}}$ puts these pieces of information together, and identifies the so-called wavemaker region (Monkewitz, Huerre & Chomaz Reference Monkewitz, Huerre and Chomaz1993), i.e. the region where the instability takes place. It is defined as
 \begin{equation} \boldsymbol{\mathsf{S}}(x,y,k) = \frac{\int_t^{t+T} \boldsymbol{\hat{f}}^{+}(x,y,k,t)\,\boldsymbol{\hat{u}}(x,y,k,t) \, {\rm d}t}{\int_{t}^{t+T} \int_\varOmega \boldsymbol{\hat{f}}^{+} \boldsymbol{\cdot} \boldsymbol{\hat{u}} \, {\rm d}\varOmega \, {\rm d}t}. \end{equation}
The instability mechanism may be elucidated by inspecting the different components of  $\boldsymbol{\mathsf{S}}$. However, as shown by Giannetti et al. (Reference Giannetti, Camarri and Luchini2010), it is easier to choose a norm
 $\| \cdot \|$ and to extract information from
 $\boldsymbol{\mathsf{S}}$ by plotting
 $\| \boldsymbol{\mathsf{S}}(x,y,k) \|$ at each point of the space. Note that while
 $\boldsymbol{\mathsf{S}}$ provides information that is averaged over the period
 $T$, it may be meaningful to consider the instantaneous sensitivity tensor
 $\boldsymbol{\mathsf{I}}(x,y,k,t)$ defined as
 \begin{equation} \boldsymbol{\mathsf{I}}(x,y,k,t) = \frac{ \boldsymbol{\hat{f}}^{+}(x,y,k,t)\,\boldsymbol{\hat{u}}(x,y,k,t) }{\int_{t}^{t+T} \int_\varOmega \boldsymbol{\hat{f}}^{+} \boldsymbol{\cdot} \boldsymbol{\hat{u}} \, {\rm d}\varOmega \, {\rm d}t}. \end{equation}
2.4. Numerical methods
The 2-D periodic base flow is computed by integrating in time the discretised 2-D version of the Navier–Stokes equations (2.1). The time integration employs an explicit third-order low-storage Runge–Kutta method for the nonlinear term, combined with an implicit second-order Crank–Nicolson scheme (Rai & Moin Reference Rai and Moin1991) for the linear terms. The spatial discretisation uses finite elements, with quadratic elements for velocity, and linear elements for pressure, to satisfy the Ladyzhenskaya–Babus̆ka–Brezzi (LBB) condition (Brezzi Reference Brezzi1974). Simulations are implemented in the non-commercial software FreeFem++ (Hecht Reference Hecht2012). The BoostConv algorithm, an iterative algorithm inspired by the Krylov subspace methods, is used to accelerate the convergence of the simulations to the periodic limit cycle (Citro et al. Reference Citro, Luchini, Giannetti and Auteri2017). Figure 2 shows the decrease of residuals, defined as the absolute value of the largest difference over the computational domain between variables at  $t$ and
 $t+T$. At
 $Re=500$, velocity and pressure residuals decrease fast, as well as the residual of the period
 $T$. An almost exponential decrease is observed, with residuals reaching
 $10^{-10}$ after
 $38$ shedding periods, and the base flow is verified to satisfy the required spatio-temporal symmetries
 \begin{equation} \left. \begin{gathered} U_b(x,y,t) = U_b(x,-y,t+T/2), \\ V_b(x,y,t) ={-} V_b(x,-y,t+T/2), \\ P_b(x,y,t) = P_b(x,-y,t+T/2) \end{gathered} \right\} \end{equation}
within the same threshold.
Convergence of the base flow to its periodic limit cycle at  $Re=500$. Decrease of the residuals with the number
 $N$ of shedding cycles.

The numerical method used for the Floquet analysis is similar to that used in other works, for example, Barkley & Henderson (Reference Barkley and Henderson1996) and Jallas, Marquet & Fabre (Reference Jallas, Marquet and Fabre2017). If  $\boldsymbol {u}_k(t_0)$ is the velocity perturbation with wavenumber
 $k$ at time
 $t_0$, then its evolution after one period can be written using the linearised Poicaré map
 $P_k$ as
 \begin{equation} \boldsymbol{u}_k(t_0+T) = P_k\,\boldsymbol{u}_k(t_0). \end{equation}
The eigenvalues and eigenvectors of  $P_k$ are the Floquet multipliers
 $\mu _k$ and the Floquet modes
 $\boldsymbol {\hat {u}}_k(t_0)$ at the time
 $t_0$ of the operator
 $L_k$. We have used the Arnoldi method (Saad Reference Saad2011) to compute the eigenvalues of
 $P_k$ with largest modulus, and the associated eigenvectors. To this purpose, the action of
 $P_k$ on the perturbation
 $\boldsymbol {u}_k(t_0)$ is obtained by integrating (2.3) in time from
 $t_0$ to
 $t_0+T$. The modified Gram–Schmidt algorithm is used for the orthogonalisation of the eigenvectors, and all the computed modes are normalised using their total kinetic energy. Finally, the evolution of the Floquet mode
 $\boldsymbol {\hat {u}}_k(t)$ over the period
 $T$ is evaluated by integrating (2.3) in time. In doing this, the initial condition is the approximated eigenvector
 $\boldsymbol {\hat {u}}_k(t_0)$ computed previously; the result of the integration is then corrected by
 $\textrm {e}^{-\lambda t}$ to account for (2.5). For consistency, the time integration of the LNSEs is carried out using the same numerical scheme used for integrating the 2-D Navier–Stokes equations to compute the base flow. During the time integration of the LNSEs, the base flow is evaluated at each time step by the Fourier interpolation of
 $100$ instantaneous fields stored uniformly over one period
 $T$. The same approach is used when computing the adjoint modes, but considering (2.7) instead of (2.3); the adjoint modes are normalised by their total kinetic energy.
The computational domain extends for  $-25D \le x \le 50D$ in the streamwise direction and for
 $-20 D \le y \le 20 D$ in the cross-stream direction, corresponding to size
 $(L_x,L_y)=(75D,40D)$. A symmetric grid with respect to the
 $x$-axis has been used, to avoid the introduction of asymmetries in the flow. The number of triangles is approximately
 $1.2 \times 10^{5}$, with
 $200$ and
 $100$ elements over the longitudinal and vertical sides of the cylinder, respectively. The sensitivity of the results on the domain size and grid resolution is discussed in the Appendix. For the direct problem, homogeneous Dirichlet boundary conditions are used at the inlet and at the far field, while homogeneous Neumann boundary conditions for the velocity are used at the outflow. For the adjoint problem, instead, we have used homogeneous Dirichlet boundary conditions for the velocity at all the boundaries of the domain, as in Giannetti et al. (Reference Giannetti, Camarri and Luchini2010).
The 3-D DNS has been performed using a DNS code introduced by Luchini (Reference Luchini2016). The code solves the 3-D incompressible Navier–Stokes equations written in primitive variables on a staggered Cartesian grid using second-order finite differences in all directions. The momentum equations are advanced in time by a fractional-step method using a third-order Runge–Kutta scheme. The Poisson equation for the pressure is solved by an iterative successive over-relaxation algorithm. The cylinder is considered with a second-order implicit immersed-boundary method, implemented in staggered variables (Luchini Reference Luchini2013, Reference Luchini2016). The unperturbed flow  $(U_\infty,0,0)$ is imposed at the inlet and in the far field, and periodic boundary conditions are used in the spanwise direction and convective outlet conditions at the outflow. This DNS code has been used previously to compute the flow past a rectangular cylinder with
 ${A{\kern-4pt}R} =5$ in the turbulent regime by Chiarini & Quadrio (Reference Chiarini and Quadrio2021).
The computational domain used for the 3-D simulation extends for  $-30D \le x \le 80D$,
 $-25D \le y \le 25D$ and
 $0 \le z \le 2 {\rm \pi}D$, corresponding to size
 $(L_x,L_y,L_z) = (110D,50D,2{\rm \pi} D)$; here,
 $z$ denotes the spanwise periodic direction. The cylinder is placed at
 $0 \le x \le 5D$ and
 $-0.5D \le y \le 0.5D$. The domain is discretised with
 $N_x \approx 1072$,
 $N_y \approx 590$ and
 $N_z \approx 200$ points in the three directions, for a total of approximately 130 million points. Their distribution is homogeneous in the spanwise direction, whereas a geometric progression is adopted in the streamwise and vertical directions to properly refine the grid near the corners of the body. The numbers of points along the longitudinal and vertical sides of the cylinder are respectively
 $270$ and
 $170$. The cell size near the corners is approximately
 $\Delta x = \Delta y \approx 0.005$. Hereafter, if not otherwise indicated, all variables are in dimensionless form with
 $D$ as length scale,
 $U_\infty$ as velocity scale, and
 $D/U_\infty$ as time scale.
3. Base flow
To characterise the 2-D periodic base flow, the beginning of each cycle is identified by the conditions  $C_\ell =0$ and
 $\partial C_\ell / \partial t > 0$, where
 $C_\ell$ is the lift coefficient, i.e. the vertical component of the aerodynamic force, made dimensionless with
 $0.5 \rho U_\infty ^{2} D$. The flow separates at the LE and reattaches at a point
 $x_r$ along the cylinder side; the recirculating region on each side of the cylinder periodically enlarges and shrinks while LE vortices are being shed. This is described by the evolution in time of the reattachment point
 $x_r$ over one shedding period, shown in figure 3 for
 $Re=550$. The length of the recirculating region reaches its minimum,
 $x_r \approx 2.6$, after the shedding of a new LE vortex at
 $t/T \approx 0.85$. Then
 $x_r$ increases linearly until the maximum
 $x_r \approx 4.25$ is reached, to shrink again as a new vortex is shed downstream.
Position of the reattachment point  $x_r$ on the top surface along the period as a function of
 $t/T$ for
 $Re=550$.

Figure 4 shows streamlines and the vorticity ( $\omega _z$) colour map at four instants within one half of the shedding period (the spatio-temporal symmetry allows one to reconstruct the base flow over the complete period). The stagnation points are marked with symbols. Grey diamonds are used for the elliptic stagnation points corresponding to a local maximum or minimum of the stream function
 $\psi$, defined as
 $\nabla ^{2} \psi = -\omega _z$; green diamonds indicate hyperbolic stagnation points corresponding to saddle points of
 $\psi$. Within the large recirculating region over the cylinder side, the reverse boundary layer separates periodically, owing to the adverse pressure gradient, and produces a smaller secondary counter-rotating recirculation region near the body. The size of this recirculating region increases over the shedding period, until a new LE vortex is shed downstream towards the TE. As shown by Chiarini et al. (Reference Chiarini, Quadrio and Auteri2022b), this vortex reaches the TE in phase with the development of a new TE vortex from the same side (figure 4b) and the two then coalesce before being shed in the wake (figures 4c,d).
Snapshots of the base flow at  $Re=550$, taken at four different instants along the period. Streamlines are superimposed on the
 $\omega _z$ vorticity map (blue and red are clockwise and counterclockwise vorticity, respectively). Grey/green diamonds indicate elliptic/hyperbolic stagnation points.

The vortex splitting taking place in the main top and bottom recirculation regions and responsible for the LE vortex shedding is described following the work by Boghosian & Cassel (Reference Boghosian and Cassel2016). In a 2-D incompressible flow, a splitting event takes place at a point within a recirculation region if and only if: (i) the point is a critical point for the stream function,  $\partial \psi / \partial x= \partial \psi / \partial y = 0$, i.e. a stagnation point with
 $u=v=0$; and (ii) the quantity
 \begin{equation} Q=\frac{\partial u}{\partial x}\,\frac{\partial v}{\partial y} - \frac{\partial u}{\partial y}\, \frac{\partial v}{\partial x} \end{equation}
evaluated at the point is negative. In other words, a hyperbolic stagnation point is required for splitting. For the top side at  $t/T=0$, shedding has just occurred and the size of the recirculation region is at its minimum. Two elliptic stagnation points (with
 $Q>0$) identify the centre of rotation of the main recirculation region and the vortex just shed from it. A similar situation is observed for
 $t/T=0.15$, but a new elliptic stagnation point indicates the appearance of the secondary counter-rotating recirculation. At
 $t/T=0.32$, a hyperbolic stagnation point appears at
 $x \approx 2$, just above the secondary recirculation; at this time, vortex splitting is allowed. Shortly thereafter, the elliptic stagnation point associated with the counter-rotating region and the new hyperbolic one become closer until they collapse, and vortex splitting actually occurs. Splitting completes at
 $t/T \approx 0.85$, resulting in the abrupt reduction of the length of the primary recirculation shown in figure 3.
Figure 5 shows the dependence of the Strouhal number  $St = fL/U_\infty$, i.e. the shedding frequency made dimensionless with
 $L$ and
 $U_\infty$, on
 $Re$ in the range
 $400 \le Re \le 550$. Within this range,
 $St$ does not change significantly, with a maximum variation of approximately
 $1.4\,\%$. However,
 $St$ increases to a maximum at
 $Re \approx 485$ and then decreases monotonically. Interestingly, the
 $Re$ of maximum
 $St$ corresponds approximately to the first onset of the 3-D instability, as will be shown in the following. We also note that for
 $Re \ge 555$, the 2-D base flow undergoes a further 2-D instability and enters a non-periodic regime where the LE and TE shedding are no longer locked to the same frequency. This is described in § 5.
Dependence of  $St$ on
 $Re$.

4. An almost subharmonic instability
4.1. Floquet multipliers
Figure 6 shows the dominant Floquet multipliers for four values of  $Re$ in the range
 $480 \le Re \le 550$. Figure 6(a) shows the magnitude of the multipliers for wavenumbers
 $1.5 \le k \le 4$ for which they become unstable, while figure 6(b) plots the Floquet multipliers in the complex space for
 $Re=500$ and
 $k=2.1$.
(a) Modulus of the most unstable Floquet multiplier at  $Re=480, 500, 525, 550$ for
 $1.5 \le k \le 4$. (b) Floquet multipliers in the complex plane for
 $k = 2.1$ at
 $Re=500$. The inset zooms on the unstable pair outside the unitary circle.

A first multiplier with  $|\mu |>1$ appears for
 $Re=Re_{c2} \approx 480$ and
 $k \approx 2.1$. For
 $Re>Re_{c2}$, a band of unstable wavenumbers appears. As
 $Re$ increases, this band widens and the branch moves towards slightly larger
 $k$. Figure 6(b) shows the unstable branch to correspond to a pair of complex conjugate multipliers with negative real part and very small imaginary part. The plot shows the expected multiplier
 $\mu = (1,0)$ associated with the time-translation symmetry of the base flow, and highlights in the inset a pair of complex conjugate multipliers
 $\mu = (-1.087, \pm 0.000816)$ outside the unit circle. This pair indicates that the periodic 2-D base flow is linearly unstable to 3-D quasi-subharmonic perturbations. Indeed, it corresponds to a pair of complex conjugate eigenvalues
 $\sigma = 1/T \log (\mu ) \approx (0.0073, \pm 0.6012)$ that denote an unstable mode (
 $\mathrm {Re}(\sigma )>0$) with period
 $2 {\rm \pi}/ \mathrm {Im}(\sigma ) \approx 10.45$, which is almost twice the period of the base flow. Hereafter we refer to this mode as mode QS.
Mode QS differs substantially from mode QP observed for the square cylinder (Blackburn & Sheard Reference Blackburn and Sheard2010) and mode S $^{\prime }$ observed for elongated cylinders without LE vortex shedding (Ryan et al. Reference Ryan, Thompson and Hourigan2005). Indeed, the wavenumber is clearly different: the latter modes both have
 $k \approx 5- 6$ instead of
 $k \approx 2$. More importantly, they are quasi-periodic modes corresponding to a pair of complex conjugate Floquet multipliers with relatively large imaginary part: Blackburn & Sheard (Reference Blackburn and Sheard2010) report
 $\mathrm {Im}(\mu ) \approx 0.4$ for mode QP, and we have computed
 $\mathrm {Im}(\mu ) \approx 0.1$ for mode S
 $^{\prime }$ in the case of a D-shaped cylinder with
 ${A{\kern-4pt}R} =5$ at
 $Re=500$. This should be contrasted with
 $\mathrm {Im}(\mu ) = 0.000816$ of mode QS in the present case. The different nature of this mode and its triggering mechanism will be illustrated later (see § 4.5).
The existence of this pair of unstable Floquet multipliers with negative real part and nearly zero imaginary part is in agreement with the observation by Marques, Lopez & Blackburn (Reference Marques, Lopez and Blackburn2004) and Blackburn et al. (Reference Blackburn, Marques and Lopez2005), based on the seminal work of Swift & Wiesenfeld (Reference Swift and Wiesenfeld1984), that systems with a spatio-temporal symmetry cannot undergo a period-doubling codimension-one bifurcation. In terms of Floquet analysis, it means that multipliers outside the unit circle cannot have negative real part and null imaginary part. This recalls the dispute regarding the nature of the mode QP instability in the wake of a square cylinder. Robichaux et al. (Reference Robichaux, Balachandar and Vanka1999) reported a subharmonic instability, but Blackburn & Lopez (Reference Blackburn and Lopez2003) demonstrated its quasi-periodic nature. Later, Blackburn & Sheard (Reference Blackburn and Sheard2010) showed that this mode is subharmonic only when the base flow becomes asymmetric, proving their claim by placing the square cylinder at an incidence of seven degrees with respect to the incoming flow. Following the same reasoning, we have repeated the Floquet analysis at  $Re=500$ using slightly asymmetric boundary conditions at the inlet and at the far field, by enforcing
 $V=0$ but
 $U=U_\infty ( 1 + \delta y/D )$. A very small
 $\delta = 1.6 \times 10^{-5}$ is enough for the multipliers to collapse to the real axis, thus yielding a generic subharmonic unstable mode.
4.2. Direct and adjoint modes
Figure 7(a) shows the spatial structure of the real part of the streamwise vorticity of the unstable QS mode for  $Re=500$ and
 $k=2.1$. The perturbation field is maximum near the vortex cores of the base flow, as for the flow past other bluff bodies (see, for example, Thompson, Leweke & Williamson Reference Thompson, Leweke and Williamson2001; Chaurasia & Thompson Reference Chaurasia and Thompson2011). Unlike the square and circular cylinders (Noack & Eckelmann Reference Noack and Eckelmann1994; Barkley & Henderson Reference Barkley and Henderson1996; Robichaux et al. Reference Robichaux, Balachandar and Vanka1999), elongated cylinders with elliptic LE (Ryan et al. Reference Ryan, Thompson and Hourigan2005) and the primary instability of the same rectangular cylinders (Chiarini et al. Reference Chiarini, Quadrio and Auteri2021), here the perturbation field is not localised in the wake; indeed, large perturbations are observed also over the cylinder side. Hence the QS mode is not an unstable mode of the wake, but relates to the separating and reattaching flow over the cylinder side and to the vortex splitting/shedding, as will be discussed later (see § 4.5). The symmetry is such that the sign of the streamwise vorticity changes from one period to the next, in agreement with the nearly subharmonic nature of the mode.
Unstable mode for  $Re=550$ and
 $k=2.1$. (a) Real part of the streamwise vorticity of the direct mode. (b) Real part of the
 $\hat {f}_y^{+}$ component of the adjoint mode.

Figure 7(b) shows the spatial structure of the real part of the  $f_y^{+}$ component of the adjoint mode, which propagates upstream. Large values are observed over the fore portion of the cylinder, with maxima placed near the LE corners, identified as the region of maximum receptivity of the flow. This differs from the primary instability, where the maximum receptivity is found close to the TE corners (Chiarini et al. Reference Chiarini, Quadrio and Auteri2021).
4.3. Structural sensitivity
Following the work by Giannetti et al. (Reference Giannetti, Camarri and Luchini2010), figure 8 plots the spectral norm of the time-averaged structural sensitivity tensor  $\boldsymbol{\mathsf{S}}$ for
 $k=2.1$ at
 $Re=550$, with the mean streamlines in the background. We have compared other norms and several values of
 $k$ and
 $Re$, but the map did not change significantly.
Streamlines and spectral norm of the tensor field  $\boldsymbol{\mathsf{S}}$ evaluated at
 $k=2.1$ and
 $Re=550$.

The norm  $\| \boldsymbol{\mathsf{S}} \|$ of the sensitivity tensor vanishes almost everywhere, except near the top/bottom sides of the cylinder, indicating a localised wavemaker region. It differs from the 3-D instability of the circular and square cylinders (Giannetti et al. Reference Giannetti, Camarri and Luchini2010) and the primary instability of rectangular cylinders (Chiarini et al. Reference Chiarini, Quadrio and Auteri2021), where the sensitivity is always located within the recirculation region downstream of the TE, thus suggesting a different triggering mechanism for the present instability. Figure 8 shows four local maxima of the sensitivity norm, two for each side. One maximum of each pair is located very close to the cylinder surface at
 $x \approx 2.6$ and
 $y \approx \pm 0.55$. A second, slightly lower maximum is placed at
 $x \approx 2.56$ and
 $y \approx \pm 0.8$, very close to the stagnation point at the centre of the mean recirculation. Overall, the map of
 $\| \boldsymbol{\mathsf{S}} \|$ confirms the suggestion put forward above that the unstable QS mode does not originate in the wake, and that the triggering mechanism is embedded in the dynamics of the side recirculation, namely in its periodic sequence of enlargement, vortex splitting and shrinking.
Although the cycle-averaged tensor  $\boldsymbol{\mathsf{S}}$ locates the core of the 3-D instability on the cylinder side, the instantaneous sensitivity tensor
 $\boldsymbol{\mathsf{I}}$ provides further insight, as it describes intracycle variations. Since
 $\boldsymbol{\mathsf{I}}$ is the result of the product of the direct and adjoint Floquet modes (see (2.10)), it possesses the the same periodicity of the base flow, i.e.
 $I(x,y,k,t)=I(x,y,k,t+T)$. In figure 9, the norm
 $\|\boldsymbol{\mathsf{I}} \|$ is plotted at eight instants along one shedding cycle. The two pairs of maxima remain localised over the sides of the cylinder during the entire shedding cycle. The first maximum is centred in the hyperbolic stagnation point that separates the side recirculation before the shedding (see the bottom side at
 $t/T=0.15$), whereas the second highlights the recirculation region that is about to be shed (see the top side at
 $t/T=0.32$). Referring to the top side only,
 $\| \boldsymbol{\mathsf{I}} \|$ first becomes significant at
 $t/T \approx 0.32$, when the vortex splitting starts and the hyperbolic stagnation point appears. At first,
 $\boldsymbol{\mathsf{I}}$ is mostly localised in the recirculation region identifying the new generated vortex before being shed, with large values in the elliptic stagnation point (i.e. its centre of rotation) and close to the cylinder side where the streamlines have large curvature. Then, in the phases before the vortex is shed,
 $\boldsymbol{\mathsf{I}}$ is mostly relevant in the region close to the hyperbolic stagnation point where the vortex splitting is occurring; see
 $t/T=0.65$ and
 $t/T=0.82$. When the vortex is eventually shed and the hyperbolic stagnation point disappears, no further significant values of
 $\boldsymbol{\mathsf{I}}$ are observed; see
 $t/T=0$ and
 $t/T=0.15$. Overall, this indicates that the onset of the 3-D instability is embedded in the vortex splitting and in the interaction between the involved recirculation regions, before the LE vortex shedding occurs.
Structural sensitivity for  $k = 2.1$ at
 $Re=550$. Spectral norm of the tensor field
 $\boldsymbol{\mathsf{I}}$ and streamlines of the base flow at eight times along the shedding cycle. Grey/green diamonds indicate elliptic/hyperbolic stagnation points.

4.4. Three-dimensional direct numerical simulation
A 3-D DNS has been performed to confirm and expand the result of the Floquet analysis. The Reynolds number has been set to  $Re=500$, i.e. just above the critical value
 $Re_{c2}=480$ predicted by the Floquet analysis. The 2-D potential flow solution has been used as initial condition. After having discarded the initial transient, the simulation has been advanced for approximately
 $400$ shedding cycles with a variable time step to ensure the Courant–Friedrichs–Lewy number is
 ${\le}1$, yielding on average
 $\Delta t \approx 0.0077 D/U_\infty$.
We start focusing on the temporal flow scales, shown in figure 10 in terms of power spectra against the dimensionless frequency  $St = f L / U_\infty$. Figure 10(a) shows the power spectrum of the lift coefficient
 $S(C_\ell )$; in this case, the lift coefficient is defined as the vertical component of the aerodynamic force per unit span made dimensionless with
 $0.5 \rho U_\infty ^{2} D$. Figure 10(b), instead, shows the spectrum of the spanwise velocity component
 $w$ evaluated at the point with coordinates
 $(x,y,z) \approx (7, 0.5,{\rm \pi} )$. The peak in the spectrum of
 $C_\ell$ identifies the shedding frequency of the base flow, i.e.
 $St = 0.966$. This value is nearly coincident with the frequency identified by the 2-D simulation, i.e.
 $St = 0.960$, with a difference of less than
 $1\,\%$. The 3-D simulation reveals that the flow is 3-D at this Reynolds number, confirming the results of the linear Floquet stability analysis. The power spectrum of
 $w$ contains two dominant frequencies. The largest one, i.e.
 $St \approx 0.961$, is associated with the vortex shedding and coincides with the
 $C_\ell$ peak. A second, lower peak is found for
 $St \approx 0.480$, indicating the time scale of the 3-D instability and confirming its almost subharmonic nature. Again, this time scale is in excellent agreement with the results of the Floquet analysis. In fact, the unstable pair of Floquet multipliers found for
 $Re=500$ at
 $k=2.1$ are
 $\mu = (-1.087, \pm 0.000816)$, corresponding to an unstable mode with frequency
 $St \approx 0.475$; the difference between the two values is again approximately
 $1\,\%$. The frequency associated with the unstable QS mode appears in the power spectrum of the signal for the three velocity components recorded in various positions, but it is not visible in the signal of the lift and drag coefficients. This is because the 3-D flow repeats identically at two successive shedding cycles modulo a
 ${\rm \pi}$ phase shift in the spanwise homogeneous direction, and integration over the lateral surface of the cylinder is invariant under such phase shifts. This point is better appreciated looking at figure 11, where the 3-D flow in two corresponding instants of two successive shedding cycles is shown.
Temporal flow scales extracted by a 3-D DNS at  $Re=500$. Power spectra of (a) the lift coefficient
 $C_\ell$, and (b) the spanwise velocity component
 $w$ measured at the position
 $(x,y,z) \approx (7, 0.5, {\rm \pi})$.

Instantaneous flow visualisation from DNS at  $Re=500$. Isosurfaces of
 $\lambda _2=-2$ at the same phase for two consecutive shedding cycles.

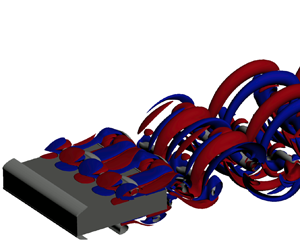
Figure 12 presents the spatial structure of the 3-D unstable mode, visualised through the  $\lambda _2$ quantity (Jeong et al. Reference Jeong, Hussain, Schoppa and Kim1997). Grey surfaces corresponding to
 $\lambda _2=-2$ are drawn together with surfaces of positive (red) and negative (blue) streamwise vorticity
 $\omega _x = \pm 0.25$. Three-dimensional hairpin-like structures originate from the lift up and stretching of the spanwise-aligned vortices at
 $x \approx 2.6$, i.e. the position over the cylinder side where the structural sensitivity is largest. The spanwise wavelength of the hairpin vortices, constrained by the spanwise size of the computational domain, is
 $\lambda = 2 {\rm \pi}/ k \approx {\rm \pi}$ and fits well the result of the Floquet analysis. These structures are then convected in the wake, where they transform into rib-like, streamwise-aligned structures. The field of streamwise vorticity resembles closely the direct mode plotted in figure 7. It is generated over the cylinder side at
 $x \approx 2.6$, close to the legs of the hairpin structures, and develops in the wake. Its sign changes from one period to the next, in agreement with the almost subharmonic nature of the QS mode.
Instantaneous flow visualisation from DNS at  $Re=500$. Grey surfaces indicate
 $\lambda _2=-2$. Red and blue surfaces indicate positive and negative streamwise vorticity
 $\omega _x = \pm 0.25$.

To further emphasise the quasi-subharmonic nature of the 3-D QS mode, figure 11 plots isosurfaces of  $\lambda _2=-2$ at the same phase of two consecutive shedding cycles. The hairpin-like structures characterising the instability are the same, but they are spatially shifted by half a period
 ${\rm \pi}$ in the spanwise direction, as anticipated above. Sasaki & Kiya (Reference Sasaki and Kiya1991), Tenaud et al. (Reference Tenaud, Podvin, Fraigneau and Daru2016) and Chaurasia & Thompson (Reference Chaurasia and Thompson2011) for a blunt flat plate observed a staggered pattern of hairpin-like vortices, denoted ‘pattern B’. Here, due to the lower aspect ratio, such a staggered pattern is not observed: only one line of hairpin vortices appears that is alternately shifted. In fact, when the hairpin vortices are generated, those generated at the previous period have already broken up and convected in the wake. The same pattern of staggered hairpin vortices was observed by Cimarelli et al. (Reference Cimarelli, Leonforte and Angeli2018) and Chiarini & Quadrio (Reference Chiarini and Quadrio2021) for the same rectangular cylinder with
 ${A{\kern-4pt}R} =5$ in the turbulent regime at
 $Re=3000$. Therefore, the mechanism triggering this 3-D instability appears to remain active in the turbulent regime, where the large-scale motions associated with the flow instabilities coexist with the small-scale turbulent fluctuations. This suggests that this 3-D instability is involved in the generation of small-scale turbulent structures that, in turn, do not destroy the large coherent structures, as they are detected also in the turbulent flow where they contribute to turbulent kinetic energy production (Bernal et al. Reference Bernal, Breidenthal, Brown, Konrad and Roshko1979; Browand & Troutt Reference Browand and Troutt1980). Hairpin vortices arranged in a staggered manner and with spanwise wavelength
 $\lambda \approx 3$ have also been observed by Hourigan et al. (Reference Hourigan, Thompson and Tan2001) for more elongated rectangular cylinders with
 ${A{\kern-4pt}R} =10$ and
 ${A{\kern-4pt}R} =13$ at
 $Re=350- 400$. This suggests that the QS unstable mode discovered here might be at play even for more elongated cylinders. Furthermore, the lower Reynolds number of their simulations suggests that the critical Reynolds number might decrease slightly with
 ${A{\kern-4pt}R}$.
4.5. Physical mechanism
In this subsection, the physical mechanism responsible for the onset of the 3-D instability is investigated. The structural sensitivity map indicates that the wavemaker is localised over the longitudinal sides of the cylinder. The phase sensitivity tensor  $\boldsymbol{\mathsf{I}}$ shows that the onset of the instability is associated with the interaction of the two recirculation regions separated by the hyperbolic stagnation point before the downstream vortex is shed. One would be tempted to interpret this as an elliptic instability, with the implication that the transition from 2-D to 3-D flow would be due to a linear mechanism that breaks up singular regions of elliptic streamlines. However, this instability is in fact not elliptic. The discussion below considers the unstable mode for
 $k=2.1$ at
 $Re=550$, but the general picture is unchanged for other wavenumbers and
 $Re$.
Figure 13 considers four phases within one half of the shedding period. Isocontours of the base flow vorticity are plotted together with the stagnation points and a colourmap of the spanwise vorticity of the unstable QS mode. The occurrence of the maximum of the perturbation field in the base flow vortex cores and the distribution of the spanwise perturbation vorticity may indicate that the instability is elliptic (Kerswell Reference Kerswell2002). Indeed, as required for an elliptic instability, the streamlines marking the base flow vortices have an elliptic shape, with major and minor axes approximately aligned with the  $x$ and
 $y$ directions; see figure 4. Moreover, the spanwise perturbation vorticity shows the two-lobe structure typical of an elliptic instability (Waleffe Reference Waleffe1990). The centres of the two lobes are aligned at approximately
 $45^{\circ }$ with respect to the axis of the ellipses (the direction of maximum strain is shown in figure 13 by dashed black lines). Interestingly, these features of the base flow and of the unstable mode resemble closely what was found by Chaurasia & Thompson (Reference Chaurasia and Thompson2011) for a blunt flat plate and, as they conclude, correspond to the required features for an elliptic instability. However, the flow past elongated rectangular cylinders possesses two features that are not consistent with an elliptic instability. The first is the almost subharmonic unstable mode. As shown by Waleffe (Reference Waleffe1990) and Kerswell (Reference Kerswell2002), for an unbounded strained vortex with strain rate tending to
 $0$, the instability is a subharmonic resonance, and has a frequency that is twice that of the elliptic flow. Therefore, the present quasi-subharmonic instability would fit the elliptic instability theory if the turnover rate of the base flow vortices was approximately equal to the shedding period
 $T \approx 5.2$. This is not the case: their rotational rate
 $\varOmega \approx \omega /2$ can be estimated at
 $2- 2.5$, which corresponds to a turnover time
 $\tau \approx 3.1- 3.5$. The second problem is the lack of this instability for shorter rectangular cylinders with only
 $n=1$ LE vortex accommodated over the cylinder side (Chiarini et al. Reference Chiarini, Quadrio and Auteri2022b). Indeed, we have not detected the QS mode for
 $3 \le {A{\kern-4pt}R} < 4.8$, although isolated recirculation regions with elliptic streamlines are present over the cylinder sides.
Four instants within half of the shedding period at  $Re=550$. The colourmap represents the spanwise vorticity of the unstable mode. Red/blue lines denote values of the base flow spanwise vorticity of
 $\omega _z = \pm 1$. Grey/green diamonds indicate elliptic/hyperbolic stagnation points. The dashed black lines denote the direction of maximum strain within the base flow vortices.

Hence we surmise that the transition towards a 3-D flow does not result from an elliptic instability of each recirculating region placed over the cylinder sides. The physical mechanism, instead, is purely inviscid and results from the mutual interaction between the vortices. This route was first shown by Pierrehumbert & Widnall (Reference Pierrehumbert and Widnall1982) for the family of periodic coherent shear layer vortices introduced by Stuart (Reference Stuart1967), based on an exact solution of the 2-D Euler equations. They found this configuration of vortices to be unstable to both 2-D and 3-D subharmonic perturbations, with the former having a larger growth rate. They observed that the 3-D unstable mode stretches successive vortices alternately above/below and forwards/backwards, leading to a configuration that is reminiscent of the pattern of the staggered hairpin vortices discussed above. Pierrehumbert & Widnall (Reference Pierrehumbert and Widnall1982) associated this instability with the so-called ‘helical pairing’ seen by Chandrsuda et al. (Reference Chandrsuda, Mehta, Weir and Bradshaw1978). However, in their model, the presence of the wall is not accounted for, and the 2-D instability dominates with its larger growth rate. Robinson & Saffman (Reference Robinson and Saffman1982) investigated the stability, in the limit of small vortex cross-sectional area and long axial-disturbance wavelength, of different vortex configurations, including the one of co-rotating vortices over a slip wall. For this case, they found that the fastest growing disturbances are subharmonic and 3-D, with spanwise wavelength approximately twice the distance between two successive vortices  $L_v$ (see figure 9 of their paper), which fits very well our observations as
 $\lambda /L_v \approx 2$. By means of the Taylor frozen flow hypothesis, this spatially subharmonic instability can be translated easily to our spatially evolving case, where the instability is almost subharmonic in time. At lower
 ${A{\kern-4pt}R}$, we argue that this instability is not observed because the dynamics of the base flow is quite different (Chiarini et al. Reference Chiarini, Quadrio and Auteri2022b), and much less time is available for the recirculation regions to interact with each other. An identical mechanism was later proposed by Huang et al. (Reference Huang, Zhou, Tang and Zhang2017) to explain the onset of three-dimensionality in the flow over a blunt flat plate; see also Abdalla & Yang (Reference Abdalla and Yang2004). However, the flow past a rectangular cylinder is quite different from that past a blunt flat plate. In fact, for the rectangular cylinder at the present
 $Re$, the 2-D periodic base flow is the result of the so-called impinging leading-edge vortex (ILEV) instability (Hourigan et al. Reference Hourigan, Thompson and Tan2001). Due to the interaction of an LE vortex with the TE corner, a pressure pulse arises, travels upstream and triggers the shedding of a new LE vortex, producing a self-sustained mechanism. In the flow over a blunt flat plate, instead, the ILEV instability does not occur, as there is no TE. In this case, the vortices shed from the LE shear layer that foster the 3-D instability result from a Kelvin–Helmholtz instability of the shear layer (Chaurasia & Thompson Reference Chaurasia and Thompson2011). In the flow past elongated rectangular cylinders, a Kelvin–Helmholtz instability of the LE shear layer is not observed at the Reynolds number here considered, although it becomes a key feature of the flow at larger
 $Re$, as described by Chiarini et al. (Reference Chiarini, Gatti, Cimarelli and Quadrio2022a) at
 $Re=3000$ in the turbulent regime. A further difference between the two flows is that for the blunt flat plate, the 3-D instability is exactly subharmonic, since the base flow does not satisfy the present spatio-temporal symmetry.
To sum up, we propose that this almost subharmonic instability is triggered by the mutual inviscid interaction of the vortices associated with the recirculation regions coexisting over the cylinder side, separated by a hyperbolic stagnation point before the vortex splitting occurs.
5. A second 2-D instability
In this section, the onset of a second 2-D instability for the 2-D periodic base flow past a rectangular cylinder with  ${A{\kern-4pt}R} =5$ is described.
When the Reynolds number is increased above  $Re \approx 555$, the 2-D base flow undergoes a second 2-D instability. This is seen in figure 14, where the time history of the lift coefficient
 $C_\ell$ is shown (figure 14a) for a 2-D simulation at
 $Re=600$, together with its power spectrum (figure 14b). Unlike at lower
 $Re$, figure 14(a) reveals that the flow is no longer periodic, with the time history containing more than one frequency. The power spectrum has three main peaks, at
 $f = 0.13542$,
 $0.19118$ and
 $0.25092$, corresponding to
 $St = 0.677$,
 $0.9559$ and
 $1.2546$. The intermediate one is present also at lower
 $Re$ and is associated with the vortex shedding. The other two peaks, instead, are associated with the onset of the secondary 2-D instability.
Two-dimensional simulation of the flow past a rectangular cylinder with  ${A{\kern-4pt}R} =5$ at
 $Re=600$. (a) Time history of the lift coefficient
 $C_\ell$. (b) Power spectrum of
 $C_\ell$.

The onset of this instability has been studied with a 2-D Floquet analysis. The same numerical procedure described for the 3-D case is used, but here the spanwise wavenumber is  $k=0$.
5.1. Floquet multipliers
Figure 15 shows the evolution of the dominant Floquet multipliers for Reynolds numbers in the range  $500 \le Re \le 550$. The branch corresponds to a pair of complex conjugate multipliers with negative real part and relatively large imaginary part. Increasing the Reynolds number,
 $|\mu |$ nears the unit circle: at
 $Re=550$ it is
 $\mu \approx (-0.336, \pm 0.912)$ corresponding to
 $|\mu | \approx 0.973$, indicating that
 $Re=550$ is slightly lower than the critical Reynolds number of this instability. Figure 15(b) shows that by increasing
 $Re$, both
 $|\mu |$ and
 $\mathrm {Im}(\mu )$ increase while
 $\mathrm {Re}(\mu )$ decreases slightly. The frequency associated with this complex conjugate pair is fully consistent with the peaks found in the spectrum for
 $Re=600$ in figure 14. Indeed, with the Floquet analysis, the perturbation field may be written as
 \begin{equation} \left. \begin{gathered} \boldsymbol{u}(x,y,t) = \hat{\boldsymbol{u}}(x,y,t)\,{\rm e}^{\sigma t}, \\ p(x,y,t) = \hat{p}(x,y,t)\,{\rm e}^{\sigma t}, \end{gathered} \right\} \end{equation}
where  $\{\hat {\boldsymbol {u}},\hat {p}\}$ is the 2-D Floquet mode with period
 $T$, and
 $\sigma$ is the eigenvalue associated with
 $\mu$:
 \begin{equation} \sigma = \frac{1}{T} \log(\mu). \end{equation}
At  $Re=550$ (the closest to criticality), the Floquet exponents associated with this mode are
 $\sigma = (-0.0053, \pm 0.3682)$. Therefore, the
 $\{\boldsymbol {u},p\}$ perturbation field is characterised by a frequency
 $f_T \pm f_{2D}$ – where
 $f_T =0.1914$ indicates the shedding frequency, and
 $f_{2D}=\mathrm {Im}(\sigma )/2 {\rm \pi}$ – that corresponds to
 $f = 0.1328$ and
 $f = 0.2500$ (or
 $St=0.6640$ and
 $St=1.25$), which are very close to the values found in the spectrum of
 $C_\ell$ at
 $Re=600$ (see figure 14b).
Floquet analysis of the secondary 2-D instability of the flow past a rectangular cylinder with  ${A{\kern-4pt}R} =5$. (a) Least stable Floquet multipliers at
 $Re=500$,
 $525$ and
 $550$; the continuous line represents the unit circle. (b) Dependence of
 $|\mu |$,
 $\mathrm {Re}(\mu )$ and
 $\mathrm {Im}(\mu )$ on
 $Re$.

From the values of these Floquet multipliers at different  $Re$, one can extrapolate the critical Reynolds number of the onset of this instability, i.e.
 $Re_{c3}$, as the
 $Re$ at which
 $\mu$ crosses the unit circle. By using a second-order extrapolation, we found
 $Re_{c3} \approx 555$.
5.2. Structural sensitivity
Figure 16 plots the instantaneous sensitivity at four times within half of the shedding period, i.e.  $t/T=0$, 0.15, 0.32 and
 $0.4$. As for the 3-D case, the sensitivity indicates that the wavemaker is localised close to the cylinder, and goes to zero both upstream and downstream. At all times, the largest sensitivity is where the streamlines have large curvature. For a more detailed description, we focus on the upper side of the cylinder. In figure 16(a), corresponding to
 $t/T = 0$, a large sensitivity is observed near the LE corner, suggesting a link to the Kelvin–Helmholtz instability of the separated shear layer. At larger
 $t/T$, the largest values are shifted within the separated shear layer and in the main recirculating region close to the cylinder side, in the reverse boundary layer just before the separation point (see figure 16b). At even larger
 $t/T$, the structural sensitivity further highlights the second region, indicating its relevance in the onset of the instability, until the vortex splitting occurs (see the top region of the flow in figures 16c,d). Finally, at
 $t/T=0.4$, the largest sensitivity is in the upstream part of the newly formed vortex shed downstream, close to the cylinder vertical side.
Structural sensitivity of the second 2-D instability at  $Re = 550$. Spectral norm of the tensor field
 $\boldsymbol{\mathsf{I}}$ and streamlines of the base flow at four times along the shedding cycle. Grey/green diamonds indicate elliptic/hyperbolic stagnation points.

6. Conclusions
The 3-D instability of the flow past a rectangular cylinder has been studied with Floquet analysis and DNS. The aspect ratio of the cylinder is  ${A{\kern-4pt}R} =5$, a value that defines the international benchmark of the aerodynamics of a rectangular 5 : 1 cylinder, or BARC.
The Floquet analysis has brought to light a new quasi-subharmonic (QS) unstable mode, so far undetected for other bluff bodies. A true codimension-one subharmonic mode cannot exist owing to the symmetries governing the base flow (Blackburn & Lopez Reference Blackburn and Lopez2003; Marques et al. Reference Marques, Lopez and Blackburn2004; Blackburn et al. Reference Blackburn, Marques and Lopez2005). However, a very small flow asymmetry is observed to lead to a generic subharmonic mode. The Reynolds number at which the QS mode first becomes unstable is  $Re_{c,2} \approx 480$, and its wavelength is
 $\lambda = 2 {\rm \pi}/k \approx 3$. Unlike the unstable modes of the flow past circular cylinders (Barkley & Henderson Reference Barkley and Henderson1996), short rectangular cylinders (Blackburn & Sheard Reference Blackburn and Sheard2010; Choi & Yang Reference Choi and Yang2014) and elongated cylinders without vortex shedding from the LE (Ryan et al. Reference Ryan, Thompson and Hourigan2005), this is not an unstable mode of the wake; in fact, its perturbation field develops upstream of the TE, over the cylinder side. This suggests that the scenario for 3-D instabilities valid for short rectangular and circular cylinders and for elongated cylinders with smooth LEs cannot be generalised to every time-periodic flow past 2-D bluff bodies, even when the flow possesses a reflection symmetry with respect to the wake centreline.
The structural sensitivity has shown that the wavemaker of the QS mode is localised over the cylinder side. A detailed inspection of the instantaneous sensitivity has connected the triggering process to the interaction between the two recirculating regions that coexist over the cylinder side before the LE vortex shedding. We have also provided an interpretation of the physical mechanism that triggers this unstable mode: despite some clues, an elliptic instability would be consistent with neither an almost subharmonic mode, nor its absence at lower  ${A{\kern-4pt}R}$, where isolated elliptic-shaped streamlines over the cylinder side still exist. Our conclusion therefore is that this instability is triggered by the mutual inviscid interaction of the two recirculating regions present simultaneously over the cylinder side at a given time. This mechanism, first proposed by Pierrehumbert & Widnall (Reference Pierrehumbert and Widnall1982) and Robinson & Saffman (Reference Robinson and Saffman1982), leads to an unstable, almost subharmonic 3-D mode, and is fully consistent with the present results. The same triggering mechanism is responsible for the transition to three-dimensionality in the flow over a blunt flat plate. In this case, however, the 3-D instability of the Kelvin–Helmholtz vortices shed from the LE is exactly subharmonic (Chaurasia & Thompson Reference Chaurasia and Thompson2011; Huang et al. Reference Huang, Zhou, Tang and Zhang2017), since the base flow does not satisfy the spatio-temporal symmetry.
Funding
This research received no specific grant from any funding agency, or commercial or not-for-profit sectors.
Declaration of interests
The authors report no conflict of interest.
Appendix. Sensitivity of the results to domain size and grid resolution
In this appendix, the dependence of the results on the domain size and grid resolution is addressed. The complete Floquet analysis for  $Re=500$ and
 $k=2.1$ is repeated, by varying the extent of the computational domain and the spatial resolution. In the first case, the size of the domain is increased in the streamwise and cross-stream directions from
 $(L_x,L_y)=(75D,40D)$ up to
 $(L_x,L_y)=(100D,80D)$, while the same grid resolution is adopted. In the second case, the size of the domain is kept constant, but the number of elements is increased by approximately
 $60\,\%$, increasing mainly the resolution near the cylinder and in the wake region. The simulation with increased grid resolution predicts a shedding period within
 $0.19\,\%$ of the value predicted by the coarser grid, while the pair of complex conjugate Floquet multipliers associated with the detected unstable mode varies from
 $(-1.087,\pm 0.000816)$ to
 $(-1.024,\pm 0.000398)$, corresponding to a variation of
 $|\mu |$ within
 $5.5\,\%$. The simulation with the larger computational domain, instead, predicts a shedding period within
 $0.26\,\%$ of the value predicted with the smaller domain, while the unstable Floquet multipliers are
 $(-1.047,\pm 0.000522)$, corresponding to a variation of
 $|\mu |$ within
 $3.7\,\%$. However, the almost subharmonic nature of the unstable mode and the physical mechanism responsible for its onset are well described by all the considered grids.
To consider further the influence of the blockage on the unstable mode, two additional simulations are also carried out by decreasing and increasing the size of the domain in the cross-stream direction from  $L_y=40D$ to
 $L_y=30D$ and
 $L_y=120$; they correspond to a blockage of
 $3.5\,\%$ and
 $0.8\,\%$, respectively. For both cases, the same spatial resolution adopted in the regular grid is used near the cylinder. For the larger and smaller blockages, the predicted shedding period is respectively within
 $0.51\,\%$ and
 $0.08\,\%$ of the value predicted by the regular grid. The Floquet multipliers associated with the unstable mode, instead, are
 $\mu =(-1.035,\pm 0.00050)$ for
 $L_y=40D$, and
 $\mu = (-1.009,\pm 0.000375)$ for
 $L_y=120D$, corresponding to a variation of
 $|\mu |$ that is within
 $4.7\,\%$ and
 $7.1\,\%$ the value predicted by the regular grid.
The dependence of the 3-D simulation on the the grid resolution is addressed by running an additional simulation on a coarser grid with  $N_x=674$,
 $N_y=489$ and
 $N_z=150$. In this case, the frequency associated with the vortex shedding is
 $St \approx 0.965$, while that associated with the 3-D instability is
 $St \approx 0.482$. Compared to the finer grid, this corresponds to a variation of approximately
 $0.4\,\%$ and
 $0.53\,\%$.



