


1 Introduction
There are numerous examples of vortex-embedded wall flows in natural and engineering applications. These three-dimensional layers can occur either desirably, such as for a flow-control strategy (Schoppa & Hussain Reference Schoppa and Hussain1998; Lin Reference Lin2002; Choi, Jeon & Kim Reference Choi, Jeon and Kim2008), or undesirably as a result of faulty wind-tunnel screens (Bradshaw Reference Bradshaw1965; Furuya, Nakamura & Osaka Reference Furuya, Nakamura and Osaka1979; Mehta & Hoffmann Reference Mehta and Hoffmann1987). When a flow is deflected by a solid boundary (e.g. in a curved pipe, in a meandering river or when approaching angled vortex generators), sideward pressure gradients will turn the flow to create axial rotation (Erhard et al. Reference Erhard, Etling, Müller, Riedel, Sreenivasan and Warnatz2010). This inviscid consequence is known as Prandtl’s first kind of secondary flow (Bradshaw Reference Bradshaw1987). Mean streamwise vortices can also form in a straight passage, such as over the corners of rectangular ducts (Hinze Reference Hinze1967). In this case, corner vortices are triggered by a heterogeneous turbulence distribution around the duct edges. Turbulence-induced vortices are known as Prandtl’s secondary flows of the second kind (Bradshaw Reference Bradshaw1987). Lateral heterogeneity of turbulent stresses also occur when the surface topography varies. This phenomenon is significant in river-type flows, since a sandy riverbed can easily be redistributed to form streamwise-elongated ridges, ribbons or roughness strips (Ikeda Reference Ikeda1981; Nezu & Nakagawa Reference Nezu and Nakagawa1984; Colombini Reference Colombini1993; Wang & Cheng Reference Wang and Cheng2006). Mean secondary vortices have also been shown to form over a seemingly irregular topography such as over fouled turbine blades (Barros & Christensen Reference Barros and Christensen2014), where the large-scale variation in roughness topography can result in a laterally heterogeneous turbulence distribution.
A number of studies have investigated the parameters that affect the formation of these secondary flows. Nezu & Nakagawa (Reference Nezu and Nakagawa1984), Vanderwel & Ganapathisubramani (Reference Vanderwel and Ganapathisubramani2015), Yang & Anderson (Reference Yang and Anderson2018) and Chung, Monty & Hutchins (Reference Chung, Monty and Hutchins2018) observed that the extent of the boundary layer modification depends on the lateral spacing of the surface heterogeneity. They concluded that the effect seems to be most pronounced when the spacing is of the order of the boundary layer thickness
 $\unicode[STIX]{x1D6FF}$
. When the spacing is much narrower however, weaker three-dimensionality is observed and the flow heterogeneity is confined closer to the surface. Furthermore, Stroh et al. (Reference Stroh, Hasegawa, Kriegseis and Frohnapfel2016) observed the restructuring of the secondary motions (including their rotational direction) as this spacing changes. Large roughness discrepancy (i.e. one region being very smooth and the other very rough) also results in stronger flow heterogeneity, as demonstrated by the large eddy simulation (LES) study of Willingham et al. (Reference Willingham, Anderson, Christensen and Barros2014). While analysing the similarity between the aforementioned LES results and the flow over irregular turbine roughness (Barros & Christensen Reference Barros and Christensen2014), Anderson et al. (Reference Anderson, Barros, Christensen and Awasthi2015) attributed the occurrence of the mean flow three-dimensionality to the uneven distribution of Reynolds stresses, following the turbulence kinetic energy balance approach of Hinze (Reference Hinze1967).
Large-scale streamwise vortices have also been utilised as a flow-control instrument in wall turbulence for decades. For instance, Schoppa & Hussain (Reference Schoppa and Hussain1998) imposed large secondary flows to the core of turbulent channel flow as a method to reduce skin-friction drag. The vortices were defined/fixed as the mean velocity of the simulation. The simplicity of their concept is very attractive, although the forcing method was recently demonstrated to only produce a transient drag-reducing benefit (Canton et al. Reference Canton, Örlü, Chin, Hutchins, Monty and Schlatter2016). Instead, introducing these vortices via body forcing was proposed to be an alternative forcing method that yields steady drag reduction. Experimentally, Soldati (Reference Soldati2002) employed an electrohydrodynamic mechanism to trigger streamwise vortices, and Iuso et al. (Reference Iuso, Onorato, Spazzini and Di Cicca2002) utilised an array of inclined wall jets. In both cases, drag reduction was observed. Viscous-scaled streamwise vortices can also be triggered at high frequency using plasma actuators (Choi, Jukes & Whalley Reference Choi, Jukes and Whalley2011), to globally lower the mean velocity in the buffer layer.
In separating flows, stronger vortices (typically triggered by vortex generators) can enhance momentum transfer between wall turbulence and the potential flow region (Rao & Kariya Reference Rao and Kariya1988; Lin Reference Lin2002; Godard & Stanislas Reference Godard and Stanislas2006). Introducing kinetic energy from high-momentum fluid to the decelerating flow prevents over-thickening of the layer, hence reducing the likelihood of separation. Mixing due to longitudinal vortices is also beneficial for heat-transfer purposes (Jacobi & Shah Reference Jacobi and Shah1995).
In most of the above studies, the large streamwise vortices are typically discussed in a time-averaged view. Thus, without reference to the associated large-scale turbulent motions, they can sometimes be perceived as a weak mean flow which overrides the background turbulence. In contrast, recent work by Kevin et al. (Reference Monty, Bai, Pathikonda, Nugroho, Barros, Christensen and Hutchins2017) showed a pronounced lateral unsteadiness of the turbulent motions that collectively produced the mean secondary flows. Their analysis however was limited to the cross-stream observation, and understanding the complex three-dimensional flow coherence, which is predominantly streamwise elongated, was not possible in that study.
The aim of the present study is to produce a three-dimensional view and understanding of the ‘unstable’ large turbulent structures, that on average appear as the mean secondary flows above the converging/diverging riblet pattern. This is a further attempt to shed light on the duality between the instantaneous motions and the resulting mean three-dimensionality we observed previously in the cross-stream plane of Kevin et al. (Reference Monty, Bai, Pathikonda, Nugroho, Barros, Christensen and Hutchins2017). By introducing a comprehensive particle image velocimetry (PIV) database covering streamwise domains, we will see how the inclined large coherent structures (Adrian, Meinhart & Tomkins Reference Adrian, Meinhart and Tomkins2000; del Álamo et al. Reference del Álamo, Jiménez, Zandonade and Moser2006) affect and are affected by their interaction with the mean secondary flow. These observations also enable us to draw comparison from other heterogeneous roughness studies, where large modification in turbulence quantities are observed throughout the boundary layer. Here we also provide evidence that the instantaneous streamwise vortices that have given rise to these secondary flows occur not only intermittently in space, but interestingly with a pronounced streamwise periodicity. Further discussion on the roughness-induced coherence and how they are different/similar from the naturally formed large-scale structures is also presented. The hope is that the increasing number of studies of turbulent secondary flows can incorporate these kinematics (and perhaps the inferred dynamics) into their interpretation.
(a) Schematic of the herringbone pattern (not to scale) highlighting the measurement locations of the streamwise/wall-normal planes. (b) Schematic drawing of the current PIV set-ups, showing camera and laser-sheet configurations. (c) Summary of all orthogonal planes which are analysed. Cross-stream plane (dashed line) is from the study of Kevin et al. (Reference Monty, Bai, Pathikonda, Nugroho, Barros, Christensen and Hutchins2017).

2 Experimental set-up
Throughout this paper
 $x$
,
 $y$
and
 $z$
refer to the streamwise, spanwise and wall-normal directions, with
 $u$
,
 $v$
and
 $w$
indicating the respective total velocity components.
2.1 Converging–diverging riblets
Here we use the same converging–diverging riblet surface as investigated by Kevin et al. (Reference Monty, Bai, Pathikonda, Nugroho, Barros, Christensen and Hutchins2017). A schematic of this surface is shown in figure 1(a,c), and readers are referred to Kevin et al. (Reference Monty, Bai, Pathikonda, Nugroho, Barros, Christensen and Hutchins2017) for the full physical surface specifications and its image. Unlike the vast majority of spanwise-varying roughnesses, the role of the C–D riblets is to give/induce a spanwise-varying ‘directionality’ to the flow, i.e. local direction of minimum resistance (Luchini, Manzo & Pozzi Reference Luchini, Manzo and Pozzi1991), which is along the yawed grooves. The yawed ribs themselves will most likely increase the overall surface drag for the height and spacing we use here. It should be noted however, that this study focuses on the large-scale three-dimensionality far above the surface, and does not attempt to resolve near-surface phenomena nor to seek a net drag reduction.
(a,b) Mean streamwise velocity field of
 $xz_{2}$
and
 $xy_{1}$
plane PIV. Solid lines: local boundary layer thickness
 $\unicode[STIX]{x1D6FF}(x,y)$
. Dashed boxes: extent of field of view (FOV) captured by an individual camera. The FOV between cameras is overlapped for at least 12 mm in both streamwise and spanwise directions. Rib lines in (b) are not drawn to scale.

The rib height and spacing are
 $h^{+}=hU_{\unicode[STIX]{x1D70F}s}/\unicode[STIX]{x1D708}\approx 19$
and
 $s^{+}=sU_{\unicode[STIX]{x1D70F}s}/\unicode[STIX]{x1D708}\approx 26$
, yielding a blockage ratio of
 $h/\unicode[STIX]{x1D6FF}_{s}<0.009$
(
 $U_{\unicode[STIX]{x1D70F}s}$
and
 $\unicode[STIX]{x1D6FF}_{s}$
are the friction velocity and boundary layer thickness of the smooth-wall base flow at matched Reynolds number). Figure 1(a) shows a schematic of the C–D pattern highlighting three spanwise locations of interest. The converging


 $\unicode[STIX]{x1D6EC}=2.5\unicode[STIX]{x1D6FF}_{s}$
in the present experiments, while it was
 $1.5\unicode[STIX]{x1D6FF}_{s}$
in Kevin et al. (Reference Monty, Bai, Pathikonda, Nugroho, Barros, Christensen and Hutchins2017). This is due to the different base boundary layer thicknesses between the two studies. The degree of flow heterogeneity has been shown by Nezu & Nakagawa (Reference Nezu and Nakagawa1984), Vanderwel & Ganapathisubramani (Reference Vanderwel and Ganapathisubramani2015), Chung et al. (Reference Chung, Monty and Hutchins2018) to be dependent on the spanwise wavelength
 $\unicode[STIX]{x1D6EC}$
of the surface topography. In the present set-up we also observe different modified boundary layers compared to Kevin et al. (Reference Monty, Bai, Pathikonda, Nugroho, Barros, Christensen and Hutchins2017), due to slight variation in
 $\unicode[STIX]{x1D6EC}/\unicode[STIX]{x1D6FF}$
between studies. However, the bulk flow statistics are comparable, with the maximum strength of mean upwash velocity
 $W_{max}\approx 1.5\,\%U_{\infty }$
for both cases. Additionally, the flow behaviour that we emphasise here are large-scale turbulent features which are prevalent across all datasets.
2.2 Non-simultaneous PIV experiments
The measurements are conducted in an open-return boundary layer wind-tunnel facility in the Walter Basset Aerodynamics Laboratory at the University of Melbourne. This facility has been used in prior boundary layer studies (Perry & Marusic Reference Perry and Marusic1995; Harun et al.
Reference Harun, Monty, Mathis and Marusic2013), and recently for a parametric study of the C–D riblets (Nugroho, Hutchins & Monty Reference Nugroho, Hutchins and Monty2013). Non-simultaneous large field-of-view PIV measurements are taken in three streamwise/vertical planes: over converging (upwash flow – called plane
 $xz_{1}$
), diverging (downwash flow – plane
 $xz_{3}$
) and yawed ribs (lateral cross-flow – plane
 $xz_{2}$
); and in two streamwise–spanwise (wall-parallel) planes: in the logarithmic and outer regions (planes
 $xy_{1}$
and
 $xy_{2}$
respectively). Figure 1(b) displays a schematic of the present set-up. All experiments are conducted at a nominal free-stream velocity of
 $15~\text{m}~\text{s}^{-1}$
and at a streamwise development length of 4 m. All measurements are performed under zero-pressure-gradient conditions. The flows are seeded with polyamide particles with a mean diameter of
 $1~\unicode[STIX]{x03BC}\text{m}$
and illuminated using a dual cavity Big Sky Nd:YAG laser which delivers
 $120~\text{mJ}~\text{pulse}^{-1}$
. As indicated in figure 1(b), a 1 mm thick laser sheet is introduced from the wind-tunnel exit. Since the last optical component is far downstream from the measurement location (over 3 m distance, equating to approximately
 $60\unicode[STIX]{x1D6FF}$
) with minimal blockage, no effects are observed in the turbulence statistics. The illuminated flows are imaged using PCO4000 cameras (
 $4008\times 2672$
, 14-bit frame-straddled CCD, at
 $9~\unicode[STIX]{x03BC}\text{m}$
pixel size), equipped with Sigma 105 mm macro lenses. In the present configurations, the camera resolutions are 51 and
 $44~\unicode[STIX]{x03BC}\text{m}~\text{px}^{-1}$
for the vertical and wall-parallel measurements respectively. Figure 1(c) summarises the orthogonal PIV slices that will be considered in this paper. An acquisition rate of 1 Hz (per velocity realisation) is employed to ensure statistical independence, which is equivalent to approximately 260 boundary layer turnover times between consecutive snapshots. The time separation between particle-image pairs (or the laser pulse) itself is
 ${\sim}60~\unicode[STIX]{x03BC}\text{s}$
, or approximately 1.2 viscous time scales.
Validation of velocity statistics for the smooth-wall base case at
 $Re_{\unicode[STIX]{x1D70F}}=2050$
. (a) Mean velocity, streamwise Reynolds stress and Reynolds shear stress. (b) Spanwise and wall-normal Reynolds stresses. Circles:
 $xz$
-plane PIV data (down sampled to 30 logarithmically spaced wall locations); squares:
 $xy$
-plane PIV data. Open symbols: statistics corrected using the method proposed by Lee, Kevin & Hutchins (Reference Lee, Monty and Hutchins2016); closed symbols: original attenuated Reynolds stresses. Solid lines show reference profiles from Sillero, Jiménez & Moser (Reference Sillero, Jiménez and Moser2013).

For the
 $xz$
-plane measurements, three cameras are used to capture a total of
 $0.52\times 0.11$
m streamwise/wall-normal domain, which corresponds to approximately
 $9.1\times 2.0$
 $\unicode[STIX]{x1D6FF}_{s}$
. Here
 $\unicode[STIX]{x1D6FF}$
corresponds to the wall distance where the mean streamwise velocity reaches 99 % of the free-stream velocity. The resulting field of view for plane
 $xz_{2}$
is illustrated in figure 2(a). The obtained images are processed using an in-house PIV package previously used by Chauhan et al. (Reference Chauhan, Philip, de Silva, Hutchins and Marusic2014), Kevin et al. (Reference Monty, Bai, Pathikonda, Nugroho, Barros, Christensen and Hutchins2017), de Silva et al. (Reference de Silva, Baidya, Hutchins and Marusic2018) among others. A final interrogation window size of
 $24\times 24$
pixels with 50 % overlap is employed. This will result in a velocity vector spacing of approximately 0.55 mm (or 20 viscous units) in both in-plane directions. Together with the laser-sheet thickness, the spatial resolution in viscous units is
 $\unicode[STIX]{x0394}x^{+}\times \unicode[STIX]{x0394}y^{+}\times \unicode[STIX]{x0394}z^{+}\approx 41\times 36\times 41$
for the smooth-wall base case. For the wall-parallel
 $xy$
-plane measurements, five cameras are used to capture a total of
 $0.52\times 0.20~\text{m}$
of the streamwise/spanwise domain, which corresponds to approximately
 $9.1\times 3.5$
 $\unicode[STIX]{x1D6FF}_{s}$
. The resulting FOV is represented in figure 2(b) for plane
 $xy_{1}$
. Note that the camera labelled C
 $_{1}$
is equipped with a Nikon 60 mm lens, hence yields a slightly reduced pixel resolution of
 $70~\unicode[STIX]{x03BC}\text{m}~\text{px}^{-1}$
. To compensate for this, C
 $_{1}$
is processed using an interrogation window size of
 $16\times 16$
pixels, which is smaller than that for C
 $_{2-5}$
. Together with the laser-sheet thickness, the spatial resolution in viscous units is
 $\unicode[STIX]{x0394}x^{+}\times \unicode[STIX]{x0394}y^{+}\times \unicode[STIX]{x0394}z^{+}\approx 54\times 54\times 36$
for the smooth-wall base case. Experimental and boundary layer parameters for all measurements are summarised in table 1. Three thousand instantaneous velocity realisations are taken for the riblets case and 2500 for the smooth-wall case. Flow statistics for the smooth-wall experiments are validated in figure 3, where the data points shown are down sampled to 30 wall-normal locations spaced logarithmically. The Reynolds stresses shown by the open symbols have been corrected using a method by Lee et al. (Reference Lee, Monty and Hutchins2016) to compensate for the spatial attenuation due to the volume averaging inherent in PIV interrogation, and the closed symbol shows the original attenuated PIV statistics. Overlaid are reference direct numerical simulation (DNS) statistics of Sillero et al. (Reference Sillero, Jiménez and Moser2013) at a comparable Reynolds number, where good collapse is observed between the statistics from the present measurements and the reference. The spatial statistics are also validated by comparing the two-point correlation function
 $R_{u^{\prime }u^{\prime }}$
with the profiles of Sillero, Jiménez & Moser (Reference Sillero, Jiménez and Moser2014) in figure 4. The results for both PIV orientations show good agreement with the DNS data.
Validation of two-point correlation function of streamwise velocity of the smooth-wall base case measurements at
 $z_{ref}/\unicode[STIX]{x1D6FF}=0.1$
along the (a) streamwise and (b) spanwise directions. ○:
 $xz$
-plane statistics; ▫:
 $xy$
-plane statistics; solid lines: reference profiles from Sillero et al. (Reference Sillero, Jiménez and Moser2014). Not all PIV data points are shown for clarity.

Experimental parameters of the
 $xz$
and
 $xy$
PIV experiments.

a These quantities are local properties over the C–D surface.
b
These quantities are spanwise averaged across one converging–diverging wavelength
 $\unicode[STIX]{x1D6EC}$
.
Instantaneous total streamwise velocity over the C–D riblets. (a) In the cross-flow plane, reproduced from Kevin et al. (Reference Monty, Bai, Pathikonda, Nugroho, Barros, Christensen and Hutchins2017). Solid lines: wall heights of the corresponding horizontal planes. (b,c) In wall-parallel planes at
 $z/\unicode[STIX]{x1D6FF}_{s}=0.1$
and 0.5 respectively. A long contour of
 $u=0.6U_{\infty }$
(Gaussian filtered at
 $0.05\times 0.05\unicode[STIX]{x1D6FF}$
with
 $\unicode[STIX]{x1D70E}=2$
) is drawn in (b). Note that these planes are acquired non-simultaneously.

3 Instantaneous velocity fields
Figure 5 displays representative examples of instantaneous streamwise velocity fields over C–D riblets, taken at separate instants in time. The cross-stream example shown in figure 5(a) is reproduced from Kevin et al. (Reference Monty, Bai, Pathikonda, Nugroho, Barros, Christensen and Hutchins2017) and is included here to show the typical ejections of low-momentum fluid over converging (upwash-flow) regions. The horizontal lines drawn in this figure indicate the height of the available
 $xy$
PIV fields above the surface. Observation in the
 $xy_{1}$
(logarithmic region) plane reveals continuous appearance of low-momentum regions occurring above the converging lines, which will appear as energy in infinite-wavelength modes. One of these large-scale low-momentum structures is highlighted by the
 $u=0.6U_{\infty }$
contour shown by the solid black contour line. Qualitatively at least, these large streaks share certain characteristics with those which homogeneously occur within smooth-wall flows, such as breaking, branching and meandering (Tomkins & Adrian Reference Tomkins and Adrian2003; Hutchins & Marusic Reference Hutchins and Marusic2007; Lee et al.
Reference Lee, Lee, Choi and Sung2014, etc.). In the outer layer, however, Kevin et al. (Reference Monty, Bai, Pathikonda, Nugroho, Barros, Christensen and Hutchins2017) noted from their cross-plane PIV that the low-momentum eruptions often appear to lean in the spanwise direction (which is the case for the snapshot shown in figure 5
a). This motion was also associated with asymmetries of the large-scale instantaneous streamwise rollers which give rise to the mean secondary flow. The
 $xy_{2}$
example in figure 5(c) at
 $z/\unicode[STIX]{x1D6FF}_{s}=0.5$
shows how this outer-layer unstable motion manifests horizontally, namely in a severely meandering behaviour. We suspect that this aggressive behaviour is due to the large separation distance between the streaks (forced by the C–D wavelength
 $\unicode[STIX]{x1D6EC}/\unicode[STIX]{x1D6FF}_{s}=2.5$
), which allows the largest turbulent motions to be affected. In the smooth-wall layer the spanwise spacing between adjacent low-momentum structures varies approximately from
 $0.5{-}1\unicode[STIX]{x1D6FF}$
for wall height
 $z/\unicode[STIX]{x1D6FF}<0.5$
. This can be inferred from the distance between the two minima in figure 4(b). This behaviour concurs with why larger (spanwise) spacing of topographical variation produces stronger and larger three-dimensionality with greater large-scale fluctuations and increased
 $C_{f}$
. Overall, this horizontal observation highlights our previous impression that secondary vortices, at least over the C–D riblets, are not a time-steady flow feature, and seem to be instantaneously associated with large meandering coherence.
(a–c) Contours of instantaneous negative Reynolds-averaged streamwise velocity fluctuation over the
 $xz_{1}$
,
 $xz_{2}$
,
 $xz_{3}$
planes respectively. Solid lines show the local boundary layer thickness
 $\unicode[STIX]{x1D6FF}$
. Dotted line in (b) shows the height of the centre of mean streamwise vortices; symbols in (b) show the direction of mean lateral flow.

The effect of velocity-decomposition selection (i.e. temporal or spatio-temporal decompositions) to a heterogeneous flow field was discussed by Kevin et al. (Reference Monty, Bai, Pathikonda, Nugroho, Barros, Christensen and Hutchins2017). This selection will influence the appearance of the instantaneous fluctuations as well as both the velocity and spatial statistics. In this paper we will only consider the Reynolds-decomposed fluctuation
 $u_{i}^{\prime }$
(by subtracting the local mean velocity from the total velocity), to analyse how the convecting turbulence appears in a highly three-dimensional flow. Note that this process will remove the underlying mean heterogeneity, enabling us to compare the remaining temporal fluctuation against the typical smooth-wall quantities. Figure 6(a–c) shows examples of streamwise Reynolds fluctuation over
 $xz_{1-3}$
planes respectively. Clearly the flow fields exhibit quite different turbulent features, despite all being measured within
 ${\sim}1.2\unicode[STIX]{x1D6FF}_{s}$
of spanwise separation. The largest/smallest velocity coherence occurs over the upwash/downwash regions, as indicated by their local boundary layer thickness (shown by the solid grey lines). It is tempting to argue that the heterogeneity in the physical size is simply due to the spanwise variation in the outer local length scale. If the field of views are scaled with their local
 $\unicode[STIX]{x1D6FF}(y)$
, the streamwise domain will yield 5.8, 6.6 and 9.5
 $\unicode[STIX]{x1D6FF}$
for (a–c). However, as later supported by spatial statistics, these regions exhibit different characteristic shapes and flow features, which indicates that local length scale alone is insufficient to explain the observed differences.
One interesting feature emerges when one carefully examining the velocity snapshots over the
 $xz_{2}$
plane (half-way slice between upwash and downwash regions) such as in figure 6(b). Large detached negative fluctuations often appear in the outer region above
 $z/\unicode[STIX]{x1D6FF}_{s}=0.42$
, shown by the dashed line in figure 6(b) and corresponding to the centre of the mean streamwise secondary flow vortices (Nugroho et al.
Reference Nugroho, Gnanamanickam, Kevin, Monty and Hutchins2014). Below/above
 $0.42\unicode[STIX]{x1D6FF}_{s}$
the spanwise flow is either into or out of the page, and the transported turbulence originates from the adjacent downwash/upwash region respectively. Hence, we can propose that these detached features are the signatures of the curled instantaneous low-momentum zones, as seen in figure 5(a), which are sliced by the
 $xz_{2}$
plane. The observed change in behaviour at
 $z/\unicode[STIX]{x1D6FF}_{s}=0.42$
also appears in the velocity statistics. Figure 7 compares the Reynolds shear stress profiles of the
 $xz_{2}$
plane and the smooth-wall base case. For the riblet surface, two distinct peaks emerge in the profile over the
 $xz_{2}$
plane, with the centre of the mean roll modes (here at
 $z/\unicode[STIX]{x1D6FF}_{s}=0.42$
) approximately separating the lower and upper flow regimes. We propose that the reduced/increased Reynolds stress regions result from lateral transport of locally reduced/increased turbulence from the diverging/converging regions by the secondary roll modes. Readers can refer to Kevin et al. (Reference Monty, Bai, Pathikonda, Nugroho, Barros, Christensen and Hutchins2017) for cross-stream contour maps of all Reynolds stress distributions over the C–D riblets.
We also surmise that a similar redistribution of turbulence occurs in other spanwise-heterogeneous flows due to transport from the embedded vortical structures. It is also noteworthy that such large vortical structures occur in a transient sense in canonical layers, hence instantaneously, we may expect to see similar transport phenomena associated with these features. Further studies in canonical layers would be required to confirm this.
Reynolds shear stress profiles over the yawed ribs
 $(\times )$
and smooth-wall comparison (○). Data are down sampled for clarity.

4 Spatial statistics
In this section we quantify the spatial coherence by inspecting the two-point correlation functions of the Reynolds fluctuations. Note that both spanwise and wall-normal directions are non-homogeneous, but the streamwise direction is assumed to be homogeneous within the measurement domain. Therefore, at a given horizontal plane, the correlation coefficient
 $R_{a^{\prime }b^{\prime }}$
is defined as,
 $$\begin{eqnarray}R_{a^{\prime }b^{\prime }}(y_{ref})=\frac{\overline{a^{\prime }(x,y_{ref})~~b^{\prime }(x+\unicode[STIX]{x0394}x,y)}}{\unicode[STIX]{x1D70E}_{a}(y_{ref})~~\unicode[STIX]{x1D70E}_{b}(y)},\end{eqnarray}$$
where
 $y_{ref}$
is the reference spanwise location at which the correlation is computed, and
 $\unicode[STIX]{x0394}x$
is the streamwise separation between fluctuations
 $a^{\prime }$
and
 $b^{\prime }$
. Here
 $\unicode[STIX]{x1D70E}$
denotes the standard deviation of each signal. Note that for streamwise-vertical planes,
 $y$
and
 $y_{ref}$
in (4.1) will become
 $z$
and
 $z_{ref}$
. For the cross-stream plane however, since both directions are non-homogeneous,
 $R_{a^{\prime }b^{\prime }}$
is defined as,
 $$\begin{eqnarray}R_{a^{\prime }b^{\prime }}(y_{ref},z_{ref})=\frac{\overline{a^{\prime }(y_{ref},z_{ref})~~b^{\prime }(y,z)}}{\unicode[STIX]{x1D70E}_{a}(y_{ref},z_{ref})~~\unicode[STIX]{x1D70E}_{b}(y,z)}.\end{eqnarray}$$
In the following, we highlight the physical differences in the flow structure between the smooth wall and three-dimensional flow. We take a fixed reference height
 $z_{ref}/\unicode[STIX]{x1D6FF}_{s}$
, which represents the same physical distance above the surface, and also normalise the resulting correlation length scales using
 $\unicode[STIX]{x1D6FF}_{s}$
. Note that in most studies
 $z_{ref}$
is taken at a constant non-dimensionalised height, while the correlation size is scaled by the local boundary layer thickness
 $\unicode[STIX]{x1D6FF}(y)$
. However, in this case it is not sensible for us to normalise the length scale using local
 $\unicode[STIX]{x1D6FF}(y)$
, since the layer thickness varies greatly with spanwise location. For example, we will later show in § 4.1 that large coherent structures are persistently yawed/misaligned with the streamwise axis. Normalising with local
 $\unicode[STIX]{x1D6FF}$
would mean that we scale the ‘head’ and ‘tail’ of the same structure using different length scales.
4.1 Velocity coherence in the logarithmic region
Contour maps of streamwise correlation coefficients
 $R_{u^{\prime }u^{\prime }}$
in the
 $xz$
-planes are displayed in figure 8, where they are computed about a reference height of
 $z/\unicode[STIX]{x1D6FF}_{s}=0.1$
, or
 $z/\langle \unicode[STIX]{x1D6FF}\rangle _{\unicode[STIX]{x1D6EC}}=0.08$
, where
 $\langle \unicode[STIX]{x1D6FF}\rangle _{\unicode[STIX]{x1D6EC}}$
is the boundary layer thickness averaged across the C–D spanwise wavelength
 $\unicode[STIX]{x1D6EC}$
. Smooth-wall contours are also plotted at levels of 0.05 and 0.3 in grey shades to highlight the changes in lower and higher correlation values. Similar to observations in two-dimensional flows over smooth walls (Christensen Reference Christensen2001; Hutchins & Marusic Reference Hutchins and Marusic2007; Sillero et al.
Reference Sillero, Jiménez and Moser2014, among others), all
 $R_{u^{\prime }u^{\prime }}$
maps of the modified flow feature inclined and streamwise-elongated coherent structures. In general, for the C–D riblet surface, both high and low correlation contours are physically shorter in the streamwise direction compared to the smooth-wall case, especially for lower
 $R_{u^{\prime }u^{\prime }}$
values (i.e. for larger coherence). The shortening of streamwise-velocity coherence is typical in flows with perturbed surfaces. Wu & Christensen (Reference Wu and Christensen2010) suggested several explanations for this, one of which is the reduction in streamwise spacing of consecutive vortices in the vortex packets. Flores, Jiménez & del Álamo (Reference Flores, Jiménez and del Álamo2007) on the other hand, suggested that lower mean shear over the perturbed surface leads to shorter low-momentum coherence. For larger roughness elements, Guala et al. (Reference Guala, Tomkins, Christensen and Adrian2012) concluded that the wake behind the object may have altered the natural streamwise coherence.
Maps of
 $R_{u^{\prime }u^{\prime }}$
in streamwise/vertical planes about
 $z_{ref}/\unicode[STIX]{x1D6FF}_{s}=0.1$
, over (a–c)
 $xz_{1-3}$
respectively. Positive levels (solid lines) are 0.05, 0.15, 0.3; negative level (dashed line) is
 $-0.03$
. Grey shades: smooth-wall contour levels of 0.05, 0.3. Solid diagonal: inclination of the structure over
 $xz_{1-3}$
regions. Dot-dashed diagonal: inclination of the smooth-wall reference structure. Annotation NR indicates the negative region referred to in the text.

A comparison of the contour shapes in figure 8(a–c) also reveals different flow characteristics depending on spanwise location over the C–D surface. The inclination angle of the average structures for example (as illustrated by comparing each solid diagonal line with the smooth-wall dot-dashed reference), is steeper for the
 $xz_{3}$
plane compared to the
 $xz_{1}$
, due to its shorter aspect ratio. Note that here the inclination angle is computed from the linear fit through a locus of the maxima in
 $R_{u^{\prime }u^{\prime }}$
at each streamwise location, and only taken when the peak
 $R_{u^{\prime }u^{\prime }}$
value is larger than 0.05. Certainly, the streamwise extent of the large-scale coherence is much smaller for
 $xz_{3}$
(the diverging region shown in figure 8
c), than over the converging plane (
 $xz_{1}$
, see figure 8
a). The most interesting feature however, occurs in the
 $xz_{2}$
plane over the yawed ribs. As shown by figure 8(b), the downstream ‘head’ of the inclined structure is curtailed when compared with the smooth-wall grey shaded contours, and a negatively correlated region (shown by the dashed contour and labelled ‘NR’) emerges in the outer layer. To give a better sense of the actual three-dimensional coherence; figure 9(a) displays the corresponding cross-stream correlation map
 $R_{u^{\prime }u^{\prime }}$
above the yawed region. The contours show a pronounced leaning average coherence, flanked by non-symmetrical anti-correlated regions. This picture suggests that the disappearance of the ‘head’ in the downstream
 $R_{u^{\prime }u^{\prime }}$
contour in figure 8(b) is because the upper part of this structure persistently exists at a different spanwise position (it has leant out of the
 $xz_{2}$
plane). Accordingly, we can also deduce that the taller negative contours on the positive
 $\unicode[STIX]{x0394}y$
side of the cross-stream map of figure 9(a), which are labelled ‘NR’, enter figure 8(b) at some downstream distance. This motion is also accompanied by statistically non-symmetrical vortical structures, as displayed by the
 $R_{u^{\prime }v^{\prime }}$
and
 $R_{u^{\prime }w^{\prime }}$
vectors shown in figure 9(b). Note that the
 $R_{u^{\prime }v^{\prime }}$
quantity can be interpreted as the event
 $v^{\prime }$
, for a given
 $u^{\prime }$
event. Hence, this stochastic estimation is analogous to a conditionally averaged
 $v^{\prime }$
structure, based on a particular
 $u^{\prime }$
event. The same description goes for
 $R_{u^{\prime }w^{\prime }}$
. The corresponding
 $R_{u^{\prime }u^{\prime }}$
map in the wall-parallel plane over the yawed region is displayed in figure 9(c). From this view, we notice that the positive contours are slightly yawed from the streamwise axis as indicated by the diagonal line. At first, the orientation may seem counter-intuitive since it opposes the direction of the yawed ribs. However, this averaged picture concurs with the cross-stream observation which is: the taller part of the structure (i.e. downstream) leans towards the downwash-flow region
 $xz_{3}$
.
(a) Contours of
 $R_{u^{\prime }u^{\prime }}$
in the
 $yz$
plane, referenced at
 $z_{ref}/\unicode[STIX]{x1D6FF}_{s}=0.1$
over the yawed ribs. This correlation map is computed from the stereoscopic dataset of Kevin et al. (Reference Monty, Bai, Pathikonda, Nugroho, Barros, Christensen and Hutchins2017). Positive levels (solid lines) are 0.05, 0.15, 0.3; negative levels (dashed line) are
 $-0.05,-0.1$
. (b) Vectors of
 $R_{u^{\prime }v^{\prime }}$
and
 $R_{u^{\prime }w^{\prime }}$
. (c) Contours of
 $R_{u^{\prime }u^{\prime }}$
in
 $xy_{1}$
plane. Annotation ‘NR’ indicates the negative region referred to in the text.

This overall kinematics can be better described using the schematic drawn in figure 10. Here the large turbulence structure is portrayed to be slightly inclined/angled from both the
 $x$
and
 $z$
axes, as suggested by the
 $R_{u^{\prime }u^{\prime }}$
correlation results in the
 $xy$
and
 $yz$
planes (shown in figures 9(a) and 9(c) respectively). The series of lateral arrow annotations indicate the spanwise sign of the mean roll modes
 $\pm V$
near to and away from the surface. Notice that, due to the its forward inclination/ramping (Adrian et al.
Reference Adrian, Meinhart and Tomkins2000; del Álamo et al.
Reference del Álamo, Jiménez, Zandonade and Moser2006), the lateral velocities
 $\pm V$
are not equally distributed across the structure. The taller downstream head will mostly experience
 $-V$
, while the lower upstream tail will experience a
 $+V$
from the time-averaged secondary flow. This is further illustrated by the symbols over the
 $R_{u^{\prime }u^{\prime }}=0.05$
contour in the
 $xz_{2}$
plane inset. This uneven distribution (
 $-V$
at the downstream end and
 $+V$
at the upstream) thus manifests as a net torque as indicated by the rotational sign above the structure, as well as the leaning behaviour observed by Kevin et al. (Reference Monty, Bai, Pathikonda, Nugroho, Barros, Christensen and Hutchins2017) in the cross-stream plane.
Schematic of an inclined low-speed structure over the yawed part of the C–D surface. Series of arrow annotations indicate the mean lateral velocities or the secondary flows, near (
 $+V$
) and away (
 $-V$
) from the surface. The
 $xz_{2}$
plane projects the
 $R_{u^{\prime }u^{\prime }}=0.05$
previously shown in figure 8(b), with symbols also indicating the direction of lateral mean velocity
 $V$
. Rotational sign: the rotational direction (about the vertical axis) experienced by this structure.

To deduce the possible dynamics of this large-scale behaviour, we firstly need to realise that the rib dimensions are small (
 $h/\unicode[STIX]{x1D6FF}<1\,\%$
), and their direct effects on the flow are restricted only to regions immediately above the surface. This is by means of imposing directional resistance to the flow (Luchini et al.
Reference Luchini, Manzo and Pozzi1991). However, on the line of convergence of the rib pattern, the spanwise flows over the yawed riblets meet each other and are redirected upwards, creating the large-scale ejections depicted in figure 5(a). These vertical ejections and the resultant large-scale secondary flows lead to lateral momentum transfer away from the converging section (far from the surface), as depicted by the
 $-V$
arrows in figure 10. This large-scale motion overrides any near-wall effects due to the yawed riblets, and causes the structure in figure 10 to yaw to the right, opposing the rib direction underneath it. Therefore, one can consider that the misalignment direction of the large structures in the present case is not strictly a direct effect of the yawed ribbed surface, but is due to the presence of the overall secondary flows. In other words, we would expect to see similar yawed behaviour of large-scale structures in any flow with embedded large-scale streamwise vortices. Indeed, the streamwise-misaligned behaviour in the
 $R_{u^{\prime }u^{\prime }}$
correlation map, as well as the asymmetry in the flanking anti-correlated regions, are also observable in other three-dimensional boundary layer datasets over various surfaces. A few of examples are in the boundary layer developed over the spanwise-heterogeneous roughness (Bai et al.
Reference Bai, Kevin, Hutchins and Monty2018), and over a smooth-wall boundary layer developed downstream of vortex-generator devices (Baidya et al.
Reference Baidya, de Silva, Huang, Castillo, Marusic and Hutchins2016). The large multi-plane FOVs captured in the present measurements have offered a more detailed illustration of this prevalent behaviour, and further observation in the outer layer will be presented in the § 4.2.
(a–c) Maps of
 $R_{u^{\prime }u^{\prime }}$
in streamwise/vertical planes with
 $z_{ref}/\unicode[STIX]{x1D6FF}_{s}=0.5$
, for the
 $xz_{1-3}$
planes respectively. Positive levels (solid lines) are 0.05, 0.15, 0.3; negative levels (dashed lines) are
 $-0.025,-0.05$
. Grey shaded contours: smooth-wall contour levels of 0.05, 0.3.
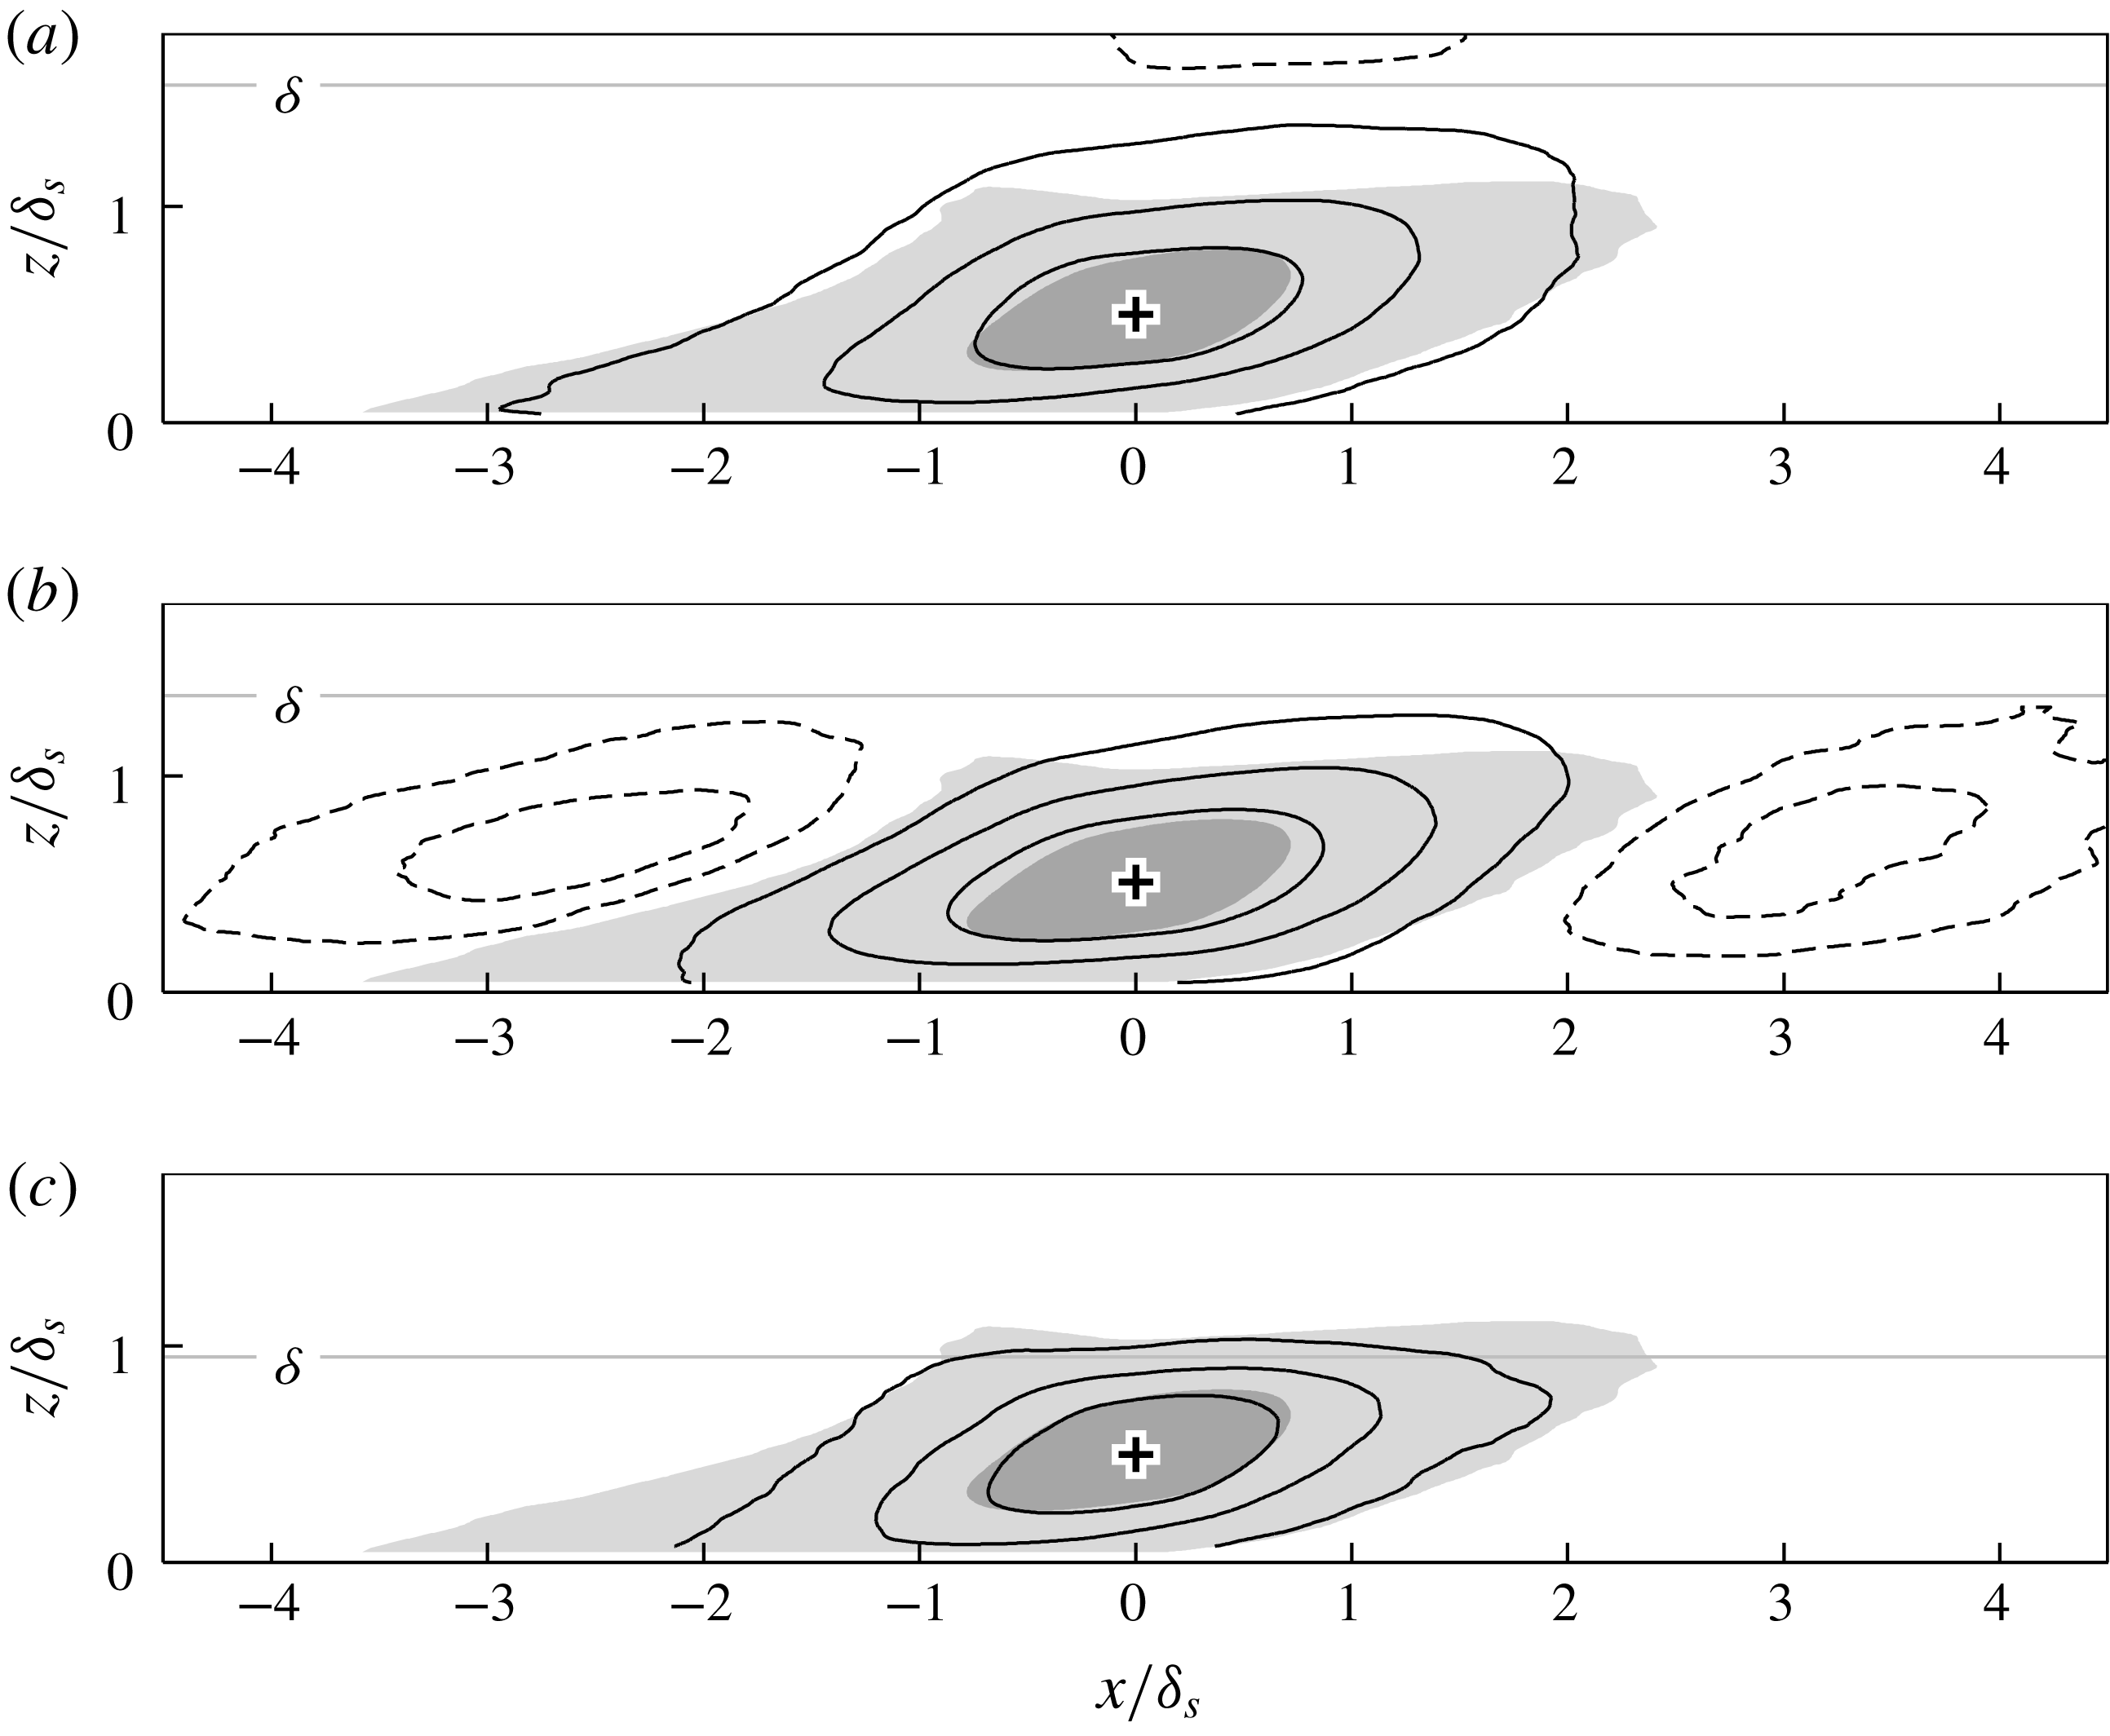
4.2 Velocity coherence in the outer layer
Since the outer-layer structures exhibit a lateral unstable tendency (as evidenced anecdotally in figure 5 c), it will be interesting to see how this behaviour manifests statistically. Additionally, it is well known that outer-layer structures between smooth and rough surfaces show excellent qualitative agreement (Volino, Schultz & Flack Reference Volino, Schultz and Flack2007, Reference Volino, Schultz and Flack2011; Squire et al. Reference Squire, Morril-Winter, Hutchins, Marusic, Schultz and Klewicki2016), which concurs with Townsend’s Reynolds number similarity hypothesis (Townsend Reference Townsend1976). The exception in this regards are the continuous spanwise-aligned rods of Krogstadt & Antonia (Reference Krogstadt and Antonia1999) and the spanwise-aligned bars of Volino, Schultz & Flack (Reference Volino, Schultz and Flack2009). In those cases of continuous spanwise elements, the near-wall flow is forced upwards over the roughness elements leading to strong local ejections. This leads to roughness effects that penetrate further into the outer layer. To a certain degree, the mechanism we observe here is analogous to the above situation, i.e. we have continuous yawed grooves. However, here the resulting ejections occur along lines in the streamwise direction (i.e. over the converging region), instead of uniformly occurring along the spanwise direction, as is for the case for spanwise bars/rods. For the converging–diverging riblets, these ejections aligned along the converging regions set up large-scale secondary flows, and as a result, the roughness sublayer (the part of the flow that feels the effects of the roughness topography) essentially extends to the edge of the layer, and no outer-layer similarity can occur.
Figure 11 displays
 $R_{u^{\prime }u^{\prime }}$
maps for the
 $xz_{1-3}$
planes with
 $z_{ref}/\unicode[STIX]{x1D6FF}_{s}=0.5$
(equivalent to 60 roughness heights away from the surface), clearly showing signs of this three-dimensionality. In general, contours of
 $R_{u^{\prime }u^{\prime }}>0.3$
seem comparable between plots, but larger coherence is distinctively different. This in part can be explained by the spanwise variation in the local boundary layer thickness between the three planes. For instance, the flat upper contours in the
 $xz_{3}$
map are due to the proximity to the free-stream flow, reflected in the reduced local boundary layer thickness over the diverging region. The most intriguing observation, however, is the large streamwise-repeating pattern in the
 $xz_{2}$
plane of figure 11(b), which has a streamwise distance (between minima) of approximately
 $5.6\unicode[STIX]{x1D6FF}_{s}$
or
 $4.6\langle \unicode[STIX]{x1D6FF}\rangle _{\unicode[STIX]{x1D6EC}}$
. This pattern does not appear in the smooth-wall correlation, or in the
 $xz_{1}$
and
 $xz_{3}$
planes (which are only
 $0.65\unicode[STIX]{x1D6FF}_{s}$
away in the spanwise direction). As discussed in § 3, we surmise that these regions of detached coherence arise from the leaning ejections over the converging riblets. Figure 11(b) shows that this behaviour exhibits some degree of streamwise periodicity. Figure 12 shows the corresponding wall-parallel slice of the correlation map over the yawed riblets at
 $z_{ref}/\unicode[STIX]{x1D6FF}_{s}=0.5$
. Here, the streamwise-repeating pattern is also clearly apparent, with the stronger anti-correlated region flanking in the positive
 $y$
direction (as previously suggested by the correlation map in figure 9(a) at the wall-normal location of
 $z/\unicode[STIX]{x1D6FF}_{s}=0.5$
). All of these observations are consistent with a low-momentum region meandering about the converging region, with an apparent streamwise wavelength of approximately
 $5.6\unicode[STIX]{x1D6FF}_{s}$
. As a side note, when we take a reference correlation point
 $y_{ref}$
closer to the
 $xz_{1}$
/converging region, the repeating pattern becomes less apparent (and eventually disappears altogether when
 $y_{ref}/\unicode[STIX]{x1D6EC}=0.5$
). This is due to the cancellation from the opposite-signed pattern, coming from the opposing yawed region (i.e.
 $y/\unicode[STIX]{x1D6EC}=0.75$
). Hence, the average structure will appear more similar to the more well-known smooth-wall coherence.
Maps of
 $R_{u^{\prime }u^{\prime }}$
in
 $xy_{2}$
plane (
 $z_{ref}/\unicode[STIX]{x1D6FF}_{s}=0.5$
), over the yawed riblets. Positive levels (solid lines) are 0.025, 0.05, 0.15, 0.3; negative level (dashed line) are
 $-0.025,-0.05,-0.1$
. Shaded region illustrates the association of the alternating pattern with the highly meandering structure.

To some degree, this outer-layer alternating behaviour is similar to that observed by Elsinga et al. (Reference Elsinga, Adrian, Oudheusden and Van Scarano2010), where the pattern became more apparent in their filtered velocity fields. They suggested that larger vortex organisation is responsible for this behaviour, and provide a conceptual sketch of this (figure 16 in their publication). In their proposed interpretation, outer-layer structures ride over two adjacent log region structures in an alternating manner, giving rise to a diagonal-like pattern in the (filtered) swirling–strength correlation. For the present case however, this outer-layer pattern arises from the fact that tall low-momentum regions turn laterally in the outer layer, manifesting as an aggressive meandering of low-momentum large-scale streaks in the wake region. In other words, the elongated log region streak over the converging region will meander, causing the alternating pattern to appear in correlations computed just to the side of this region (here over the yawed ribs). Additionally, we have shown from stochastic estimation that this streamwise-misaligned behaviour is accompanied by non-symmetrical streamwise vortex structures (figure 9(b) – see also Kevin et al. (Reference Monty, Bai, Pathikonda, Nugroho, Barros, Christensen and Hutchins2017)), while for the case of Elsinga et al. (Reference Elsinga, Adrian, Oudheusden and Van Scarano2010) symmetrical hairpin-type vortices were inferred.
(a) Grey shaded areas: contours of filtered velocity
 $u<0.85U_{\infty }$
. Thin line: mean spanwise location, or the spine, of the grey region for each
 $x$
grid (here plotted only for the largest grey area). Thick line: the smoothened spine contour, showing the minimum
 $y$
location in the contour taken as a reference averaging point. (b) Conditional average of turbulent fluctuation about the reference point shown in (a). Solid/dashed contour shows
 $\overline{u^{\prime }}_{cond}=\pm 0.1U_{\unicode[STIX]{x1D70F}s}$
. (c) The conditional vector fields
 $\overline{u^{\prime }}_{cond},\overline{v^{\prime }}_{cond}$
. Vector spacing are down sampled by 10 for clarity.

To further relate the above observation to the aggressive meandering of the low-speed event in the outer layer, we perform a brief conditional-averaging analysis on the retarded flow structure. The grey shaded areas in figure 13(a) show the streamwise velocity regions
 $u_{f}<85\,\%U_{\infty }$
, after the flow field is low-pass filtered. To do that, the original velocity matrix is convolved with a smaller matrix of Gaussian distribution (with a kernel size equivalent to
 $0.25\times 0.25\unicode[STIX]{x1D6FF}_{s}$
and
 $\unicode[STIX]{x1D70E}=2$
). Hence, turbulence fluctuation smaller than this filter size will be removed. The ‘spine’ of each binary structure is then found by taking the mean spanwise location of each connected region at every
 $x$
grid. The location of this spine is shown by the thin fluctuating line along the structure. We then further smooth this spine location using a
 $1\unicode[STIX]{x1D6FF}_{s}$
one-dimensional Gaussian kernel of 1
 $\unicode[STIX]{x1D6FF}_{s}$
and
 $\unicode[STIX]{x1D70E}=2$
(shown by the thick black line in figure 13
a), and use the smoothed location to obtain the minimum spanwise position of this large-scale meandering behaviour. Note that we only consider the longer spines which extend for more than
 $3\unicode[STIX]{x1D6FF}_{s}$
in the streamwise direction. Accordingly, conditionally averaged events are conditioned on the spanwise minima of this meandering spine. This condition location is illustrated in figure 13(a) by the
 $+$
symbol and the annotation ‘reference point’. The conditionally averaged flow field with respect to this minimum
 $y$
position is shown in figure 13(b), where the solid and dashed contours indicate the conditional mean
 $\overline{u^{\prime }}_{cond}=\pm 0.1U_{\unicode[STIX]{x1D70F}s}$
respectively. This result complements the correlation map shown figure 12, further highlighting a dominant meandering behaviour with an average wavelength of approximately
 $6\unicode[STIX]{x1D6FF}_{s}$
. The corresponding averaged vector field
 $\overline{u^{\prime }}_{cond},\overline{v^{\prime }}_{cond}$
is shown in figure 13(c), clearly showing the one-sided wall-normal vortex structure associated with this outer-layer meandering. Note that changing the filter size and the velocity threshold used throughout this process (even by
 $\pm 50\,\%$
) has a negligible effect on this dominant instantaneous large-scale behaviour.
The merit of analysing large low-momentum streaks in spanwise-heterogeneous flow is that their position is fixed in space, compared to the random distribution occurring in the spanwise-homogeneous boundary layers. At present, our closest description of these kinematics is provided by the low-speed streak model in the buffer layer as suggested by Jeong et al. (Reference Jeong, Hussain, Schoppa and Kim1997) (figure 10 in their publication), only in this instance we observe similar features in the logarithmic and outer layer, and at much larger scale. In that model, the wavy low-speed streak is flanked by streamwise-alternating positive and negative asymmetrical vortex tubes (further shown by Schlatter et al. Reference Schlatter, Li, Örlü, Hussain and Henningson2014, to be inclined and tilted). Note that the overlapping upper/lower streamwise vortices (with opposite sign) drawn in Jeong et al. (Reference Jeong, Hussain, Schoppa and Kim1997) also statistically appear within the present flow, as shown in figure 13 of Kevin et al. (Reference Monty, Bai, Pathikonda, Nugroho, Barros, Christensen and Hutchins2017) and here in figure 9(b). Our observations give further evidence that small- and large-scale coherence exhibit very similar unstable dynamical behaviour, as mentioned by Flores & Jiménez (Reference Flores and Jiménez2010), Hwang & Cossu (Reference Hwang and Cossu2010, Reference Hwang and Cossu2011).
As a final important point, in a separate study (yet to be published) we recently conducted very large field-of-view PIV over a smooth wall with embedded large-scale streamwise vortices produced by vortex generator devices, similar to Baidya et al. (Reference Baidya, de Silva, Huang, Castillo, Marusic and Hutchins2016). In this case a very similar alternating behaviour is also strongly present. This indicates that the turbulent behaviours we describe here are prevalent in vortex-embedded wall flows (in spanwise-heterogeneous roughness for instance), and not specific to the case of herringbone-type riblets.
5 Discussion
A further question that we have is whether the long low-momentum streaks over the converging part of the riblets are new coherent motions directly imposed by the surface pattern, or whether they are the naturally formed large turbulent structures which are now simply preferentially arranged at a certain spanwise location (Mejia-Alvarez & Christensen Reference Mejia-Alvarez and Christensen2013). Our wall-parallel PIV data 1.5 mm from the surface (Kevin et al. Reference Nugroho, Monty, Hutchins, Pathikonda, Barros and Christensen2015) indicate that the long streaks we see here in the log and outer regions are formed by trains of smaller-scale fluctuations, which are very well aligned over the converging line. Laminar flow visualisation by Xu, Zhong & Zhang (Reference Xu, Zhong and Zhang2018) also showed that the converging–diverging riblets direct the injected dye towards the converging region, where it is ejected into the flow. These observations support the former argument, that the C–D pattern directly creates the large-scale coherence evidenced for example in figure 5(b,c). For the case of spanwise-heterogeneous roughness, such as alternating sandpaper strips (Bai et al. Reference Bai, Kevin, Hutchins and Monty2018, for example), the locally slower mean flow immediately above the rougher sandpaper needs to be balanced by the faster outer-layer flow to maintain conservation of mass. This scenario requires downwash flow to occur above the sandpaper strips, which will also induce an overall three-dimensionality to the boundary layer.
Despite the fact that the coherent motions that we see in figure 5 are directly imposed by the C–D riblets, many intrinsic similarities to the typical smooth-wall boundary layers still exist. These include the logarithmic behaviour in the mean velocity statistics, as well as a similar turbulence (spectral) composition (Nugroho et al.
Reference Nugroho, Hutchins and Monty2013). The current spatial observations also highlight further consistencies, i.e. inclined, streamwise-elongated coherent structure. The difference between the surface-induced low-momentum regions and the typical large turbulent structures (which are associated with the vortex groups/packets) is their spanwise spacing, which is forced in our case to be
 ${\sim}2\unicode[STIX]{x1D6FF}$
, much larger than the typical spanwise spacing in a canonical (smooth-wall homogeneous) turbulent boundary layer. As suggested by Nezu & Nakagawa (Reference Nezu and Nakagawa1984), Vanderwel & Ganapathisubramani (Reference Vanderwel and Ganapathisubramani2015), Chung et al. (Reference Chung, Monty and Hutchins2018), having a larger wavelength
 $\unicode[STIX]{x1D6EC}\sim O(\unicode[STIX]{x1D6FF})$
results in a more pronounced heterogeneity, and based on the present observations, we surmise that larger spanwise spacing may promote stronger meandering behaviour, or permit the surface-induced three-dimensionality to affect the larger turbulence scales.
6 Summary
We expand our previous cross-stream observations of turbulent boundary layers formed over herringbone-type riblets. The key results presented here, however, are common to many cases of wall turbulence with embedded secondary flows in the form of mean streamwise vortices. Here we attempt to the study the streamwise behaviour of the modified turbulence structure, by performing large field-of-view PIV experiments in all orthogonal planes, taken at multiple spanwise and wall-normal locations over the converging–diverging riblet geometry. The results and relevant discussions are summarised as follows.
(i) Instantaneous logarithmic region observations reveal long low-momentum structures located over the upwash-flow region (converging part of the riblets). Although directly formed and sustained by the herringbone pattern, these turbulence events share some characteristics, such as meandering, breaking and branching, with those observed in the canonical smooth-wall flow. In the far outer region however, these low-momentum regions show signs of a lateral instability, where they appear to severely meander. We suspect that the large (forced) spanwise spacing between the streaks, here approximately
 $2\unicode[STIX]{x1D6FF}$
, plays a role in causing this behaviour. A similar instability may also occur in other spanwise-heterogeneous boundary layers with large-wavelength variation.
(ii) Between the upwash- and downwash-flow regions (denoted here as the
$xz_{2}$
plane, or over the yawed riblets), this outer-layer transfer of momentum creates the appearance of detached or floating coherence. The Reynolds shear stress profile over this region further indicates a demarcation between the upper and lower portion of the layer, exhibiting two distinct peaks. We note that such behaviour may also occur in a transient sense in spanwise-homogeneous smooth-/rough-wall boundary layers, and hence instantaneously, we may expect to see similar transport phenomena associated with these features (although in this case these phenomena will not occur at a fixed spanwise location). This behaviour complements the argument of enhanced mixing between the boundary layer and the free-stream regions over the C–D riblets, proposed by Kevin et al. (Reference Monty, Bai, Pathikonda, Nugroho, Barros, Christensen and Hutchins2017).(iii) Correlation maps of streamwise Reynolds fluctuation
$R_{u^{\prime }u^{\prime }}$
reveal heterogeneous coherence within the flow field. Over the yawed
$xz_{2}$
region, the average structure is tilted in both the streamwise and vertical direction. This statistical coherence is accompanied by non-symmetrical anti-correlation and vortical structures. Interestingly, the outer-layer event described in (i) leads to strong streamwise periodicity over the
$xz_{2}$
region, with a streamwise wavelength of approximately 4 to
$5\unicode[STIX]{x1D6FF}$
. This behaviour however, does not appear statistically in other tested spanwise locations (i.e. converging and diverging regions) due to the forced spanwise symmetry. Through conditional averaging, we show that this pronounced repeating behaviour is indeed caused by a meandering/instability.


Overall, the observed behaviours (meandering streaks with tilted and inclined spanwise asymmetric roll modes) largely resemble the buffer-layer model of Jeong et al. (Reference Jeong, Hussain, Schoppa and Kim1997), only here observed in the far outer region and at much larger scale. This observation lends support to the argument that small- and large-scale coherence exhibit very similar unstable dynamical behaviour, as mentioned by Flores & Jiménez (Reference Flores and Jiménez2010), Hwang & Cossu (Reference Hwang and Cossu2010, Reference Hwang and Cossu2011), and that a self-similar structure exists at a hierarchy of scales.
Acknowledgements
The authors wish to thank the Australian Research Council for the financial support of this research. The authors also wish to thank H. L. Bai for providing valuable discussions, and B. Nugroho for sharing the test surface. We are also grateful to K. Christensen for hosting the collaborative experiments that produced the cross-plane views reproduced in this paper.



