I. INTRODUCTION
Recently, nanostructured materials have been extensively used, facilitating the miniaturization of devices. The mechanical properties of nanostructured materials are different from those of bulk materials, often exhibiting improved mechanical behavior compared with their macroscopic counterparts. Reference Wang, Chen, Zhou and Ma1,Reference Meyers, Mishra and Benson2 Among several other issues, an improved understanding of the fracture mechanisms of nanostructured materials is of crucial importance. Traditionally, linear elastic fracture mechanics (LEFM) has been implemented to study the crack propagation on the macroscopic scale. The models considered in LEFM are linearly elastic, infinitely divisible, and continuous, which provide nearly exact predictions for the brittle cracking of materials. However, the validity of LEFM for nanostructured materials is debatable because of the discreteness on the atomic scale and the nonlinear behavior in the fracture process zone near the crack tip. Atomistic simulations typically include the atomic details of materials, i.e., the discreteness on the nanoscale and the mechanical response of the materials. Therefore, atomistic simulations are ideal to study the fracture behavior of the nanostructured materials.
Using atomistic simulations, the fracture phenomena of nanostructured materials have been intensively investigated. Most studies are primarily focused on crystalline materials with a specific crack length. Reference Gumbsch3–Reference Petucci, LeBlond and Karimi8 However, research on the effects of crack size on the fracture toughness of nanostructured materials is comparatively less prevalent. Mattoni et al. Reference Mattoni, Colombo and Cleri9 proposed a modified Griffith's condition with strain-dependent Young's modulus and surface energy for silicon carbide by conducting atomistic simulations. Zhang et al. Reference Zhang, Zhu and Belytschko10 used atomistic and multiscale simulations to examine the applicability of Griffith's law in forecasting the initiation of crack growth in crystalline materials. These researchers proposed a generalized fracture criterion accounting for the effects of both the size and lattice trapping. Adnan and Sun Reference Adnan and Sun11 examined the critical stress intensity factor of brittle sodium chloride, and the effects of the crack length were investigated using LEFM combined with atomistic simulations. Recently, Cui and Beom Reference Cui and Beom12 investigated the fracture behavior of Cu and Al with an edge crack; the crack size effects and different fracture patterns induced by dissimilar material properties were examined. In these investigations, the fracture toughness was calculated under the LEFM framework. However, the results based on LEFM are doubtful at the nanoscale. Therefore, the applicability of the LEFM should be examined. In fact, the determination of critical energy release rate is straightforward when using the energy concepts of the energy release rate. The required energy information can be derived from atomistic calculations.
The aim of the present study is to determine the toughness of nanosized single crystals containing nanocracks using the atomistic simulation framework. Molecular statics (MS) simulations were adopted, and the materials considered were Cu and Ni face-centered cubic (FCC) single crystals. Models with different crack lengths were adopted to investigate the effects of crack size on the fracture toughness. The MS method (using the energy concept of the energy release rate) and the LEFM method were used to calculate the fracture toughness. The results predicted using Griffith's law with a newly proposed surface formation energy are also provided. The reasons for the discrepancies between the results obtained by the different methods are discussed in detail.
II. COMPUTATIONAL METHODS
A. Atomistic simulation details
A series of MS simulations were performed for Cu and Ni single crystals with nanocracks using the large-scale atomic/molecular massively parallel simulator. Reference Plimpton13 The embedded atom method (EAM) Reference Daw and Baskes14 potentials developed by Mishin et al. Reference Mishin, Mehl, Papaconstantopoulos, Voter and Kress15,Reference Mishin, Farkas, Mehl and Papaconstantopoulos16 were adopted to mimic the Cu and Ni single crystals. The potentials were parameterized from various experimental and ab initio data, and various structural and mechanical properties could be accurately reproduced.
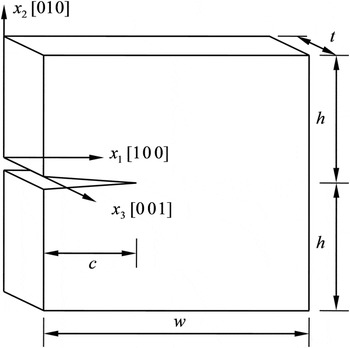
The configuration of the model is illustrated in Fig. 1, where an edge crack of length c with its front along the [001] direction was introduced on the (010) plane in an otherwise perfect crystal. Mode I loading condition was applied by uniformly controlling the displacements of atoms in the top-most and bottom-most layers of the model, and traction-free conditions were adopted in the other directions. The width, half-height, and thickness of the simulation system are w, h, and t, respectively, and the dimensions of the full model were selected to be w = 2h = 50a and t = 10a, respectively. Here, a is the lattice distance, which is 3.615 Å for Cu and 3.52 Å for Ni. The model was arranged in cubic directions, i.e., x 1[100], x 2[010], and x 3[001]. Periodic boundary conditions were used in the x 3-direction, and the other two directions were constrained by nonperiodic boundary conditions. The selected thickness was larger than 6 times the cutoff distance for the adopted potential, which is sufficient to eliminate additional size effects in this direction. Reference Krull and Yuan7 Note that the periodic boundary condition along the x 3-direction is believed to prevent the emission of dislocations in the crystal for the model arranged in the present study. Reference Gumbsch3 Therefore, brittle crack extension is expected.
Geometry of the simulated single crystal system with (010) [001] edge cracks.

The crack was inserted by excluding the interactions of atoms in the upper and lower crack surfaces. To elucidate the effects of the crack length on the fracture toughness of the single crystals, crack lengths ranging from a to 25a were examined. After crack insertion, the system was relaxed using the conjugate gradient (CG) method. A stepwise mode I loading scheme was then applied to the system. A large increment of 10−3 in strain ε = v/h (where v is the applied uniform displacement) was first adopted and was then followed by a smaller increment of 5 × 10⁻⁵, when the system approached the critical point based on the crack extension. Each loading step was followed by an energy minimization process using the CG method, and during the relaxation, the motion of atoms at the boundary layers was frozen. The temperature was set to 0 K in the simulation, thereby suppressing the thermally activated dislocations. The simulation parameters, such as the total energy of the system and normal stress, were recorded at the end of the minimization process for every step. The stress recorded was the volume-averaged virial stress Reference Swenson17 of the simulated system, which coincides with the Cauchy stress in continuum mechanics. Reference Subramaniyan and Sun18
B. Crack surface formation energy (CSFE)
For crack propagation in a perfectly brittle manner, the required critical energy release rate (G c) can be estimated by Griffith's law as G c = 2γs, where γs is the formation energy of the newly created fracture surface. Traditionally, the surface energy is calculated from bulk materials containing no crystallographic defects inside the materials. In the present study, we proposed a new method to calculate the CSFE that considers the local environment of the system.
Two specimens with crack lengths of c and c + Δc were prepared separately for calculating the CSFE. After inserting a crack into each model, a relaxation process using the CG method was performed. E 0(c) and E 0(c + Δc), which are the total potential energy per unit thickness for simulation model of crack length of c and c + Δc, respectively, were recorded after relaxation. According to thermodynamic equilibrium, we can obtain the following relationship:
 $${E_0}\left( c \right) + 2{\gamma _{\rm{s}}}\left( c \right)\Delta c = {E_0}\left( {c + \Delta c} \right)\quad .$$
The CSFE, therefore, can be derived from Eq. (1) to be
 $${\gamma _{\rm{s}}}\left( c \right) = {1 \over 2}{{{E_0}\left( {c + \Delta c} \right) - {E_0}\left( c \right)} \over {\Delta c}}\quad .$$
C. Energy release rate calculation by MS
To extract the precise toughness of the materials using MS calculations, the energy release rate is calculated from the following energy definition Reference Anderson19
 $$G = - {{\Delta U\left( c \right)} \over {\Delta c}}\quad ,$$
where
 $$\Delta U\left( c \right) = U\left( {c + \Delta c} \right) - U\left( c \right)\quad ,$$
is the difference in the strain energy per unit thickness for the two equilibrium states with different crack sizes. Here, the strain energy is calculated as
 $$U\left( c \right) = E\left( c \right) - {E_0}\left( c \right)\quad ,$$
where E(c) denotes the total energy per unit thickness of the system of specific crack length c with external loading. Using the definition of CSFE in Eq. (2), Eq. (3) can be rewritten as
 $$G = - {{\Delta E\left( c \right)} \over {\Delta c}} + 2{\gamma _{\rm{s}}}\left( c \right)\quad ,$$
where
 $$\Delta E\left( c \right) = E\left( {c + \Delta c} \right) - E\left( c \right)\quad .$$
D. Energy release rate calculation by LEFM
For linear elastic materials, the J-integral Reference Rice20 is identical to the energy release rate for coplanar crack growth. The finite element method (FEM) is used to calculate the J-integral of the continuum counterparts of the MS models.
The material properties of Cu and Ni single crystals exhibit cubic symmetric characteristics. For the plane strain condition, the stress–strain relation can be represented by the following matrix form:
 $$\left\{ {\matrix{ {\sigma _{11} } \cr {\sigma _{22} } \cr {\sigma _{12} } \cr } } \right\} = \left[ {\matrix{ {C_{11} } & {C_{12} } & 0 \cr {C_{12} } & {C_{11} } & 0 \cr 0 & 0 & {C_{44} } \cr } } \right]\left\{ {\matrix{ {\varepsilon _{11} } \cr {\varepsilon _{22} } \cr {2\varepsilon _{12} } \cr } } \right\}\quad ,$$
where σ ij and ε ij are the stresses and strains in the Cartesian coordinate system. C ij is the components of the stiffness matrix.
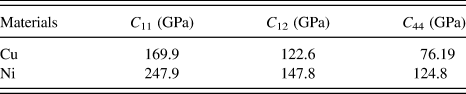
An intact model (without crack) with dimensions equal to the cracked model was used to calculate the stiffness components. The relaxed intact model was strained by different combinations of strain. After relaxing the strained model, the stress components were recorded. Then, the stiffness components can be derived according to Eq. (8). To calculate C 11 and C 12, the model was strained by ε11 = ε0 and ε22 = ε12 = 0, and the result was confirmed by using a different strain combination of ε22 = ε0 and ε11 = ε12= 0. For calculating C 44, strains of ε12 = ε0 and ε11 = ε22 = 0 were adopted. The stiffness components calculated using the EAM potentials are listed in Table I. These values agree well with the results obtained by Mishin et al. Reference Mishin, Mehl, Papaconstantopoulos, Voter and Kress15,Reference Mishin, Farkas, Mehl and Papaconstantopoulos16 The corresponding compliance components in the plane strain condition can be derived from the stiffness of the material as
 $$S_{11}^{\rm{e}} = {{{C_{11}}} \over {C_{11}^2 - C_{12}^2}}\quad ,$$
 $$S_{12}^{\rm{e}} = - {{{C_{12}}} \over {C_{11}^2 - C_{12}^2}}\quad ,$$
 $$S_{44}^{\rm{e}} = {1 \over {{C_{44}}}}\quad .$$
Stiffness components of Cu and Ni.

Under mode I loading condition, the stress intensity factor K I can be obtained as Reference Tada, Paris and Irwin21
 $${K_{\rm{I}}} = {\sigma _0}\sqrt {\pi c} F\left( {{c \over w}} \right)\quad ,$$
where F is a dimensionless function of c/w and
 $\sigma _0 = {\varepsilon \mathord{\left/ {\vphantom {\varepsilon {S_{11}^{\rm{e}} }}} \right. \kern-\nulldelimiterspace} {S_{11}^{\rm{e}} }}$
. Using the relation
Reference Suo22
 $$J = \sqrt {{{\rho + 1} \over 2}} S_{11}^{\rm{e}}K_{\rm{I}}^2\quad ,$$
we can obtain the following value for the J-integral:
 $$J = {\pi \over {S_{11}^{\rm{e}}}}c{\varepsilon ^2}\hat J\quad ,$$
where
 $$\hat J = \hat J\left( {{c \over w}} \right) = \sqrt {{{\rho + 1} \over 2}} {F^2}\quad ,$$
and ρ is a dimensionless material constant defined by Reference Suo22
 $$\rho = {{2S_{12}^{\rm{e}} + S_{44}^{\rm{e}}} \over {2S_{11}^{\rm{e}}}}\quad .$$
Here,
 $\hat J$
is a function of c/w for a specific crack length; if
 $\hat J$
is known, the value of J-integral can be derived for the system with an arbitrary applied strain.
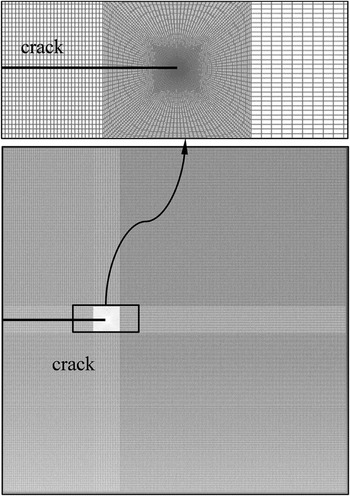
FEM results were obtained using the commercial code ABAQUS 6.13. The dimensions of the simulation model used in the FEM calculation were the same as the atomistic simulation. To ensure the accuracy of the results, fine meshes were used near the crack tip. For example, for Cu with a crack of length 15a, the FEM model is shown in Fig. 2. To calculate
 $\hat J$
, an arbitrary strain (ε = 0.01 was used here) was applied to the FEM model, and resulting J-integral was evaluated using the domain integral method.
Reference Shih, Moran and Nakamura23
The J-integral was calculated at the first fifteen contours surrounding the crack tip, and it is observed that the value of J-integral converged from the fifth contour. Then,
 $\hat J$
could be calculated using Eq. (12). The obtained
 $\hat J$
values for Cu and Ni using the material properties derived from the adopted EAM potential are plotted in Fig. 3 as a function of the crack length. The critical strain at the onset of crack propagation was determined from MS simulation. Substituting the critical strain in Eq. (12), the fracture toughness based on the LEFM framework can be obtained.
FEM model for computing the energy release rate with continuum counterpart of the MS model.

Dimensionless function
 $\hat J$
as a function of crack length for Cu and Ni.

III. RESULTS AND DISCUSSION
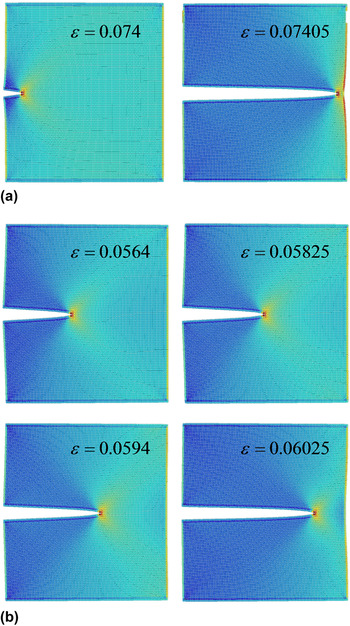
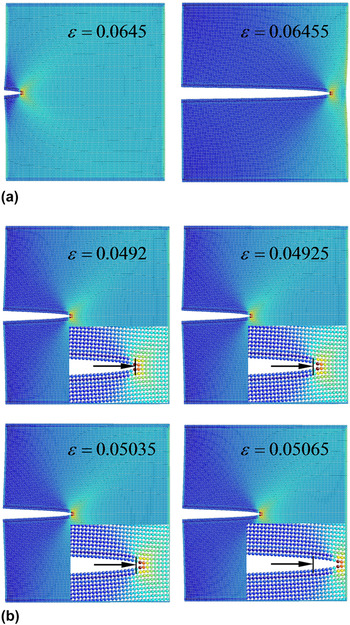
For both materials, the overall feature of the fracture pattern is brittle except for the shortest crack with a length of c = a. In this case, the dislocation emission is observed with no crack propagation and hence is not considered hereinafter. The other cracks were propagated, and the fracture processes of two representative crack lengths of Cu and Ni are presented in Figs. 4 and 5, respectively. The insets in Fig. 5(b) show the atomic configuration near the crack tip, where the location of the initial crack tip is indicated by short arrows. Snapshots of the MS simulation results were obtained using AtomEye. Reference Li24 The atomic configurations were colored by the local “atomic stress” with units of stress × volume, with the values varying from blue (low) to red (high). The applied strain for each snapshot is also given. As observed in Figs. 4(a) and 5(a), for both Cu and Ni with short cracks of c = 5a, the cracks were catastrophically ruptured in one step. For long cracks with c = 20a, the fracture propagated differently for the two materials, as illustrated in Figs. 4(b) and 5(b). For Cu, the crack propagated gradually; however, for Ni, the crack was extended by half of the lattice distance and remained the same for few steps before subsequent crack growth. Because our focus is the initiation of fracture, the reasons causing the different fracture patterns are not covered in this study, which may require R-curve analysis and will be left for future studies.
Snapshots of fracture process of Cu FCC single crystal with edge crack of lengths (a) 5a and (b) 20a. The atomic configurations are rendered by the local “atomic stress.”

Snapshots of fracture process of Ni FCC single crystal with edge crack of lengths (a) 5a and (b) 20a. The atomic configurations are rendered by local “atomic stress.” The insets in (b) are the atomic configuration near the crack tip, where the location of the initial crack tip is indicated by short arrows.

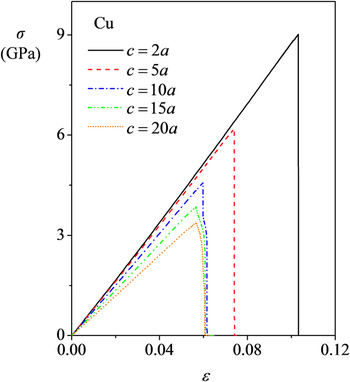
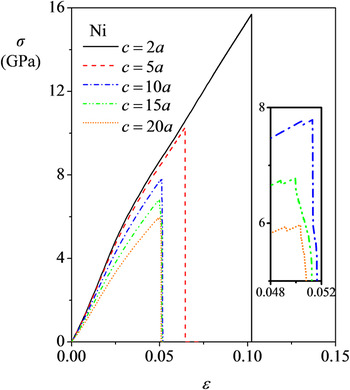
The stress–strain relation for Cu is almost linear; however, for Ni, an obvious nonlinear feature is noted. For clarity, five stress curves for both Cu and Ni are shown in Figs. 6 and 7, respectively. Here, the stress σ is the normal virial stress in the x 2-direction, and the definition of strain ε is the same as before. For Cu, the stress increased monotonically with increasing strain, and undulations of stress are not observed before the maximum stress. For Ni, the stress curves for short cracks (c < 9a) are similar to those for Cu; however, for relatively long cracks (c ≥ 9a), a stress undulation is observed before the maximum stress. For clarity, the curves for cracks with lengths of 10a, 15a, and 20a near the stress undulation are presented in the inset of Fig. 7. The strain at the stress undulation corresponds to the crack growth for half of the lattice distance, as shown in Fig. 5(b).
Stress–strain curves of Cu FCC single crystal with edge cracks of five different lengths under mode I loading conditions.

Stress–strain curves of Ni FCC single crystal with edge cracks of five different lengths under mode I loading conditions. Near the stress undulation, the curves of cracks with lengths of 10a, 15a, and 20a are presented in the inset.

The initiation of the crack extension is selected based on a combination of atomic configurations and stress–strain curves of the simulation results. For all the Cu models and for Ni with relatively short cracks (c < 9a), the crack initiation strains corresponded to the maximum stress. For the relatively long cracks of Ni (c ≥ 9a), the critical strains were selected at the first stress undulation before the maximum stress. In general, for MS simulations, we expect that the model with a longer crack would propagate at a smaller strain than that with a shorter crack, which is true for Cu with crack lengths shorter than 17a and for Ni with crack lengths shorter than 15a. For other models of each material, the critical strain slightly increases as the crack length increases and converges to a specific value. A similar trend was observed in a study conducted by Huang et al., Reference Huang, Zhang, Belytschko, Terdalkar and Zhu25 where the mechanics of nanocracks in a silicon single crystal was investigated. By comparing the energy barrier for crack extension, these researchers concluded that crack extension could be delayed for longer cracks.
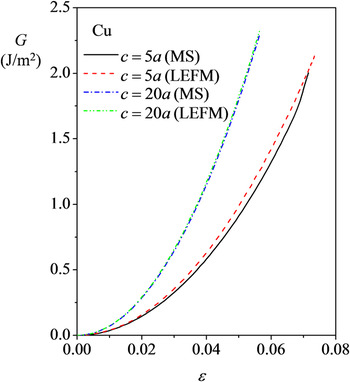
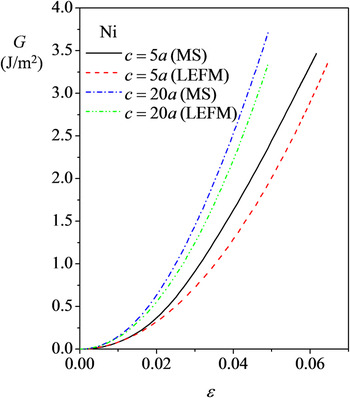
The calculated energy release rates as a function of applied strain for Cu and Ni are shown in Figs. 8 and 9, respectively. For Cu, the difference between the calculated results of MS and LEFM is quite small; especially for the long crack, the values match each other. However, for Ni, the values obtained by MS are always larger than those calculated using LEFM. For the long crack, the difference is decreased; however, an obvious difference still exists. This implies that Ni exhibits nonlinear characteristics regardless of the crack length.
Energy release rate calculated from MS and LEFM for two models with different crack lengths for Cu FCC single crystal.

Energy release rate calculated from MS and LEFM for two models with different crack lengths for Ni FCC single crystal.

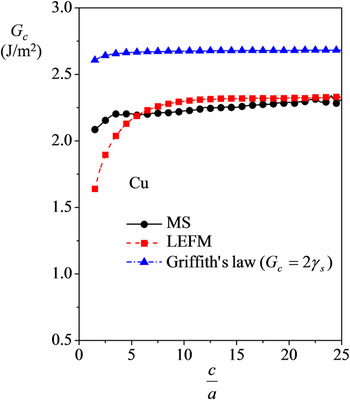
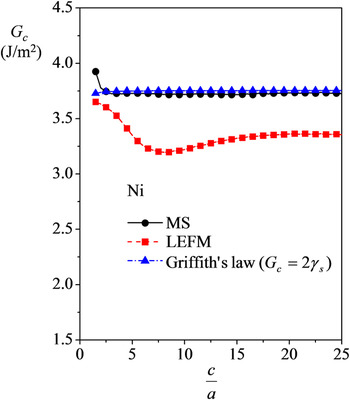
For the MS method, G c was determined from the values of G at the critical strain of the specific crack length c when the crack with length c propagated at a smaller strain than the crack with length c + Δc. For the opposite case, G c was determined by extrapolating the calculated G curves. The calculated critical energy release rates for MS and LEFM are plotted in Figs. 10 and 11 for Cu and Ni, respectively. For comparison, the G c value expected using Griffith's law using the newly proposed CSFE is also presented and is slightly affected by the crack length for the short nanocracks with lengths of a few a for each material. This result was speculated owing to the effects of the local environment caused by the interaction of the free surface on the left side of the simulation system and the nanocrack during the relaxation process.
Critical energy release rates obtained from MS, LEFM, and Griffith's law for Cu FCC single crystal.

Critical energy release rates obtained from MS, LEFM, and Griffith's law for Ni FCC single crystal.

The G c obtained from MS increases with increasing crack length for Cu and decreases for Ni with short cracks. For crack lengths larger than 3a, the MS values tend to converge for both materials. Therefore, this value could be regarded as a material constant on the nanoscale, i.e., the fracture toughness. For LEFM results, G c is increased as the crack length increases for Cu; however, for Ni, the value decreases first until reaching a crack length of 8.5a and then increases. For Cu with crack lengths c > 6a, the G c values for the LEFM and MS method converge, which is lower than the value obtained using Griffith's law by ∼14%. Similar results were observed in previous research on Cu single crystals with edge cracks of the same crack plane and different crack fronts. Reference Cui and Beom12 For Ni, the values of G c for atomistic simulations converge to the value predicted by Griffith's law, which is larger than the LEFM results by ∼11%. Therefore, the LEFM method is not valid for the entire range of crack lengths for Ni. The primary reason for the discrepancy of the G c values calculated using MS and LEFM for Ni is considered to be due to the obvious global nonlinear feature of Ni compared with Cu, as illustrated in Figs. 7 and 9. The lattice trapping effect Reference Thomson, Hsieh and Rana26 may also affect the calculated critical energy release rates obtained using the MS method. As known from previous research, for atomistic simulations performed at low temperature, the lattice trapping effects cannot be ignored. Reference Guo and Wang6 The lattice-trapping effect is expected to play an increasingly important role in fracture with reduced system size. Reference Huang, Zhang, Belytschko, Terdalkar and Zhu25 In our case, this effect corresponds to the short cracks that were significantly affected by the free surfaces near the crack tip.
In addition, previous studies showed that for the same crystal orientation and crack arrangement, the fracture toughness was 1.02–1.32 times for Ni Reference Gumbsch3,Reference Karimi, Roarty and Kaplan5,Reference Petucci, LeBlond and Karimi8 and 1.2 times for Cu Reference Petucci, LeBlond and Karimi8 of the values obtained using Griffith's law. The discrepancy between the results obtained in the present study for long cracks and the previous results may be due to the different loading schemes, temperature conditions, and potential functions used in these studies.
IV. CONCLUSION
Using MS simulations, we investigated the effects of crack length on the fracture toughness of Cu and Ni FCC single crystals with an edge crack. The MS simulation results revealed that if the crack length was larger than a specific length (three lattice constants for the materials considered in the present study), the critical energy release rate could be used as a material constant. The different response to the applied loads substantially affected the fracture toughness derived from the different methods. For Cu, which behaved as a linear elastic material, when the crack length was larger than six lattice constants, LEFM accurately reproduced the atomistic data. However, for Ni, which exhibits obvious nonlinear features, the LEFM results always underestimated the critical energy release rates even for long cracks. Furthermore, the results presented here provide a basic understanding of the brittle fracture behavior of nanosized single crystals.
ACKNOWLEDGMENTS
This research was supported by the Basic Science Research Program through the National Research Foundation of Korea (NRF) funded by the Ministry of Education (NRF-2013R1A1A2A10008799) and an Inha University Research Grant.