1. Introduction
Obesity is a global problem (World Health Organization, 2003) that is on the increase (International Obesity Task Force, 2009). If the current trend in population weight gain continues, more than half of the population in England will be obese by 2050 (Foresight, 2007). Being overweight in early- and mid-adulthood increases the risk of developing a wide range of diseases in later life (Sun et al., Reference Sun, Townsend, Okereke, Franco, Hu and Grodstein2009). The National Health Service (NHS) costs directly related to obesity and resulting ill health have been estimated for 2015 as £3.2 billion (Foresight, 2007). There is also evidence that reducing weight among overweight people reduces risks of developing several serious chronic diseases including diabetes and hypertension (Avenell et al., Reference Avenell, Broom, Brown, Poobalan, Aucott, Stearns, Smith, Jung, Campbell and Grant2004; Aucott et al., Reference Aucott, Poobalan, Smith, Avenell, Jung and Broom2005; Aucott, Reference Aucott2008; Aucott et al., Reference Aucott, Rothnie, McIntyre, Thapa, Waweru and Gray2009). Preventive measures to slow down and reverse this trend may reduce these risks and consequent costs to society and individuals.
While there is evidence that interventions to prevent overweight and obese people gaining more weight reduce morbidity, less is known about the factors that influence compliance with such programmes. For example, we know that people register for weight-loss regimens in huge numbers and drop out of them in equally huge numbers, but not what factors determine such behaviour. We also know from observing individual behaviour that people differ in their propensity to take up and maintain healthy lifestyles. Understanding take up and compliance of lifestyle intervention programmes is necessary to design effective interventions for potential beneficiaries (Green and Tones, Reference Green and Tones2010). One interesting question then becomes why, and what interventions can be designed to encourage individuals to adopt and maintain a healthy body mass index (BMI) throughout their lifespan. This study used a discrete choice experiment (DCE) to investigate the general population’s preferences for alternative lifestyle interventions to prevent and reduce obesity (Hensher et al., Reference Hensher, Rose and Greene2005; Ryan et al., Reference Ryan, Gerard and Amaya-Amaya2008; de Bekker-Grob et al., Reference de Bekker-Grob, Ryan and Gerard2012). The DCE approach was used for a number of reasons. The methodology allows estimation of the contribution of individual attributes and levels to overall value. Such information is useful from a policy perspective, allowing targeted policies to be developed. DCEs also allow willingness to pay (WTP), a monetary measure of value, to be estimated. Output generated from a DCE can then be incorporated into a cost-benefit analysis (CBA) framework, allowing informed decisions about optimal programmes. An advantage of the DCE approach, over the more direct contingent valuation approach to generating monetary values, is that value can be generated for a number of different real or potential policy interventions that differ with respect to the levels of the attributes included in the DCE. The DCE also allows a broader measure of value than that typically picked up within the quality-adjusted life-year approach (Ryan et al., Reference Ryan, Gerard and Amaya-Amaya2008). DCEs also provide information on the trade-offs individuals make between attributes, that is, how much of one attribute are individuals willing to give up to have more of another. While DCEs have been widely used to address health policy questions (de Bekker-Grob et al., Reference de Bekker-Grob, Ryan and Gerard2012), their application to lifestyle interventions is limited (Roux et al., Reference Roux, Ubach, Donaldson and Ryan2004; Owen et al., Reference Owen, Pettman, Haas, Viney and Misan2009).
2. Material and Methods
In the DCE, respondents were asked to make choices between different lifestyle intervention programmes to manage their weight. The questionnaire is available from the authors on request. Descriptions of the final set of attributes and levels are shown in the Appendix.
2.1 Defining attributes and levels
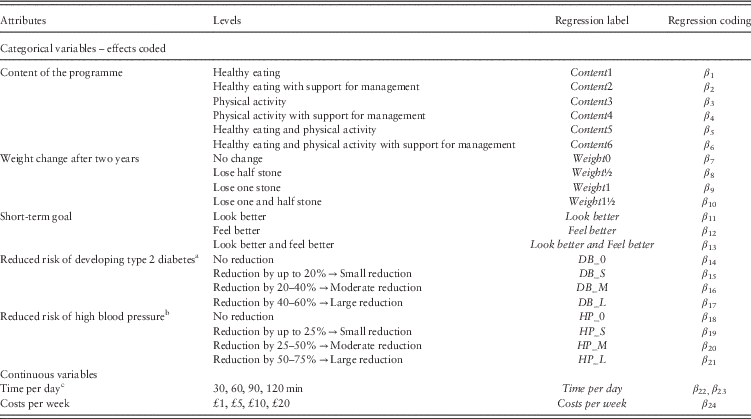
The first stage of a DCE is to define attributes and levels. This DCE was part of a larger multiphase project that aimed to identify the efficiency of alternative interventions to prevent obesity. Three prior phases informed the choice of attributes and levels: one set of semi-structured interviews. The attributes and levels are shown in Table 1.
Attributes and levels within the discrete choice experiment, regression labelling and coding

a,b Levels for reduced risk of developing type 2 diabetes and high blood pressure were changed after pilots.
c A squared term, β 23, was included to allow for non-linearity in preferences.
The first systematic review identified evidence from randomised controlled trials (RCTs) on types of lifestyle interventions and their effects on weight, and longer-term health outcomes (e.g. mortality, incidence of heart disease, cancers and diabetes) (Brown et al., Reference Brown, Avenell, Edmunds, Moore, Whittaker, Avery and Summerbell2009). Many RCTs do not measure longer-term outcomes; hence, a second systematic review of cohort studies was conducted to provide information about longer-term effects (Aucott, Reference Aucott2008; Aucott et al., Reference Aucott, Rothnie, McIntyre, Thapa, Waweru and Gray2009; Aucott et al., Reference Aucott, Gray, Rothnie, Thapa and Waweru2011). Both reviews suggested that the content of ‘effective’ lifestyle interventions commonly involved healthy eating, physical activity and behaviour change support. The reviews also provided evidence on the magnitude of weight loss and changes in the risk of specific health effects. There was insufficient evidence to establish any link between weight loss due to risk of cancer, but evidence of a link to measures of heart disease (e.g. risk of hypertension) and developing type 2 diabetes (also a risk factor for heart disease) was identified (Aucott et al., Reference Aucott, Poobalan, Smith, Avenell, Jung and Broom2005; Aucott, Reference Aucott2008; Brown et al., Reference Brown, Avenell, Edmunds, Moore, Whittaker, Avery and Summerbell2009). Based on this review evidence, the risk reduction for type 2 diabetes and high blood pressure was categorised into four levels (no change; up to 20% and up to 25%, respectively; 20–40% and 25–50%, respectively; and 40–60% and 50–75%, respectively).
Semi-structured interviews were conducted throughout the United Kingdom with 34 18-to-50-year-old overweight people from diverse ethnic and socio-economic backgrounds (Douglas et al., Reference Douglas, Greener and van Teijlingen2008; Greener et al., Reference Greener, Douglas and van Teijlingen2010). Different recruitment methods were employed, including contacting people in public places, general practice (GP) surgeries, dietetic services and weight management groups. The interviews explored, among other things, opinions regarding effective obesity/overweight interventions. Overweight respondents were motivated to try to lose weight. An attribute was therefore included to reflect ‘Weight change after two years’. Realistic levels, determined from the systematic reviews, and known to have beneficial effects on risk factors for disease, were: no change, lose half stone (~3.2 kg), lose one stone (~6.4 kg) and lose one and half stone (~9.5 kg). Factors influencing take up of lifestyle interventions included psychological/motivational (motivational support to help maintain lifestyle interventions), social (looking and feeling better) and material (time and money costs of participating in lifestyle interventions to maintain/reduce weight). Motivational support was included under the content of the programme. A ‘short term goal’ attribute was included, allowing for the benefits of looking and feeling better. ‘Time per day’ was included as an attribute. This was defined in terms of the time respondents are prepared to give to the programme per day, and was defined as factors such as preparation time, travel and activity on the programme. Levels were guided by the times taken for interventions quoted in the RCTs included in the systematic review (Brown et al., Reference Brown, Avenell, Edmunds, Moore, Whittaker, Avery and Summerbell2009). ‘Costs per week’ of the programme was introduced as an attribute. This allowed willingness to pay (WTP), a monetary measure of value, to be estimated. Respondents were asked what they would personally be willing and able to pay for the programme they choose. They were told that this would include any travel costs as and well as other direct costs of the programme. Levels for the cost attribute were derived from a direct WTP question included in pilot work. In this pilot, an example lifestyle intervention programme was presented to respondents (Content of programme=healthy eating and physical activity with support for management; weight loss after two years=one and half stone (9.6 kg); short-term goal=looking better and feeling better; reduced risk of developing type 2 diabetes=40–60%; reduced risk of high blood pressure=50–75%; time per day=30 minutes/day). This lifestyle intervention presented what, a priori, was thought to be best levels of an intervention, thereby providing an upper value of a lifestyle intervention. A payment card approach was used to elicit values (Donaldson et al., Reference Donaldson, Mason and Shackley2012). Respondents were asked to state their maximum WTP, with a range from £0 to £50/week, based on the responses from the pilot study. Levels were also guided by what participants actually pay for UK commercial weight-loss interventions (see e.g. http://www.lighterlife.com/how-it-works/lighterlife-explained/; http://www.cambridgeweightplan.com/whats-the-price?gclid=COeFkMKcvb0CFTCWtAodiFUAVA). Those who stated they were willing to pay the maximum level on the payment card, £50, were asked to provide their maximum WTP.
This combination of attributes and levels provide useful policy information on a number of fronts. For example, how important is weight loss to the general population? How important is future risk of disease? And do people differ in how they value such attributes? How do respondents trade risk of disease for ‘poorer’ lifestyles? What is the monetary value (WTP) of different lifestyle components and programmes (potentially for application within a CBA framework)? Are individuals more likely to participate in life-style interventions that involve healthy eating or physical activity? Is support for management of programmes valued? How important is looking and feeling better (potentially important for health promotion campaigns, see e.g. Grogan et al., Reference Grogan, Flett, Clark-Carter, Gough, Davey, Richardson and Rajaratnam2011; Whitehead et al., Reference Whitehead, Re, Xiao, Ozakinci and Perrett2012)? How much time can we expect individuals to spend on lifestyle intervention programmes?
2.2 Developing the DCE questionnaire
The combinations of attributes and levels resulted in 18,432 possible lifestyle interventions [five attributes with four levels, one attribute with six levels and one attribute with three levels (Table 1); 45×61×31]. SAS software generated a main-effects D-efficient design, minimising uncertainty around parameter estimates (by minimising the determinant of the covariance matrix) (Kuhfeld et al., Reference Kuhfeld, Tobias and Garratt2009). The experimental design generated 72 choice sets.
A ‘Current lifestyle’ option was added to each choice set. Before responding to the choices respondents were asked to provide information about their current lifestyle with respect to all the attributes and levels in the DCE. Responses were used to define the respondent’s ‘Current lifestyle’ in terms of the attributes and levels of the DCE for use in the econometric analysis (see below).
Two ‘warm-up’ choices were included to familiarise respondents with the task and two rationality tests were added (Sen’s expansion property, Sen, Reference Sen1993) to test if respondents were engaged in the experiment. There is debate in health economics about what to do with ‘irrational’ responses, with some arguing that random utility theory allows for random errors and therefore those failing such tests should be included in the analysis (Lancsar and Louviere, Reference Lancsar and Louviere2006). It has also been found that responses that fail rationality tests can often be explained ‘rationally’ (San Miguel et al., Reference San Miguel, Ryan and Amaya-Amaya2004; Ryan et al., Reference Ryan, Watson and Entwistle2009). We include standard rationality tests, and compare results with and without those who failed both tests.
Following completion of the choices, respondents who always chose ‘Current lifestyle’ were asked to give reasons. Possible responses were: not overweight; satisfied with current weight; cannot afford to pay for programme and have alternative ways to maintain weight. In addition to the DCE choices, information was collected on respondent’s personal and socio-economic characteristics (age, height, weight, general health status, whether they smoke) and time to complete the questionnaire.
2.3 Pilot work and changes to questionnaire
While in applications of DCEs to health care the mean number of choices included in a DCE is 14 (with a mean of five attributes), this standard practice is not based on empirical work (de Bekker-Grob et al., Reference de Bekker-Grob, Ryan and Gerard2012). Pilot work was conducted with three versions of the questionnaire, differing according to number of choices: 40 (36 choices+2 rationality test+2 warm-ups) choices in two blocks, 22 (18+2+2) choices in four blocks and 12 (8+2+2) choices in nine blocks. Consideration was given to variations in rationality of responses, item response and overall response rates by questionnaire. A random sample of 446 of the UK population identified from the electoral roll was mailed the questionnaires. A stamped addressed envelope was included and 27 questionnaires were returned completed. Response rates for all three versions of the questionnaire were poor (40 choices=5.33%; 22 choices=5.92%; 12 choices=6.94%). Sensitivity of the study topic (weight and obesity), lack of interest, length and format of the questionnaires, and choice of target population (general public from the electoral roll) were hypothesised to be causes of the low response.
The literature was reviewed to increase response rates (Edwards et al., Reference Edwards, Roberts, Clarke, DiGuiseppi, Wentz, Kwan, Cooper, Felix and Pratap2007; Mallen et al., Reference Mallen, Dunn, Thomas and Peat2008). The format, layout and data collection method were all in accordance with ‘best practice’. Therefore, a new design with 24 choices was generated by allowing one violation of desirable design properties. These 24 choices were divided into three blocks, each with eight choices, two warm-ups and two rationality tests. A total of eight choices have been shown to be acceptable in DCEs, and are on the low side (de Bekker-Grob et al., Reference de Bekker-Grob, Ryan and Gerard2012). Two versions of the questionnaire were produced, based on the design above, varying according to the number of personal/socio-economic questions (to explore the linkage of the DCE with secondary data as a separate part to the project).
For this second pilot a further 300 questionnaires/version, 600 in total, were mailed out with a return envelope to a random sample of the UK population, again using the electoral roll. Of the 94 returned, only 33 were completed sufficiently for analysis. Some responses indicated difficulty understanding the risk of developing type 2 diabetes and high blood pressure, expressed in percentages (e.g. reduction in risk by 25–50%). This finding is consistent with the psychological literature that individuals have difficulty understanding risks, and that they often code risk data categorically that is ‘high’ or ‘low’ (de Bekker-Grob et al., Reference de Bekker-Grob, Ryan and Gerard2012). Hence, for the main study (see below), the levels for risk attributes were defined qualitatively: ‘no reduction’, ‘small reduction’, ‘moderate reduction’ and ‘large reduction’. Figure 1 shows an example of choice.
Example choice set
The introductory information given to respondents, together with the information on attributes and levels, is provided in the Appendix.
2.4 Data collection
Given the persistent poor response rate in both pilot studies a web-based online survey method was used to collect the final data set, using a market research company (http://www.researchnow.co.uk/). This company contacted registered individuals, by email, inviting them to complete the DCE. A financial incentive of £2 was promised for completion, credited to the respondent’s personal account. Following discussions with the company further modifications were made to the questionnaire to clarify meanings and to accommodate the online survey format. For example, respondents were given a separate icon to click for a reminder of definitions of attributes and levels in choices.
Given the DCE was concerned with obesity prevention, that weight increases with age, and that the proportion of the population becoming overweight/obese is increasing, all adults aged 18–64 and living in the United Kingdom were invited to respond. The company’s internal protocol was used to stratify by age and gender, ensuring respondents were representative of the general population (according to these characteristics). Given pregnant women would have an elevated weight and BMI, they were screened out. The long format from the second mailed pilot, with 12 choices including two warm-up choices and two rationality tests (three versions), and a larger set of information on personal and social characteristics, was used (since from the second pilot this larger collection of data did not reduce the response rate).
Responses from 37 respondents from the online panel were initially collected and provisional analysis was conducted. Item response rate was assessed and analysis of the choice questions was conducted to ensure parameters were moving in the right direction (theoretical validity). The sample size was too small to generate WTP estimates. Following minor changes to correct language, the main survey was implemented on a new sample with quotas by the block of questionnaire, age group and gender (The data was collected in January 2009).
2.5 Econometric analysis
Initial analysis employed the conditional logit model. However, the independence of irrelevant alternatives (IIA) assumption was violated (Hausman test; p<0.001). The mixed logit model (MXL) was then employed, but did not converge following various assumptions on distribution of parameters. Problems of convergence are common when employing MXL and often distributions are imposed on the parameters to ensure the model runs (rather than to ensure realism; i.e. parameters are assumed to have normal distributions when a negative coefficient is not predicted; de Bekker-Grob et al., Reference de Bekker-Grob, Ryan and Gerard2012). One possibility for the failure of our MXL model to converge was that we demanded ‘too much’ from our data. Models such as the MXL are known to be ‘sponges for data’ (personal communication with Joffre Swait). Our large number of categorical variable (five of the seven attributes), which were effects coded (see below), may have contributed to the convergence problems, as well as the relatively high number of individuals who always chose their current lifestyle. Another contributor is potential multicollinearity, though given the experimental design used to generate our set of independent variables (attributes) this is less likely to be relevant in our study.
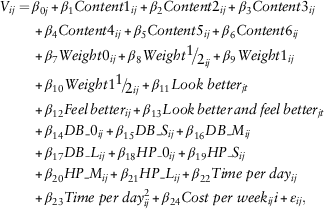
To overcome convergence problems we used the multinomial probit model (or alternative specific probit model) within STATA 11.0 (asmprobit), allowing for a general covariance structure in error terms to address violations of IIA. Clustering around observations from the same respondents was accounted for. The equation estimated is described in the following equation:
 $$\eqalignno{ V_{{ij}} = \, & \beta _{{0j}} {\plus}\beta _{1} Content1_{{ij}} {\plus}\beta _{2} Content2_{{ij}} {\plus}\beta _{3} Content3_{{ij}} \cr {\plus}\beta _{4} Content4_{{ij}} {\plus}\beta _{5} Content5_{{ij}} {\plus}\beta _{6} Content6_{{ij}} \cr & {\plus}\beta _{7} Weight{\rm 0}_{{ij}} {\plus}\beta _{8} Weight{\raise0.7ex\hbox{$1$} \!\mathord{\left/ {\vphantom {1 {2_{{ij}} }}}\right.\kern-\nulldelimiterspace}\!\lower0.7ex\hbox{${2_{{ij}} }$}}{\plus}\beta _{9} Weight{\rm 1}_{{ij}} \cr & {\plus}\beta _{{10}} Weight1{\raise0.7ex\hbox{$1$} \!\mathord{\left/ {\vphantom {1 2}}\right.\kern-\nulldelimiterspace}\!\lower0.7ex\hbox{$2$}}_{{ij}} {\plus}\beta _{{11}} Look\;better_{{jt}} \cr & {\plus}\beta _{{12}} Feel\,better_{{ij}} {\plus}\beta _{{13}} Look\,better\,and\,feel\,better_{{jt}} \cr & {\plus}\beta _{{14}} DB{\rm \_0}_{{ij}} {\plus}\beta _{{15}} DB{\rm \_}S_{{ij}} {\plus}\beta _{{16}} DB{\rm \_}M_{{ij}} \cr & {\plus}\beta _{{17}} DB{\rm \_}L_{{ij}} {\plus}\beta _{{18}} HP{\rm \_0}_{{ij}} {\plus}\beta _{{19}} HP{\rm \_}S_{{ij}} \cr & {\plus}\beta _{{20}} HP{\rm \_}M_{{ij}} {\plus}\beta _{{21}} HP{\rm \_}L_{{ij}} {\plus}\beta _{{22}} Time\;per\;day_{{ij}} \cr & {\plus}\beta _{{23}} Time\;per\;day^{2} _{{ij}} {\plus}\beta _{{24}} Cost\;per\;week_{{ij}} _{i} {\plus}{\varepsilon}_{{ij}} , $$
where utility from the proposed lifestyle intervention programme is represented by V, characterised by different combinations of the attribute levels (Table 1). Subscript i denotes the individual respondent and j the alternatives within a choice set. β 0j is the alternative specific constant (ASC), showing the general preference to continue with current lifestyle if positive (given the coding). A negative β 0 would imply a general preference to change lifestyle. ɛ ij is the error term, assumed to be normally distributed. Effects coding was employed for ‘Content’, ‘Weight change after two years’, ‘Short-term goal’ and ‘Risk reduction in diabetes/high blood pressure’. ‘Time per day’ and ‘Costs per week’ were modelled as continuous variables. It was hypothesised that while individuals may enjoy time spent on lifestyle activities, this relationship may reach a peak, at which point utility/benefit would start to fall. To represent this potential non-linearity (Time per day)2 was also included.
Drawing on equation (1), WTP for a marginal change in one of the attributes of a DCE is estimated as  $${\minus}\left( {{{\beta _{i} } \over {\beta _{{Costs\,per\,week}} }}} \right)$$
. Thus, for example, from equation (1)
 $${\minus}{{\beta _{{10}} } \over {\beta _{{24}} }}$$
indicates WTP per week for a lifestyle intervention programme that will lead to losing one and half stone (9.6 kg) after two years.Footnote 1 Similarly,
 $${\minus}{{\beta _{2} } \over {\beta _{{24}} }}$$
indicates WTP for a lifestyle intervention that includes healthy eating with support for management.
 $${\minus}\left( {{{\beta _{0} } \over {\beta _{{Costs\,per\,week}} }}} \right)$$
indicates a preference to continue with the current situation if positive. WTP was estimated for a marginal change in all statistically significant attributes, with confidence intervals obtained from bootstrapping with 1000 replications.
Following estimation of WTP for marginal changes in individual components of a healthy lifestyle intervention, overall WTP was estimated for two illustrative lifestyle interventions (Box 1).
Hypothetical lifestyle interventions valued
Lifestyle 1 – involving: healthy eating; no weight change after two years; resulting in looking better; and no reduction in risks of Type 2 diabetes and high blood pressure; and spending 30 min/day on the intervention.
Lifestyle 2 – involving: healthy eating and physical activity; one and half stone (9.6 kg) weight loss after two years; looking and feeling better; moderate reduction in risks of Type 2 diabetes and high blood pressure; and spending 90 min/day on the intervention.
From a policy perspective, the question of who chooses the current situation is important – policy should be focused on those who always choose their current situation when objectively they need some sort of intervention. To model preference heterogeneity, the ASC was interacted with three socio-demographic indicators: BMI (underweight; normal; overweight and obese, as defined in Table 2), age (18–30; 31–45; 46–64) and gender. This allowed investigation of the characteristics of respondents who always chose their current situation. WTP for the defined lifestyle interventions above was estimated for these sub-groups, with confidence intervals again obtained from bootstrapping with 1000 replications.
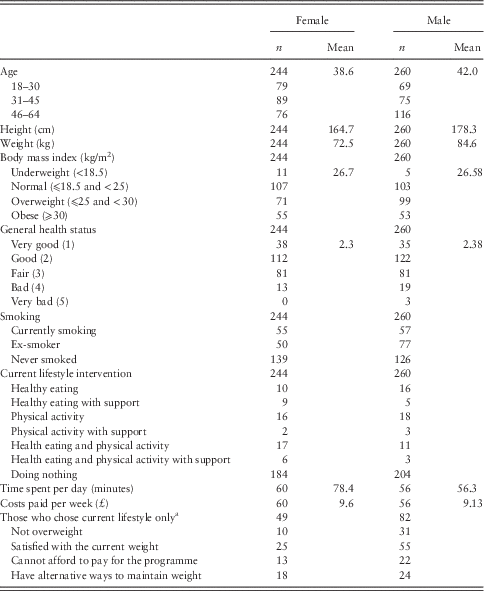
Characteristics of respondents
a Respondents could choose multiple responses.
3. Results and discussion
3.1 Respondent characteristics
Of 19,042 individuals invited to participate by email, 3642 individuals started the survey. Of these 452 were screened out by sampling rules: five were younger than 18 years, 26 were not in the United Kingdom, 12 were pregnant and 409 had missing values for the variables such as age and gender. In addition, 1962 attempted the survey after it closed (i.e. recruitment had reached its pre-specified target) and 191 and 184 were screened out because quotas for age and design block, respectively, had been met. Data on responses to choice questions were not available for 349 respondents owing to drop-out before completion. Of the individuals who dropped out before completion, 51% were male and the average age was 43. This was comparable to the final sample (52% males; average age 40). While distribution of gender was not statistically different between the two groups, drop-outs were slightly older than those who completed. The final data set comprised 504 respondents with 173, 166 and 165 in blocks 1, 2 and 3, respectively.
Table 2 presents characteristics of the 504 respondents. In all, 278 (55%) were overweight or obese, estimated by combining self-reported information on height and current weight (BMI). Given individuals are known to overestimate their height and understate their weight (Spencer et al., Reference Spencer, Appleby, Davey and Key2002) and the change in perceptions regarding what is a normal weight (Johnson et al., Reference Johnson, Cooke, Croker and Wardle2008), this may understate the number of overweight/obese respondents. In all, 131 respondents always chose their current lifestyle. There is concern in the literature that individuals choose the current situation as a way to complete the task quickly, with little information revealed about preferences. The average time to complete the survey was 16.1 minutes for those who chose Current Lifestyle for all choices and 16.6 minutes for 373 respondents who did not. This difference was not significantly different (p<0.41), suggesting those who always chose their current lifestyle did not ‘rush’ through the questionnaire (any quicker than those who did not always choose their current lifestyle).
The majority of respondents were not participating in a lifestyle intervention programme (79%), and for those who were physical activity was the preferred intervention. It is also worth noting that of the 131 respondents who consistently chose their Current lifestyle, 69% stated they were overweight, while 61% were satisfied with their current weight. These findings points to potential challenges in getting those who are overweight or obese to participate in lifestyle interventions programmes.
3.2 Analysis of DCE data
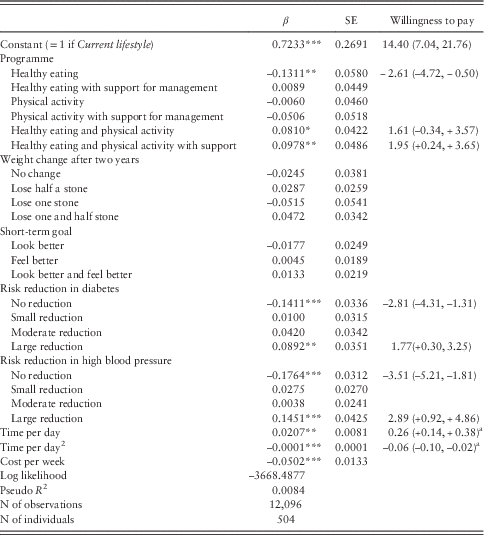
No respondent failed both rationality tests and all response data were used to estimate equation (1). Results from the probit model are presented in Table 3.
Probit regression results of preference for lifestyle interventions
Huber cluster heteroskasdasticity errors estimated around choices from the same respondents.
a Calculated at 30 min.
*p<0.10, **p<0.05, ***p<0.01.
The positive and significant constant implies a general preference for Current lifestyle. This suggests that, everything else being equal, respondents prefer to do what they are currently doing rather than participate in a new lifestyle intervention programme. This raises some important policy challenges. In the face of this mind set regarding preferences for the current situation, the notion that we can nudge people gently in the direction of making the health-improving changes to their lifestyle looks naive, and gives a real sense of the magnitude of the problem policymakers face. That is, policymakers are asking people to lead more austere lives to maintain a healthy weight and lose weight if overweight/obese. This may be defined as embracing the idea and practice of less benefits (e.g. pleasure and indulgence) and more disbenefits (restricting the intake of foods they enjoy eating, that tastes nice and denying themselves the bodily gratification this gives them, while doing more activities that they may find challenging). This may go some way to explaining why so many people value their current lifestyle, which is conceivably more pleasurable than the options on offer (from policy advice) that could help them to prevent obesity.
Further, current demographic data for countries such as the United Kingdom show that the prevalence of obesity increases with age up until people are in their 70s (Health and Social Care Information Centre, 2011; 2012). The preference for current lifestyles among those who are currently of normal weight suggests close observation is needed of this group since failure to change their lifestyle over time will exasperate the overweight/obesity problem.
Despite the overall preference to maintain current lifestyle, certain lifestyle interventions are more likely to be taken up.Footnote 2 There was a negative preference towards interventions including a healthy eating component alone, while those involving physical activity were preferred. This suggests that individuals regard increasing physical activity as the more acceptable solution for reducing weight, rather than reducing food intake. Swinburn et al. (Reference Swinburn, Sacks and Ravussin2009) argued that this philosophy has been promoted by the food industry and politicians. This is despite the evidence that reducing food intake is far more likely to reduce obesity than increasing physical activity (Westerterp and Speakman, Reference Westerterp and Speakman2008; Swinburn et al., Reference Swinburn, Sacks and Ravussin2009). It has been predicted that the amount of physical activity required by individuals to offset their food (over) consumption is unrealistic for obese individuals. For example, Speakman (Reference Speakman2010) stated that: ‘An obese person with a body mass index of 35 could reach a more healthy weight and BMI of 22 by reducing their calorie intake by one third. That is equivalent to exercising for around five hours a day. That is not realistic’.
Support for management of weight changes provided with either healthy eating or physical activity was also of limited value. Respondents in the qualitative research self-identified as overweight or obese, and most reported considerable past weight-loss experience. Thus, this may have been more important for them than for our general population. However, from a policy perspective it should be noted that results from RCTs and systematic reviews suggest that support for management (behaviour change support) of weight change is important in terms of promoting and maintaining weight loss (Avenell et al., Reference Avenell, Broom, Brown, Poobalan, Aucott, Stearns, Smith, Jung, Campbell and Grant2004).
No preference was identified for ‘Weight change after two years’. This finding may reflect the fact that this is a general population survey, or that participants favour rapid weight loss rather than a gradual loss of weight. The latter interpretation is consistent with the findings of Greener et al. (Reference Greener, Douglas and van Teijlingen2010). There is also emerging evidence to suggest that some obese individuals do not perceive themselves to be overweight, particularly men (Kuchler and Variyam, Reference Kuchler and Variyam2003; Miller et al., Reference Miller, Schulz, Bibeau, Galka, Spann, Martin, Aronson and Chase2008).
The finding that the ‘short-term goal’ attribute was not significant may reflect the fact that respondents would decide themselves about whether a defined amount of weight loss would make them look and feel better. An alternative approach would be to value such ‘internal states’ indirectly. For example, in a study on the value of ‘knowing you have done everything possible to have a child’ following fertility treatment, respondents were asked to state their level of agreement with statements relating to internal states. Regression techniques were then employed to relate agreement with such statements to WTP for infertility treatment (Ryan, Reference Ryan1998). Within the context of this study, respondents would be asked to respond to internal statements such as ‘if I lose weight I will look and feel better’, and responses could be used to explain preferences.
As expected, respondents had a negative preference for programmes with no risk reduction for type 2 diabetes or high blood pressure, whereas those resulting in a large reduction were preferred.
The positive significant coefficient on ‘Time per day’ and the negative significant coefficient on ‘Time per day 2’ implies that respondents liked to spend some time on a lifestyle intervention programme to achieve goals (in terms of preparation, travel and activity on the programme), up to a given point, after which time utility would start to fall.Footnote 3 Using the coefficients from Table 3, this can be calculated as 79 minutes.Footnote 4 Thus, up to 79 minutes/day, utility from participation in lifestyle interventions increases, after that it falls. This gives insight into the time individuals are willing to spend on lifestyle intervention programmes.
The ‘Costs per week’ attribute is negative, implying lower costs are preferred. Table 3 (column 4) shows WTP per week for different components of a lifestyle intervention. The positive WTP for the ASC indicates that respondents are willing to pay £14.40/week to continue with their current lifestyle rather than take up a lifestyle intervention programme. A negative overall WTP implies respondents are worse off if the programme is implemented, and they would require compensation by that amount of money to remain on the same level of utility. For example, the negative WTP of –£2.61/week from a programme with Healthy eating implies that everything else equal, respondents would be worse off if they moved from their current lifestyle to that new lifestyle intervention with a content of Healthy eating, and they would have to be compensated by £2.61/week, in addition to £14.40 for moving from their current situation to a new situation, to leave them on the same level of utility, that is to ensure they were no worse off (reflecting a general preference to continue doing what they are currently doing). However, respondents do value reducing the risk of diabetes and high blood pressure, and they would be willing to pay £1.61/week for a programme providing ‘Healthy eating and physical activity’ and £1.95/week for a programme providing Healthy eating and physical activity with support. Similarly with risk reduction, while respondents were willing to pay for large reductions in the risk of diabetes and high blood pressure, programmes that led to no reduction resulted in a negative WTP (i.e. they had to be compensated).
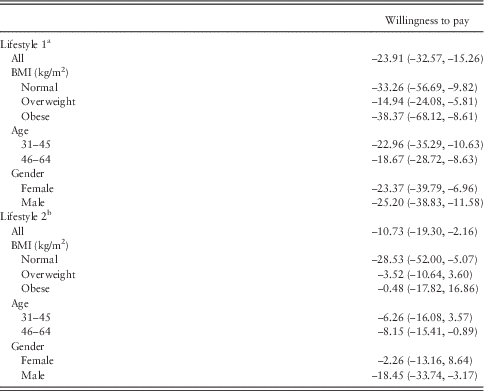
These values were used to estimate WTP for different lifestyle intervention programmes – WTP for choosing Lifestyle 1 intervention is −£23.91/week and for Lifestyle 2 −£10.73/week (Table 4). The negative value suggests compensation is required to encourage participation in lifestyle interventions, that is respondents must be compensated (or paid) £23.91/week to encourage them to participate in Lifestyle 1 and £10.73/week in Lifestyle 2. Financial compensation (or WTP) required to encourage participation varies according to the characteristics of respondents. For example, those of normal weight and men require higher levels of compensation to participate in healthy lifestyles.
Willingness to pay (WTP) for lifestyle interventions
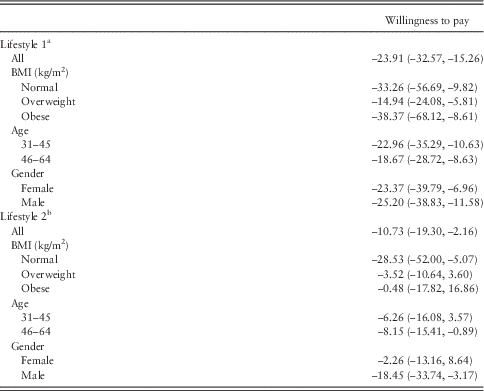
BMI=body mass index.
The model would not converge for underweight or 18–30 age group. Confidence intervals were obtained from bootstrapping with 1000 replications.
a Involving: healthy eating; no weight change after two years; resulting in looking better and no reduction in risks of Type 2 diabetes and high blood pressure; and spending 30 min/day on the intervention.
b Involving: healthy eating and physical activity; one and half stone (9.6 kg) weight loss after two years; looking and feeling better; moderate reduction in risks of Type 2 diabetes and high blood pressure; and spending 90 min/day on the intervention.
These results suggest that one way of incentivising weight loss that a policy maker (with the necessary financial resources) can implement is paying individuals to participate in healthy lifestyles/adopt healthier dietary and physical activity behaviours, or reducing the cost of a healthier diet. Our results also suggest that different monetary incentives may be required for different groups within society. The use of financial incentive schemes to induce individuals to take up healthy lifestyles may be cost-effective and is clearly an important area for future research. For example, attendance at many commercial weight loss organisations in the United Kingdom costs ~£5/week, whereas the cost of the weight-loss drug orlistat alone is £7.92/week (2010 prices), and the evidence suggests it results in comparable weight loss (National Institute for Health and Clinical Excellence, 2006). Providing free attendance at commercial slimming organisations may be a useful incentive and be cost saving for the NHS compared with alternative interventions.
This study was not set-up to investigate the role of financial incentives – a price proxy was included to look at the monetary value of lifestyle interventions (in much the same way economists have looked at the monetary value of a numbers of goods and services). However, unlike most applications, negative values were generated; implying compensation is required to encourage the uptake of a service. This finding suggests that interventions to improve lifestyles may need to be coupled with incentive packages that encourage uptake and adherence (as well as possibly maintenance of initial good outcomes). Future studies could also explore the importance of financial payments within stated preference experiments, with the price proxy being defined in terms of financial payments to respondents. They may also explore the mechanism by which the incentive is given as individuals may have preferences not just about the size of the incentive but also about how it is delivered, for example, cash, vouchers, stepped payments, etc.
While the DCE produced some important findings for policymakers concerned with inducing individuals to adopt healthy lifestyle, a number of potential limitations of the DCE are recognised. The results are based on responses to hypothetical questions. The importance of validating the DCE results using subsequent monitoring and evaluation of policies has been recognised (de Bekker-Grob et al., Reference de Bekker-Grob, Ryan and Gerard2012). Future work should explore the external validity of DCE. Given individuals are used to paying for lifestyle interventions, this area offers a potentially fruitful area for future empirical research. The pilot work suggested respondents had difficulty understanding risk, resulting in a qualitatively described attribute. It is recognised that individuals may have attached different risk levels to the different qualitative descriptions. Future work should explore how quantitative risk data can be better described to individuals within a DCE.
4. Conclusion
This study applied the DCE methodology to look at preferences for lifestyle interventions regarding diet and physical activity.Footnote 5 A key finding was that paying people to participate could increase uptake of exercise and dietary lifestyle interventions. Preferences varied according to the characteristics of respondents, suggesting different groups would require different incentives to achieve a given take up. Men required more compensation than women – within the United Kingdom this is the group with the biggest health problems, and the most pressing policy issues. Further, those of normal weight required the highest levels of compensation. While this is not surprising, given that weight increases with age, such individuals will need to make changes to their lifestyle to prevent them from becoming overweight/obese. If lifestyle changes are not made the obesity problem we are currently experiencing looks set to continue. Our finding that people prefer physical activity and diet to dietary changes alone and that there is limited support for behavioural support for lifestyle interventions is also important (as the evidence suggests that diet and behavioural support are effective in reducing obesity), raising questions regarding which type of policy interventions will more effectively deal with the obesity epidemics. Policymakers clearly face challenges in inducing people to change their behaviour and adopt healthy lifestyles.
Acknowlegement
We would like to thank all respondents to the discrete choice experiment (DCE) questionnaire and Tamara Brown and Joe Greener for their contribution to the stages of the project that informed the attributes and levels for the DCE. This work was conducted as part of PROGRESS (Prevent Obesity GRowing Economic Synthesis Study) which was funded by the National Preventative Research Initiative and the Universities of Aberdeen and Melbourne. The PROGRESS group consists of the following applicants: Alison Avenell, University of Aberdeen Health Services Research Unit (HSRU), Mandy Ryan, University of Aberdeen Health Economics Research Unit (HERU), Luke Value, University of Aberdeen HERU and HSRU, Lorna Aucott and Flora Douglas, University of Aberdeen, Section of Population Health, Edwin van Teijlingen, Bournemouth University, Alison Goode and Kostas Mavromaras, University of Adelaide and Matt Sutton, University of Manchester. HERU and HSRU are core funded by the Chief Scientist’s Office of the Scottish Government Health and Social Care Directorates. AA was funded by a Career Scientist award from the Scottish Government Health Directorates.
Appendix: Background information provided in DCE
The average weight of people in the United Kingdom is increasing, resulting in an increase in the number of obese people. This has lead to concerns concerning the effect of obesity on people’s health. One reason for the increase in obesity is the way we live our lives.
In this questionnaire we are interested in your preferences for different ways you might change your lifestyle in order to prevent obesity. The choices presented below refer to lifestyle intervention programmes to reduce or prevent obesity, involving a three- to six-month intensive course and longer-term follow-up. The components of the programme are:
What the programme contains – the programme may involve advice and training on: healthy eating, physical activity and/or support for management of stressful situations.
▪ Healthy eating – nutritionally balanced (e.g. more vegetables and fruit, low fat and less intake per day) and regular meals.
▪ Physical activity – enhance energy used up by increasing daily activities (e.g. walking or cycling to work).
▪ Support for management of weight changes – how a person responds to stress is important. The intervention will teach you how to manage stressful situations and practical skills for eating a healthier diet and being more active.
Weight change after two years – the amount your weight has changed two years after you commit to the lifestyle intervention programme.
Short-term goals – as a result of participation in the lifestyle intervention programme, you may feel better and/or look better. For example, you look better because you wear smaller size clothes or because you are fitter; or you feel better because it is easier to do things or you enjoy cooking or interacting with people for sports.
Reduced chance of developing type 2 diabetes – diabetes mellitus is a condition caused by a higher than normal level of blood sugar. Diabetes can be a potential cause of medical problems such as damaged vision, kidney failure, heart diseases and so forth. Type 2 diabetes is associated with obesity and often managed by exercise and healthy diet.
Improvement in blood pressure – high blood pressure increases the risk of heart attack, heart failure and stroke. Normal blood pressure is 120 over 80 mm/Hg and it naturally increases with age.
Time per day – time spent during a day on the lifestyle intervention (e.g. preparation, travel and activity for the programme).
Costs per week – we are concerned with how much you value lifestyle intervention programmes to reduce or prevent obesity. One way of knowing this is to ask you how much you would be willing to pay for the programme. Please consider what you would be personally willing and able to pay for the programme you choose.*Remember that any money you spend on this programme will not be available to spend on other things.