


INTRODUCTION
Rock glaciers are assemblages of ice and rock debris that are common, characteristic, and significant landforms in high mountain environments (Giardino et al., Reference Giardino, Shroder and Vitek1987; Giardino and Vitek, Reference Giardino and Vitek1988; Stine, Reference Stine2013). Debris liberated from bedrock outcrops through freeze-thaw weathering is transported by slope processes to the upper parts of rock glaciers, where it accumulates (Gärtner-Roer, Reference Gärtner-Roer2012). Ice accumulates in the interstices of these deposits through the refreezing of infiltrating water and burial of snow (Tenthorey, Reference Tenthorey1992; Isaksen et al., Reference Isaksen, Ødegård, Eiken and Sollid2000; Humlum et al., Reference Humlum, Christiansen and Juliussen2007). Deformation of internal ice and the high hydrostatic pressure of water trapped between confining layers allow this material to move downslope (Wahrhaftig and Cox, Reference Wahrhaftig and Cox1959; Giardino, Reference Giardino1983). Thus, rock glaciers represent an important step in a suite of processes responsible for generating and transporting coarse debris in alpine landscapes (Caine, 1974).
Rock glaciers have significant climatic implications because of their genetic connection with perennial ice. Modern rock glaciers provide information about climatic conditions and the presence of permafrost in alpine landscapes (Humlum, Reference Humlum1998; Janke, Reference Janke2007; Millar and Westfall, Reference Millar and Westfall2008). Paleoclimate information can be derived from the distribution of fossil rock glaciers, which are preserved on the landscape as mappable features after ice meltout (e.g., Blagbrough and Farkas, Reference Blagbrough and Farkas1968; Blagbrough, Reference Blagbrough1994; Nicholas and Butler, Reference Nicholas and Butler1996; Refsnider and Brugger, Reference Refsnider and Brugger2007). Where accessible, the ice within rock glaciers constitutes a unique paleoclimate archive (Clark et al., Reference Clark, Steig, Potter, Updike, Fitzpatrick and Clark1996; Krainer et al., Reference Krainer, Bressan, Dietre, Haas, Hajdas, Lang and Mair2015). Changes in rates of rock glacier movement can also be measured and connected back to climate forcing (Kääb et al., Reference Kääb, Frauenfelder and Roer2007; Liu et al., Reference Liu, Millar, Westfall and Zebker2013; Müller et al., Reference Müller, Vieli and Gärtner-Roer2016).
From an ecological perspective, rock glaciers provide crucial microhabitats for cold-adapted plants and animals (Millar and Westfall, Reference Millar and Westfall2010). As mountain climates warm, this role will be enhanced, and rock glaciers could serve as refugia for species that would otherwise be extirpated from mountain summits (Millar et al., Reference Millar, Westfall, Evenden, Holmquist, Schmidt-Gengenbach, Franklin, Nachlinger and Delany2015).
Hydrologically, the presence of rock glaciers alters the properties and amount of runoff in high mountain watersheds in pronounced ways (Corte, Reference Corte1976; Geiger et al., Reference Geiger, Daniels, Miller and Nicholas2014). Water discharging from rock glaciers also has a distinct geochemical signature (e.g., Giardino et al., Reference Giardino, Vitek and DeMorett1992; Williams et al., Reference Williams, Knauf, Caine, Liu and Verplanck2006, Reference Williams, Knauf, Cory, Caine and Liu2007; Caine, Reference Caine2010; Barnes et al., Reference Barnes, Williams, Parman, Hill and Caine2014). Rock glaciers may constitute previously overlooked sources of surface water in high mountain environments (Leopold et al., Reference Leopold, Lewis, Dethier, Caine and Williams2015; Rangecroft et al., Reference Rangecroft, Harrison and Anderson2015; Janke et al., Reference Janke, Ng and Bellisario2017; Jones et al., Reference Jones, Harrison, Anderson, Selley, Wood and Betts2018).
Previous work, including extensive field mapping, has documented that rock glaciers are common in the Uinta Mountains of northeastern Utah (Grogger, Reference Grogger1975; Munroe and Laabs, Reference Munroe and Laabs2009). Springs of consistently cold-water discharge from these features (Munroe, Reference Munroe2002), and lake sediments record multiple pulses of rock glacier activity during the Holocene (Munroe et al., Reference Munroe, Klem and Bigl2013). This study expands upon this work with the complementary objectives of better understanding the factors controlling the distribution of rock glaciers in these mountains, and evaluating the possibility that ice melting within these features constitutes an overlooked contribution to rivers feeding the Colorado River System and the Great Salt Lake. The project combined: (1) a dedicated effort to inventory Uinta rock glaciers and evaluate their topographic setting; (2) a monitoring campaign to compile evidence for the presence of ice within these rock glaciers; and (3) a geochemical comparison of water discharging from rock glaciers with an extensive database of surface water measurements. Researchers working in other areas have compiled inventories of rock glaciers (Johnson et al., Reference Johnson, Thackray and Van Kirk2007; Millar and Westfall, Reference Millar and Westfall2008; Janke et al., Reference Janke, Bellisario and Ferrando2015), utilized GIS methods to evaluate the climatic settings where rock glaciers are found (Janke, Reference Janke2007; Johnson et al., Reference Johnson, Thackray and Van Kirk2007; Millar and Westfall, Reference Millar and Westfall2008), compiled evidence that water discharge from rock glaciers is sourced from melting ice (Williams et al., Reference Williams, Knauf, Caine, Liu and Verplanck2006; Caine, Reference Caine2010; Leopold et al., Reference Leopold, Lewis, Dethier, Caine and Williams2015), and considered rock glacier contributions to modern surface hydrology (Geiger et al., Reference Geiger, Daniels, Miller and Nicholas2014; Rangecroft et al., Reference Rangecroft, Harrison and Anderson2015). This is the first study, however, to combine all of these themes in a single investigation.
BACKGROUND
Terminology
Capps (Reference Capps1910) first promoted the concept of a rock glacier as a mobile assemblage of ice and rock debris. Drawing on field observations in southeastern Alaska, he described elongate concentrations of coarse rubble with characteristic surface furrows emanating from cirques (Capps, Reference Capps1910). Excavations revealed that the rocks comprising these features were cemented by interstitial ice, assumed to result from freezing of infiltrating rain and snowmelt (Capps, Reference Capps1910). Half a century later, Wahrhaftig and Cox (Reference Wahrhaftig and Cox1959) greatly expanded on this concept in a paper that spawned a tremendous amount of subsequent research (Stine, Reference Stine2013).
Since that time, debate over rock glacier terminology and genesis has been a consistent theme, and much effort has gone into reconciling two contrasting models of rock glacier formation. In one model, derived from the seminal work of Capp (Reference Capps1910) and Wahrhaftig and Cox (Reference Wahrhaftig and Cox1959), “ice-cemented” rock glaciers are periglacial features formed when talus is cemented by interstitial ice capable of undergoing internal deformation (Barsch, 1987). Liquid water under hydrostatic pressure between confining layers within the rock glacier may also play a role in movement (Giardino, Reference Giardino1983). In the contrasting model, rock glaciers are “ice-cored” features produced when a valley glacier is buried by supraglacial debris (e.g., Potter, Reference Potter1972; Ackert, Reference Ackert1998; Potter et al., Reference Potter, Steig, Clark, Speece, Clark and Updike1998; Krainer and Mostler, Reference Krainer and Mostler2000). A persistent challenge is that it is rarely possible to distinguish between these two origins in glaciated areas without a drilling campaign (e.g., Janke et al., Reference Janke, Bellisario and Ferrando2015) or extensive geophysical investigations (e.g., Potter et al., Reference Potter, Steig, Clark, Speece, Clark and Updike1998; Leopold et al., Reference Leopold, Williams, Caine, Völkel and Dethier2011).
In reality, ice-cored and ice-cemented rock glaciers likely inhabit opposite ends of a continuum of related landforms. In light of this, it has been suggested that rock glaciers should simply be defined as “the visible expression of cumulative deformation by long-term creep of ice/debris mixtures under permafrost conditions” (Berthling, Reference Berthling2011, p. 103). This proposal neatly combines the long-standing practice of identifying rock glaciers with visible criteria, the dynamic criterion that active rock glaciers move downslope, and the climatic implication that rock glaciers are a product of permafrost conditions.
Geologic setting
The Uinta Mountains (hereafter the “Uintas”) are located in northeastern Utah, where they extend for approximately 200 km along an east-west axis from the Wasatch Range into northwestern Colorado (Fig. 1). The bedrock of the Uintas is a 4–7-km-thick sequence of Precambrian siliciclastic rocks, ranging from shale to conglomerate, that was uplifted in the Laramide Orogeny (Sears et al., Reference Sears, Graff and Holden1982; Bradley, 1995; Dehler et al., Reference Dehler, Porter, De Grey, Sprinkel and Brehm2007). These rocks, which are bedded at centimeter to multi-meter scales, are folded into an asymmetrical anticline that shares an axis with the main ridgeline of the mountains. Bedding on the south flank of the range dips gently to the south, whereas layers on the north flank dip more steeply northward.
Distribution of rock glaciers (black polygons) in the Uinta Mountains. Major rivers (gray lines) and hillshaded digital elevation model (DEM) are shown for reference. (1) RG-1, (2) RG-2, and (3) the third rock glacier in the northwestern Uintas are labeled in white. The circle marks the location of the Chepeta SNOTEL station. Lakes in the water chemistry database are denoted as: C, Upper Coffin Lake; D, Dean Lake; F, Fish Lake; N, No Name Lake; and W, Walk Up Lake. Inset shows the location of the larger map within the state of Utah. For reference, the gray polygon in the northwest is the Great Salt Lake.
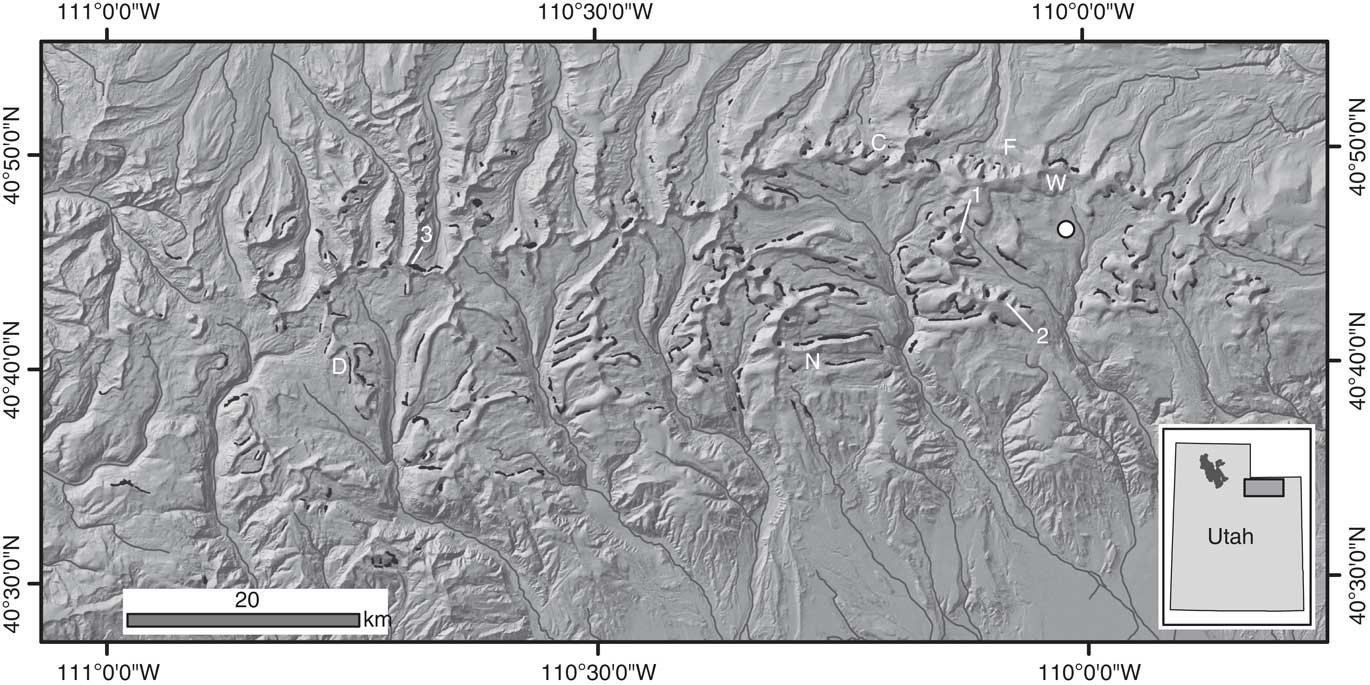
No glaciers remain in the Uintas today, but spectacular glacial geomorphology attests to the presence of more than 2000 km² of erosive valley glaciers during the Last Glacial Maximum (Munroe and Laabs, Reference Munroe and Laabs2009). The largest of these Pleistocene glaciers covered more than 250 km² and had lengths in excess of 40 km (Laabs and Carson, Reference Laabs and Carson2005; Munroe, Reference Munroe2005; Laabs et al., Reference Laabs, Refsnider, Munroe, Mickelson, Applegate, Singer and Caffee2009). Cosmogenic 10Be surface-exposure dating indicates that these glaciers began to retreat from their terminal moraines around 18,000 years ago (Laabs et al., Reference Laabs, Refsnider, Munroe, Mickelson, Applegate, Singer and Caffee2009), and radiocarbon dating of basal lacustrine sediments reveals that deglaciation was mostly complete by 14,000 years ago (Munroe and Laabs, Reference Munroe and Laabs2017). Since that time, the higher elevations of the Uintas have been dominated by a strongly periglacial climate, with mean annual temperatures<0°C and frequent freeze-thaw cycles (Munroe, Reference Munroe2006).
Rock glaciers
Freeze-thaw weathering liberates abundant rock debris from near-vertical exposures of bedrock in cirque headwalls and along the walls of U-shaped glacial valleys. This rubble accumulates at the base of these exposures, where it forms extensive talus with smooth slopes standing at the angle of repose. Rock glaciers, exhibiting characteristic bulging morphology with surface furrows and oversteepened frontal slopes, locally interrupt the smooth talus profile (Fig. 2). The movement of rock glaciers generates surface furrows (Kääb and Weber, Reference Kääb and Weber2004) and the bulging morphology, where the rock glacier extends outward from the base of adjacent talus. Frontal slopes of these rock glaciers often display a characteristic bi-level stratigraphy with an open-work of coarser (0.5–3 m) boulders overlying a diamicton with clasts supported in a sandy matrix (Janke et al., Reference Janke, Bellisario and Ferrando2015). Weathering and lichen growth render the surface rocks a dark gray that contrasts strongly with the fresher material exposed lower in the frontal slope, which displays the red colors typical of Uinta bedrock (Fig. 2). This combination of surface furrows, notably steep frontal slopes, bulging morphology, and bi-level stratigraphy clearly distinguishes rock glaciers from talus and other colluvial landforms and enables mapping of rock glaciers on visual imagery.
Representative photographs of Uinta Mountain rock glaciers. (A) Oblique Google Earth view of RG-1. This tongue-shaped rock glacier is ~500 m long. (B) Field photograph of the frontal slope of RG-1. The rock glacier frontal slope exhibiting characteristic bi-level stratigraphy is approximately 20 m high. Note yellow tent in lower right for scale. (C) Oblique Google Earth view of RG-2. Note the light colored, steep section of the frontal slope. This tongue-shaped rock glacier is ~600 m long. (D) Field photograph of the frontal slope of RG-2. The bi-level stratigraphy of darker, lichen-covered rocks overlying lighter colored, more recently exposed material is prominent. (E) Oblique view across a typical rock glacier complex in the northwestern Uintas. Black arrow denotes the rock glacier lobe where bottom temperature of snow (BTS) measurements were collected in 2009. (F) Field photograph of the rock glacier highlighted in panel E. The frontal slope of this feature is 30 m tall. (For interpretation of the references to color in this figure legend, the reader is referred to the web version of this article.)
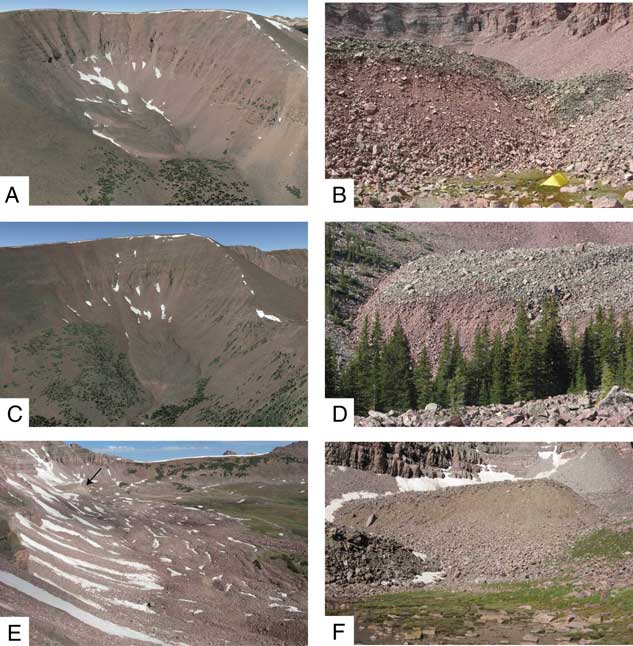
Rock glaciers can be divided into two groups with contrasting morphologies (Wahrhaftig and Cox, Reference Wahrhaftig and Cox1959). “Tongue-shaped” rock glaciers have steep slopes on three sides, representing a volume of debris and ice that has moved outward across a valley floor from an accumulation zone (Outcalt and Benedict, Reference Outcalt and Benedict1965). In contrast, “lobate” rock glaciers have a single slope with maximum steepness, delineating a bulge of rock debris protruding from an otherwise smooth talus (Outcalt and Benedict, Reference Outcalt and Benedict1965). Some workers have suggested that lobate/valley wall rock glaciers equal ice-cemented rock glaciers, and that tongue-shaped rock glacier are equivalent to ice-cored rock glaciers in a genetic classification (Martin and Whalley, Reference Martin and Whalley1987; Hamilton and Whalley, Reference Hamilton and Whalley1995). Evaluating this possibility is beyond the scope of this project, but these two morphological classes are nonetheless distinguished in this project for consistency with established rock glacier nomenclature.
METHODS
Mapping and GIS analysis
An inventory of rock glaciers in the Uinta Mountains was compiled from seamless, visual-spectrum, aerial imagery at a scale of 1:5000. Rock glaciers were identified by scanning the bases of steep bedrock slopes and talus, searching for locations where the normal smooth talus profile is interrupted by a notably steep-fronted bulge with reduced lichen cover, where the talus appears wrinkled, and where furrows and other evidence of movement are apparent. Areas exhibiting these characteristics were delineated as polygons in ArcMap GIS. Although some previous studies have attempted to distinguish active (flowing) from inactive and fossil rock glaciers based on landform “freshness” and steepness of the frontal slope (e.g., Giardino and Vitek, Reference Giardino and Vitek1988; Janke, Reference Janke2007; Millar and Westfall, Reference Millar and Westfall2008), such distinctions are inherently subjective in the absence of repeat surveys, and were not employed in this study.
Some workers have used the term “protalus lobes” for rock glacier-like features that are wider than they are long, arguing that “true” rock glaciers are longer than they are wide (e.g., Martin and Whalley, Reference Martin and Whalley1987; Hamilton and Whalley, Reference Hamilton and Whalley1995; Whalley and Azizi, Reference Whalley and Azizi2003). Given this rigid geometric definition, many features mapped as rock glaciers in the Uinta Mountains would fall in the protalus lobe category. Because the goal in this study was to compile an inventory of coarse debris features exhibiting evidence of movement (steep frontal slopes, bulging morphology, surface furrows), however, distinctions based on length/width ratios were not employed. All features exhibiting these characteristics, regardless of geometry, were mapped, matching the approach employed in some similar range-wide inventories (e.g., Millar and Westfall, Reference Millar and Westfall2008; Jones et al., Reference Jones, Harrison, Anderson, Selley, Wood and Betts2018).
Mapped rock glacier polygons were attributed in the GIS with an estimate for the average aspect, divided into eight classes (N, NE, E, SE, S, SW, W, and NW). Each rock glacier was also classified as exhibiting either a lobate or tongue-shaped morphology (Wahrhaftig and Cox, Reference Wahrhaftig and Cox1959). The area of each polygon (in ha) was measured in the GIS. Zonal statistics were calculated for the intersection of these polygons and a seamless, 10-m digital elevation model (DEM) for the Uinta Mountain region, generating elevation information for each rock glacier polygon. The 10-m DEM was processed with Solar Analyst to calculate the annual solar duration at each cell in the raster. Zonal statistics were calculated for this solar duration raster to determine the average solar exposure (in hr/yr) of each rock glacier. Derivative rasters for slope and aspect were generated from the 10-m DEM and processed using zonal statistics for each rock glacier polygon. Finally, an 800-m PRISM grid for mean annual temperature (MAT), clipped to the study area, was converted to 100-m resolution using bilinear resampling, and zonal statistics were calculated to yield an estimated MAT for each rock glacier polygon.
Statistical analysis of the rock glacier inventory was conducted using SPSS software. Descriptive statistics were calculated for the overall rock glacier dataset, for the lobate- and tongue-shaped rock glacier subsets, and for the eight aspect classes. The statistical significance of differences between lobate and tongue-shaped rock glaciers, and between northerly and southerly aspects, was evaluated using a Mann-Whitney U-test. A nonparametric test was utilized given the unequal sizes of two datasets and the non-normal distributions of some of the datasets. A P value of 0.05 was used as a significance threshold.
Field and lab methods
Several rock glaciers were studied in the field to evaluate whether they contain ice. These features were selected based on their strongly developed morphology, their accessibility, prior work, and the presence of springs discharging cold water from their termini. RG-1 (~3500 m asl elevation) and RG-2 (~3350 m asl) are tongue-shaped rock glaciers located in the southeastern Uintas (Fig. 1 and 2). Waterproof data loggers (Onset Optic Stowaway and Hobo Water Temperature Pro v2) were programmed to record temperature at intervals from 1 to 4 hours and submerged in the outlet streams of these features. Shading by surrounding rocks ensured that these loggers were not exposed to direct sunlight. Retrieval and downloading of the loggers in subsequent years yielded time-series of water temperature.
Data loggers were also deployed on the surface of RG-1 and RG-2 to measure temperature at the base of the snowpack during the winter. Additionally, in an earlier phase of the project, loggers were deployed on a third rock glacier approximately 50 km to the northwest from RG-1 and RG-2 (Fig. 1). This feature, which was described by Munroe (Reference Munroe2002), is a prominent lobe within a rock glacier complex at an elevation of 3460 m asl (Fig. 2). In all three locations, identical data loggers were deployed at nearby non-rock glacier sites to serve as controls, and air temperature above the snowpack was recorded. Data from the Chepeta SNOTEL (Snowpack Telemetry) station (8 km northeast of RG-1 and RG-2, ~3200 m asl; Fig. 1) provides information about depth and duration of snow cover during deployment of the data loggers.
The age of the water discharging from RG-1 and RG-2, along with a neighboring talus, was evaluated with tritium and 3He dating (Schlosser et al., Reference Schlosser, Stute, Dörr, Sonntag and Münnich1988). Diffusion samplers were deployed in the water for a minimum of 24 hours in the late summer of 2011 and 2013, and water samples were collected for tritium measurements. Sampling was conducted in late summer to avoid the pulse of water associated with snowmelt (Krainer et al., Reference Krainer, Mostler and Spötl2007), increasing the likelihood of detecting a contribution from melting of perennial ice within the rock glacier. Samples were analyzed for tritium content and dissolved gasses in the Dissolved and Noble Gas Laboratory at the University of Utah.
Finally, samples of the water discharging from RG-1 and RG-2 in late summer 2013 were analyzed at the Soil, Water, and Plant Testing Lab at Colorado State University. Results were compared with an unpublished, long-term (2005–2011) monitoring database for Uinta surface water maintained by the United States Forest Service. Five lakes in this dataset, at elevations from 3263 to 3394 m asl, were represented by ≥10 samples. Samples from these lakes were visually compared with rock glacier water using boxplots, and mean values for all five lakes were compared with mean water values for rock glaciers using a Mann-Whitney test.
RESULTS
Inventory of rock glaciers
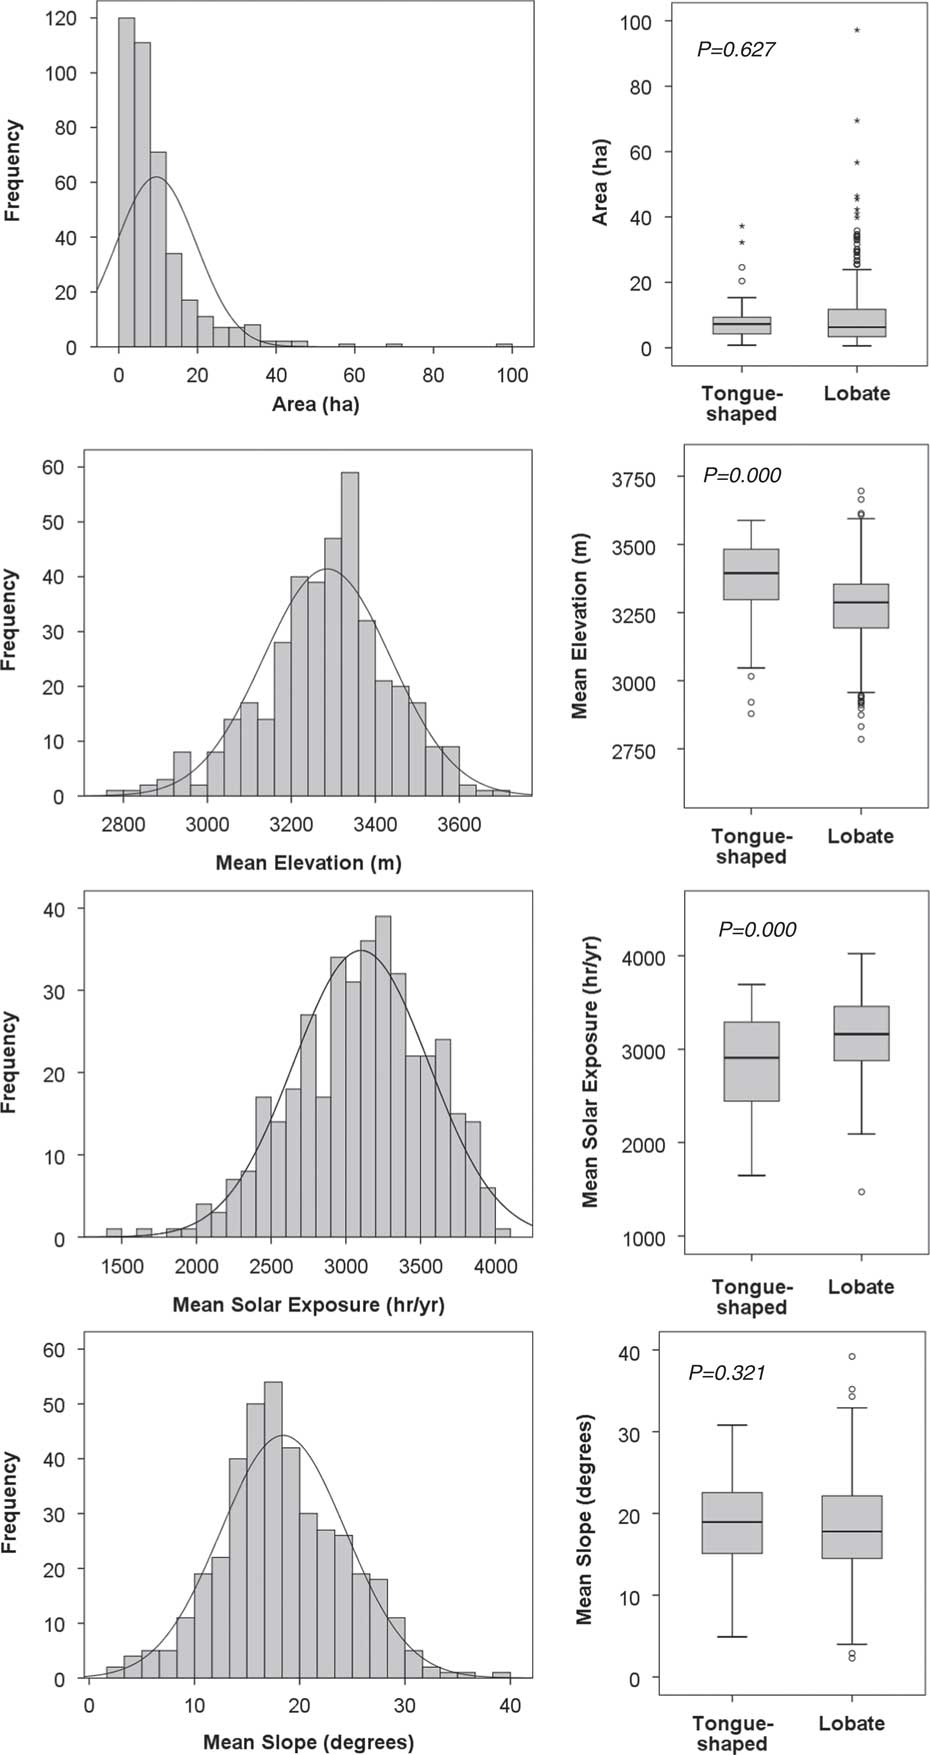
The inventory of rock glaciers in the Uinta Mountains contains 395 separate features (Fig. 1; Table 1). The mean area of the rock glaciers is 9.5 ha (minimum of 0.6 ha and maximum of 97.2 ha) with a skewness of 3.4 (Fig. 3). The median area of the rock glaciers is 6.5 ha. The overall mean elevation of the rock glaciers is 3285 m asl (range from 2785 to 3696 m asl), with a skewness of -0.4 (Fig. 3). The lowest rock glacier extends to an elevation of 2715 and the highest reaches 3744 m asl. Mean slopes of rock glaciers average 18.4° with a range from 2.3 to 39.2° (Fig. 3). On average, rock glaciers receive 3102 hours of direct sunlight per year (range for individual rock glaciers averages 1473 to 4024 hr/yr). The most shadowed part of a mapped rock glacier receives just 559 hr/yr, and the most exposed part receives 4191 hr/yr. The average mean annual temperature (MAT) at the rock glaciers, estimated from the resampled PRISM grid, is -1.0°C (range from -4.2 to 1.8°C), and 86% of the rock glaciers have MAT<0°C. Nearly a quarter (23%) of the rock glaciers have northerly aspects; 46% are oriented from northwest to northeast, whereas only 26% are oriented from southwest to southeast (Fig. 4).
Histograms of Uinta rock glaciers by area (ha), mean elevation (m asl), mean solar exposure (hr/yr), and mean slope (degrees). Normal distributions are shown for reference. Right column displays boxplots for tongue-shaped and lobate rock glaciers for these same four metrics. Two-tailed P values from a non-parametric Mann Whitney test are presented.
Radar plot of rock glacier aspects, binned to 8 aspect classes: N, NE, E, SE, S, SW, W, and W. Solid black line presents all rock glaciers (n=395). Gray line with circles presents the subset (n=335) of lobate rock glaciers. Gray line with diamonds presents the subset (n=60) of tongue-shaped rock glaciers, which are dominated by aspects from north to east.

Mean values for rock glacier metrics and comparison between types.

a Two-tailed.
Sixty of the mapped rock glaciers (15%) exhibit a tongue-shaped morphology, characterized by a strongly defined frontal bulge with steep slopes that continue around the sides, delineating a tongue that is clearly separate and distinct from the surrounding talus. In contrast, 335 of the rock glaciers (85%) are lobate forms, exhibiting just a frontal bulge where they protrude from the base of a talus. Tongue-shaped rock glaciers are found at significantly higher elevations (mean of 3365 versus 3271 m, P=0.000) and receive significantly less direct solar radiation each year than lobate rock glaciers (mean of 2857 versus 3146 hours, P=0.000, Fig. 3, Table 1). No tongue-shaped rock glacier has an average solar exposure greater than 3693 hr/yr; in contrast, lobate rock glaciers receive up to 4024 hours of direct sunlight per year (Fig. 3). Tongue-shaped rock glaciers exist in slightly colder locations (MAT of -1.1°C, versus -0.9°C for lobate rock glaciers), but this difference is not significant (P=0.083). Lobate rock glaciers have an aspect distribution that is nearly identical to that of the full rock glacier dataset (Fig. 4). In contrast, tongue-shaped rock glaciers are concentrated in aspect classes of north (32%), northeast (18%), and east (20%). Only 13% of the tongue-shaped rock glaciers are oriented between southwest and southeast. The mean elevation of tongue-shaped rock glaciers facing northwest, north, and northeast is not significantly different than that of tongue-shaped rock glaciers oriented to southeast, south, and southwest (P=0.728).
Temperature data loggers
Data loggers successfully generated long time-series of water temperature measurements (Fig. 5). One data logger was deployed at RG-1, as close to the discharge point as possible from late August 2011 through mid-August 2013. Another logger ran from late summer 2011 through the fall of 2012 approximately 30 m downstream, where the water exits the rocks and flows across a small meadow. At RG-2, a logger was placed at the discharge point from late August 2011 through the end of September 2012. Water temperature was also measured in a spring at the base of talus near RG-2 from late August 2013 through late June 2015.
Time series of water temperatures in springs discharging from rock glaciers and talus. Panel A presents results from RG-1 and RG-2 starting at the beginning of September 2011. Water temperature, particularly in RG-2, was consistently near 0°C in the summer of 2012. Water discharging from RG-1 exhibited a trend toward warmer temperatures later in the summer (2012 and 2013), although this logger was not located as close to the discharge point as in RG-2, so the rising temperature could be a result of declining discharge. Panel B presents results from a spring discharging from talus near RG-2. The temperature of this water also remained close to 0°C during the summer of 2014.
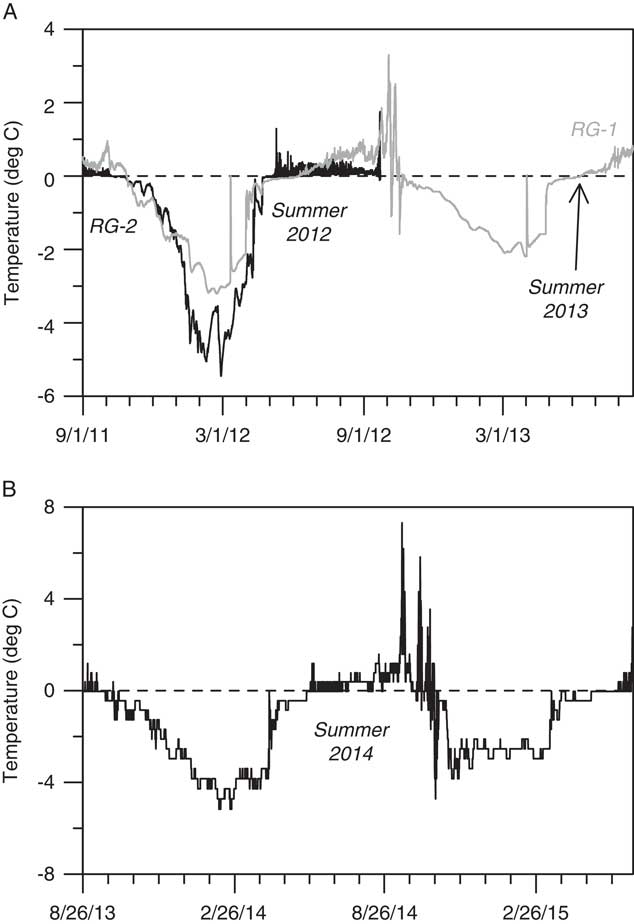
In all cases, the loggers measured consistently cold water temperatures throughout the summer (June 1–August 31). In 2012, the temperature at RG-1 (two loggers) averaged 0.2°C and at RG-2 it averaged 0.1°C (Fig. 5). In 2013, the temperature at RG-1 averaged 0.3°C (until it was collected on August 17). Water temperatures at RG-1 rose slowly over the summer of 2012 in contrast with temperatures at RG-2, which exhibited no trend. Finally, the temperature of the water discharging from the talus site averaged 0.3°C during the summer of 2014, and 0.1°C during June 2015. Excursions to notably higher (≥4°C) temperatures occurred later in the summer of 2014 (Fig. 5). It is unknown whether these represent actual changes in water temperature, or if water discharge declined to the point where the logger was exposed to the air.
Deployments of temperature data loggers on rock glacier surfaces were plagued by issues with battery life and disturbance by animals. Nonetheless, time-series of “bottom temperature of snow” (BTS) measurements generated over three different winters yield a consistent story (Fig. 6). In the initial deployment, a pair of loggers (one on the rock glacier and another at a nearby control site) ran from November 1 into the first week of December (at site 3 in Fig. 1). During this time, the temperature at the control site was stable at -0.6°C, despite fluctuations in air temperature measured by a pole-mounted logger that extended above the snowpack (Fig. 6). In contrast, BTS on the surface of the rock glacier was significantly colder, averaging -4.8°C.
Time series of bottom temperature of snow (BTS) measurements (°C), air temperature (°C), and snow depth (cm). The deployments in 2009 and 2011 included data loggers on rock glaciers and a control data logger installed nearby. Technical difficulties limited the duration of the records, yet it is clear that BTS on rock glaciers dropped to values colder than the control sites during the winter. Boxplots present the BTS measurements for the period of overlap between the data loggers in each deployment.

Loggers deployed at RG-1 and RG-2 (Fig. 1) during the winter of 2011–2012 generated similar results. Despite wide variations in air temperature, BTS on RG-1 averaged -3°C and at RG-2 the BTS averaged -3.5°C through the end of February when the batteries in RG-2 gave out (Fig. 6). In contrast, BTS at the control site averaged -1.3°C through this same period. Measurements at the nearby Chepeta SNOTEL (Fig. 1) document a persistent snowpack >50 cm deep throughout this period.
Loggers were deployed again at RG-1 and RG-2 for the winter of 2014–2015. This time, those on the rock glaciers ran the entire winter but the control loggers failed. Nonetheless, both loggers exhibited cold mean temperatures between the establishment of persistent snow cover in late October, and the end of May (Fig. 6). Values of BTS at RG-1 averaged -3.8°C, and at RG-2 the BTS averaged -2.9°C.
Rock glacier water age
Two water samples collected in late summer 2011 were successfully dated. The sample from RG-1 contained 10.4 (±0.4) tritium units (TU), and the sample from RG-2 had 8.5 (±0.3) TU. Analysis of dissolved gasses indicates that both samples are modern water, with apparent ages of<1 year (Table 2).
Results of water age dating.

*Diffusion samplers failed for RG-1 and RG-2 in 2013. No age determination possible.
An identical sampling approach was employed in late summer 2013 at RG-1 and RG-2, along with a talus slope near RG-2. The water discharging from both rock glaciers contained ~9 TU. Unfortunately, the diffusion samplers at these sites failed, so it was not possible to determine an age for the water. The sampler at the talus, however, site did work, and with a tritium content of 8.6 TU the water has an apparent age of 2.0 (±0.5) years (Table 2).
Rock glacier water chemistry
Water discharging from RG-1 and RG-2 in late summer 2013 exhibits a chemistry distinct from samples collected between 2005 and 2011 from lakes at elevations matching the middle of the rock glacier elevation distribution (Fig. 7; Table 3). Rock glacier water had a higher pH than average surface water. Concentrations of base cations Ca2+ and Mg2+ were also significantly greater in the rock glacier water. Measurements of NH4 + were at or below the detection limit for some of the lake water samples, but were relatively high in rock glacier water. The anions Cl- and NO3 - were greatly enriched in rock glacier water; the Cl- concentration was 4× the mean lake value, and the NO3 - enrichment was 8× the mean lake value (n=63). Sulfate was also enriched in rock glacier water, although one lake (Walk Up) exhibited SO4 2- values similar to rock glacier water. Overall, the total ion sum was significantly higher (P=0.001) in rock glacier water (Fig. 7).
Boxplots for water chemistry results from long-term (2005–2011) lake monitoring efforts in the Uinta Mountains compared with samples from RG-1 and RG-2. The rock glacier water samples were collected at the end of the summer in 2013, after nearly all visible snow had melted. Lake abbreviations: C, Upper Coffin Lake; D, Dean Lake; F, Fish Lake; N, No Name Lake; W, Walk Up Lake (see Fig. 1). Central lines in box plots represent median values, box represents interquartile range, whiskers represent interquartile range ×1.5, and open circles represent outliers. Horizontal dashed gray lines in the plots for NH4 + and F- represent detection limits. Sodium was not detected in the rock glacier water samples. All other measurements were considerably above detection limits. Rock glacier water samples exhibit notably elevated values of pH, Ca2+, Mg2+, Cl−, and NO3 − compared with lake water samples.

Water chemistry summary.

DISCUSSION
Rock glacier distribution
Studies of rock glaciers and related features elsewhere in the southwestern United States provide regional points of comparison for the inventory developed for the Uintas. In the Sierra Nevada of California, Millar and Westfall (Reference Millar and Westfall2008) found that cirque rock glaciers (equivalent to the tongue-shaped rock glaciers in this study) averaged 20 ha in extent and had a mean elevation of 3324 m asl. Valley wall rock glaciers (equivalent to the lobate forms mapped in the Uintas) were smaller, with a mean size of 3 ha, and were located at slightly lower elevations (mean 3243 m asl). Rock glaciers in the Uintas have intermediate areas (~10 ha) but are found at similar elevations (~3300 m asl; Table 1). Millar and Westfall (Reference Millar and Westfall2008) determined that cirque rock glaciers were found in significantly colder landscape positions than valley wall rock glaciers (MAT 0.9°C for cirque features versus 1.9°C for valley wall features). In contrast, the difference in MAT between these two landforms in the Uintas was not significant (Table 1), and both types of rock glaciers in the Uintas are found in positions with MAT usually<0°C.
In the Lemhi Mountains of Idaho, Johnson et al. (Reference Johnson, Thackray and Van Kirk2007) found that rock glaciers were preferentially located at elevations above 2600 m asl, which is slightly lower than this study and consistent with a slightly more northerly latitude. Surprisingly, Johnson et al. (Reference Johnson, Thackray and Van Kirk2007) found that rock glaciers were only present in locations receiving <2300 hours of sunlight per year, considerably less than the mean of ~3000 hr/yr found in this study (Fig. 3). This contrast could reflect a difference in the parameters used in the solar analyst calculation.
Rock glaciers similar to those mapped in the Uintas have also been reported from the La Sal Mountains and the High Plateaus of south-central Utah (Shroder, Reference Shroder1987), as well as isolated upland sites in New Mexico and east-central Arizona (Blagbrough and Farkas, Reference Blagbrough and Farkas1968; Blagbrough, Reference Blagbrough1994). Many of these features, however, are found at lower elevations (2500–3000 m asl), consistent with the interpretation that most of them are relicts from a colder, Pleistocene climate.
Finally, in the Colorado Front Range, Janke (Reference Janke2007) found that tongue-shaped rock glaciers are present at significantly higher elevations than lobate rock glaciers, and are clustered around northerly aspects, matching the results reported here. Janke (Reference Janke2007) also noted that tongue-shaped rock glaciers have distributions similar to modern glaciers, in contrast to lobate rock glaciers that have distinct distributions. From this observation, Janke (Reference Janke2007) concluded that tongue-shaped rock glaciers in the Colorado Front Range develop from ice glaciers that are buried by debris. Because the Uintas lack modern glaciers, a similar comparison cannot be made as part of this project, but the possibility that tongue-shaped rock glaciers are remnant, buried ice glaciers is intriguing and could be investigated using geophysical techniques (e.g., Leopold et al., Reference Leopold, Williams, Caine, Völkel and Dethier2011; Monnier and Kinnard, Reference Monnier and Kinnard2013).
Rock-glacier occurrence
An unsolved question in rock glacier research is what controls the presence or absence of rock glaciers. In the Uintas, as is common in high-elevation mountain ranges, the areal extent of talus is much greater than the area of rock glaciers. This suggests that many areas have the supply of blocky material necessary for rock glacier formation, but lack the internal ice necessary for movement. Ice content would logically be a function of temperature and solar exposure, and the tendency for rock glaciers to be located in colder, more shaded parts of the landscape supports this theory. Yet, rock glaciers are not found universally at high elevations, indicating that other factors must play a role in their distribution. In Idaho, Johnson et al. (Reference Johnson, Thackray and Van Kirk2007) noted a strong correspondence between rock glaciers and latitude, and interpreted this result as a signal of a north-south lithologic variation that influenced rock glacier presence or absence. Thus, rock glaciers may form preferentially in areas with rock types that generate the appropriate size or amount of debris. In the Uintas, however, the rock glacier distribution lacks a consistent along- or across-range pattern, suggesting that lithologic variations do not play a role. Other factors must, therefore, control whether talus and other concentrations of coarse debris in the Uintas accumulate sufficient internal ice to support forward movement.
To explore this topic further, a GIS analysis was conducted to highlight locations with conditions that commonly support rock glacier formation. Raster algebra identified areas with an elevation between the mean and maximum for the mapped rock glaciers, and slope and duration of solar intensity values between the minimum and mean for mapped rock glaciers. Results were then compared with the rock glacier inventory. This procedure revealed several locations, often in north-facing cirques, that lack rock glaciers despite possessing characteristics similar to places in which rock glaciers are found. On aerial imagery, debris chutes, debris fans, and other evidence of voluminous rockfall and rapid colluvial processes are notably common in these locations. Rock glaciers may, therefore, be absent from these locations because the rate of delivery of coarse debris outpaces rates of rock glacier flow, burying the rock glaciers in place. Future field and GIS investigations will be conducted to evaluate whether lithology, average clast size, or other criteria in these locations differ from places where rock glaciers are present.
Evidence for buried ice in rock glaciers
This study employed four independent approaches to evaluate whether rock glaciers in the Uinta Mountains contain internal ice: logging of ground surface temperatures beneath winter snowpack, measurement of summer water temperatures in springs discharging from rock glaciers, tritium/3He dating of discharged water, and comparison of the hydrochemistry of rock glacier discharge with other surface water. All of these approaches are indirect, yet all have been confirmed by previous studies. Together they constitute an ensemble argument for the presence of ice in Uinta rock glaciers.
Numerous studies have utilized BTS (bottom temperature of snow) beneath a persistent winter snowpack as an indicator for the presence or absence of permafrost (e.g., Haeberli, Reference Haeberli1973; Haeberli and Patzelt, Reference Haeberli and Patzelt1982). BTS values near 0°C are typical in situations lacking permafrost, whereas colder temperatures signify the presence of permafrost in the subsurface. This approach is particularly useful for evaluating the presence of internal ice within rock glaciers (Hoelzle et al., Reference Hoelzle, Wegmann and Krummenacher1999; Berger et al., Reference Berger, Krainer and Mostler2004). Values of -3 to -6°C were reported for rock glaciers in this Swiss Alps (Hoelzle et al., Reference Hoelzle, Wegmann and Krummenacher1999) in one of the first studies utilizing miniature data loggers to record BTS. Similar temperatures (-3 to -5°C) and a strong contrast with the ground surface adjacent to the rock glacier were reported for a site in Austria (Berger et al., Reference Berger, Krainer and Mostler2004). BTS measurements on Uinta rock glaciers in three different winters (averaging between -3 and -5°C) are, therefore, consistent with the present of permafrost (Fig. 6).
Cold, stable temperatures in springs discharging from rock glaciers have also been considered evidence of internal ice. Summer temperature records averaging 0.6°C and lacking diurnal fluctuations were reported from rock glacier springs in the Sierra Nevada (Millar et al., Reference Millar, Westfall and Delany2013), and values<1°C were measured in springs associated with rock glaciers in the Austrian Alps (Haeberli and Patzelt, Reference Haeberli and Patzelt1982; Krainer and Mostler, Reference Krainer and Mostler2002). These results are similar to the temperatures measured in the Uintas, which generally remained<1°C, particularly in early summer (Fig. 5). Millar et al. (Reference Millar, Westfall and Delany2013) concluded that cold, stable water temperatures were strong indicators of persistent internal ice within Sierra Nevada rock glaciers.
Attempts to date the water discharging from Uinta rock glaciers revealed that the water emerging from RG-1 and RG-2 in late summer 2011 was less than a year old, which is not consistent with the melting of multiyear, internal ice. On the other hand, snowfall during the winter of 2010–2011 was greater than normal, with a maximum snow water equivalent (SWE) at the Chepeta SNOTEL station (Fig. 1) 133% of the long-term average value. Extensive snowbanks were still present on and upslope from RG-1 and RG-2 when the samples were collected, so the resulting young water age is not surprising. In contrast, snowfall during the winter 2012–2013 was below average, with a maximum SWE just 86% of normal. Snowbanks were absent from the vicinity of RG-1, RG-2, and the talus site when water samples were collected in late summer 2013. Failure of the diffusion samplers at both rock glacier sites precludes estimation of the water age, but water at the talus site had an apparent age of 2 yr.
At the well-studied Galena Creek rock glacier in the Absaroka Range of Wyoming, Cecil et al. (Reference Cecil, Green, Vogt, Michel and Cottrell1998) reported tritium concentrations in rock glacier meltwater ranging from 9.2 to 13.2 TU, similar to the results from the Uintas (8.5 to 10.4 TU; Table 2). In contrast, TU values measured in an ice core from the Galena Creek rock glacier were near 0, indicating that the ice accumulated prior to the peak of above-ground nuclear weapons testing in the mid-twentieth century (Michel and Naftz, Reference Michel and Naftz1995; Cecil et al., Reference Cecil, Green, Vogt, Michel and Cottrell1998). Cecil et al. (Reference Cecil, Green, Vogt, Michel and Cottrell1998) concluded that the water discharging from the Galena Creek rock glacier was primarily sourced from modern precipitation. The TU values from the Uintas could support the same interpretation, but the age of 2 yr for water at the talus site indicates a source of water that is older than the snowfall from the previous winter. This age, and the TU values, could reflect mixing of young water from melting snow and annual ice with meltwater derived from older ice in the rock glacier interior.
The hydrochemistry of springs discharging from rock glaciers also provides clues to the presence of buried ice. Records of hydrochemistry from the Green Lake Valley, Colorado reveal that during most of the summer little distinction occurs between rock glacier water and other surface water (Williams et al., Reference Williams, Knauf, Caine, Liu and Verplanck2006). In late summer and fall, however, the abundance of Ca2+, Mg2+, SO4 2−, and dissolved silica rise dramatically (Williams et al., Reference Williams, Knauf, Caine, Liu and Verplanck2006; Caine, Reference Caine2010) along with concentrations of NO3 - (Clow et al., Reference Clow, Schrott, Webb, Campbell, Torizzo and Dornblaser2003; Williams et al., Reference Williams, Knauf, Cory, Caine and Liu2007). These late summer shifts in hydrochemistry were incorporated in a model of changing water sources and flow paths within a rock glacier through the summer season (Williams et al., Reference Williams, Knauf, Caine, Liu and Verplanck2006). In this model, the 0°C isotherm is near the rock glacier surface and snowmelt is the dominant water source in early summer. The resulting water discharge is, therefore, very similar to other surface waters. At some point in late summer, however, snowmelt is complete and penetration of summer warmth into the rock glacier is near its annual maximum depth. At this time, internal ice begins to melt and dominate the rock glacier discharge. Because this ice is in contact with fresh, physically weathered rock within the rock glacier, and may be considerably older than modern precipitation, chemical weathering reactions generate a hydrochemical profile that contrasts strongly with other surface water (Giardino et al., Reference Giardino, Vitek and DeMorett1992; Williams et al., Reference Williams, Knauf, Caine, Liu and Verplanck2006). At the same time, microbial communities within the rock glacier may serve as the source for the elevated nitrate levels noted in rock glacier outflows (Williams et al., Reference Williams, Knauf, Cory, Caine and Liu2007; Barnes et al., Reference Barnes, Williams, Parman, Hill and Caine2014).
The elevated concentrations of Ca2+, Mg2+, SO4 2-, and NO3 - in the late summer outflows from RG-1 and RG-2 are consistent with this model. Although the abundances of these ions are not as high as in the Colorado study—likely reflecting the reduced weatherability of the siliciclastic Uinta bedrock in contrast with the crystalline igneous and metamorphic rocks in Colorado (Williams et al., Reference Williams, Knauf, Caine, Liu and Verplanck2006)—comparison with the long-term lake monitoring results in the Uintas clearly reveals that concentrations of these ions are significantly higher in late summer rock glacier water (Fig. 7). The Uinta samples were collected at the end of August after nearly all visible snow had melted from surfaces of RG-1 and RG-2 and from the slopes above them. The consistent discharges in the sampled springs must, therefore, reflect a water source other than snowmelt. Even though these samples represent just a single year (2013), their strong contrast with the large, multi-year lake chemistry dataset, together with their collection after snowmelt was complete, supports the interpretation that rock glaciers are discharging meltwater from internal ice in late summer.
Implications for modern hydrology
Previous work has investigated the role of rock glaciers in high-elevation watersheds, yet, in most of these studies, rock glaciers were treated as aquifers offering short-term storage of precipitation (e.g., Winkler et al., Reference Winkler, Wagner, Pauritsch, Birk, Kellerer-Pirklbauer, Benischke, Leis, Morawetz, Schreilechner and Hergarten2016) or as impervious surfaces that could enhance stormflows (e.g., Geiger et al., Reference Geiger, Daniels, Miller and Nicholas2014). Only recently has research begun to focus on the possibility that rock glaciers, through the melting of internal ice, represent a source of water to the surface hydrologic system. For example, a study from southeastern Utah noted consistent summer baseflow in a channel leading from a rock glacier, in a setting where other streams run dry following the end of snowmelt (Geiger et al., Reference Geiger, Daniels, Miller and Nicholas2014). Similarly, in the Sierra Nevada, Millar et al. (Reference Millar, Westfall and Delany2013) reported that rock glacier springs typically flow all summer long, in contrast to other water sources at high elevations. In the Green Lake Valley, Colorado, permafrost thaw has been shown to contribute to the surface water system (Clow et al., Reference Clow, Schrott, Webb, Campbell, Torizzo and Dornblaser2003; Leopold et al., Reference Leopold, Williams, Caine, Völkel and Dethier2011, Reference Leopold, Lewis, Dethier, Caine and Williams2015). In an arid part of the Chilean Andes, rock glaciers were collectively estimated to contain more water than ice glaciers (Azócar and Brenning, Reference Azócar and Brenning2010) and, elsewhere in Chile, rock glaciers constitute ~50% of surface water storage (Janke et al., Reference Janke, Ng and Bellisario2017). Other studies in both Bolivia (Rangecroft et al., Reference Rangecroft, Harrison and Anderson2015) and Nepal (Jones et al., Reference Jones, Harrison, Anderson, Selley, Wood and Betts2018) have concluded that rock glaciers store significant amounts of water.
Springs discharging from rock glaciers and talus are common in the Uinta Mountains. Although no gage measurements are available for these features, given their abundance it is possible that they constitute a non-trivial component of late summer base flow, particularly at higher elevations. Surficial geologic mapping at 1:24,000 scale reveals that the Uintas contain ~210 km2 of talus and rock glaciers (Munroe and Laabs, Reference Munroe and Laabs2009). Although the thickness of these coarse debris deposits cannot be determined from mapping alone, an average value on the order of 10 m is reasonable, based on a wealth of field observations and information reported in other studies (e.g., Clow et al., Reference Clow, Schrott, Webb, Campbell, Torizzo and Dornblaser2003). This thickness yields a potential volume of ~2.1×10⁹ m3. The porosity of these features has not been directly measured, however, a value of 50% was reported for talus in the Green Lake Valley, Colorado (Clow et al., Reference Clow, Schrott, Webb, Campbell, Torizzo and Dornblaser2003) and rock glacier porosities are likely lower, given the presence of finer matrix material beneath the open-work rubble visible on the rock glacier surface (Fig. 2). If an overall average porosity of 30% is assumed, then rock glaciers and talus in the Uintas contain ~6.3×10⁸ m3 of void space in which water could be stored as ice. Even if only 25% of the pore spaces are filled, this nonetheless represents ~1.4×10⁸ m3 (0.14 km3) of water. Similar results (0.14–0.32 km3) are obtained using formulas presented in Janke et al. (Reference Janke, Ng and Bellisario2017), whereas greater water volumes (0.46–0.70 km3) are calculated using the formulas and ice content assumptions detailed in Jones et al. (Reference Jones, Harrison, Anderson, Selley, Wood and Betts2018). Because the total annual surface runoff from the Uintas is estimated as 1.8 km3 (Jeppson, Reference Jeppson1968), rock glaciers and talus could store a volume of water equivalent to ~10–35% of the annual runoff from these mountains.
Multiyear records from high elevation, rock glacier-influenced streams in Colorado reveal a trend of rising late summer/fall discharge that cannot be explained by changes in precipitation (Caine, Reference Caine2010). This trend, combined with the chemistry of the water discharging from rock glaciers, is interpreted as a sign that melting of internal ice is increasingly contributing to late summer/fall base flow. This possibility is worrisome because it suggests that short-term increases in water availability in these systems (from ice melt) will be followed by long-term decreases in water (Clow et al., Reference Clow, Schrott, Webb, Campbell, Torizzo and Dornblaser2003). Furthermore, if perennial ice within rock glaciers melts completely, these features may convert from imperious surfaces that enhance runoff, to permeable surface that promote infiltration. Precipitation falling on rock glaciers would, therefore, be more likely to enter the groundwater system, rather than contributing to surface water flows (Geiger et al., Reference Geiger, Daniels, Miller and Nicholas2014).
Trends in late summer/early fall baseflow are not apparent in gage records for rivers draining the Uinta Mountains, but numerous dams constructed over the past century to retain snowmelt at higher elevations inhibit identification of natural signals in these records. As a result, it is currently unknown whether the amount of water discharging from rock glaciers and talus in the Uintas is changing in response to climatic forcing. This is an important topic, however, because the Uintas supply ~9% of the annual streamflow in the Colorado River System (Jacoby, Reference Jacoby1975) and also deliver water to several rivers in the Great Salt Lake watershed. Overall, given the accumulating evidence that rock glaciers in the Uintas and other alpine ranges contribute to surface water systems, better understanding of ice in rock glaciers is critical to projections of how streamflows will change in the future.
CONCLUSIONS
The Uinta Mountains contain at least 395 mappable rock glaciers that are primarily found at elevations >3200 m, in positions receiving<3000 hours of sunlight per year, and with estimated MAT<0°C. The majority of are lobate features, but 60 have a tongue-shaped morphology. Tongue-shaped rock glaciers are found at significantly higher elevations and in locations receiving significantly less direct sunlight. Although rock glaciers are present in all aspect classes, they are more commonly oriented northward.
Data loggers reveal that the ground surface temperature beneath the snowpack on at least three rock glaciers drops to values considerably colder than nearby control sites during the winter. Data loggers also document water discharging at near 0°C from these rock glaciers throughout the summer months. Water discharge in late summer has a higher pH and significantly greater concentrations of many ions compared with lake water. Water with an age of ~2 yr was collected at a spring discharging from talus following a winter with a negative snowpack anomaly.
The combination of cold ground surface temperatures beneath insulating winter snowpack, near-freezing water discharge during summer months, water ages >1 yr, and enriched ionic concentrations are all consistent with the presence of permafrost conditions and perennial ice within at least some Uinta rock glaciers. How widespread the occurrence of ice is cannot be determined from the available data. Yet, because the subset of rock glaciers studied in detail is representative of the overall distribution of rock glaciers, it is possible that features containing ice are widespread in the Uinta Mountains.
The Uinta Mountains constitute an important water source to the Colorado River System and to the Great Salt Lake. The possibility that modern streamflows, particularly in late summer and fall, are enhanced by melting of buried ice that accumulated under colder paleoclimatic conditions should be considered carefully in future hydrologic modeling.
ACKNOWLEDGMENTS
The Ashley National Forest provided logistical and financial support for this project. Thanks to H. Kempenich and C. Plunkett for sharing their long-term surface water chemistry dataset. A. Rigby at the Dissolved and Noble Gas Laboratory at the University of Utah measured the ages of the water samples. Water chemistry was analyzed at the Soil, Water, and Plant Testing Lab at Colorado State University. Preliminary GIS analysis of rock glacier distribution was conducted by L. Duran at Middlebury College. B. Laabs, M. Devito, D. Munroe, M. Hendrickson, C. Plunkett, P. Quackenbush, and N. Stone assisted in the field. Two anonymous reviewers provided important feedback that improved the manuscript.



