1. Introduction
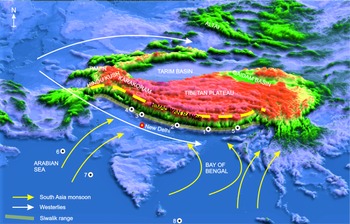
Globally, monsoon regions are mainly located in low latitude areas, which are subdivided into eight domains, namely the Indian Summer Monsoon (ISM), Western North Pacific Monsoon (WNPM), East Asia Monsoon (EAM), Indonesia–Australian Monsoon (I-AM), North America Monsoon (NAmM), South America Monsoon (SAmM), North Africa Monsoon (NAfM) and South Africa Monsoon (SAfM), depending on their location and characteristics (Yim et al. Reference Yim, Wang, Liu and Wu2014; Wang et al. Reference Wang, Wang, Cheng, Fasullo, Guo, Liu and Kiefer2017). The ISM, EAM and WNPM are collectively known as the Asian Monsoon System that effects Asian climates and is considered the largest and strongest monsoon system on Earth (Wang et al. Reference Wang, Wang, Cheng, Fasullo, Guo, Liu and Kiefer2017). Basically, summer monsoons can be defined as the seasonal reversal of surface winds, and these reversals of seasonal winds are associated with rainy summers and dry winter seasons (Webster, Reference Webster, Fein and Stephens1987; Wang et al. Reference Wang, Wang, Cheng, Fasullo, Guo, Liu and Kiefer2017). The prediction of future South Asian monsoon behaviour in a warming world is complex, despite major advancements in understanding the variability of the ISM (Wang et al. Reference Wang, Xiang, Li, Webster, Rajeevan, Liu and Ha2015). The strength of the monsoon mainly depends on the land–ocean configuration, regional topography and insolation (Wang et al. Reference Wang, Wang, Cheng, Fasullo, Guo, Liu and Kiefer2017). The ISM is a topographically modified system (Boos & Kuang, Reference Boos and Kuang2010; Molnar et al. Reference Molnar, Boos and Battisti2010; Ding et al. Reference Ding, Spicer, Yang, Xu, Cai, Li, Lai, Wang, Spicer, Yue, Shukla, Srivastava, Khan, Bera and Mehrotra2017), and the major heat source for the ISM to generate the temperature gradient between the land and ocean is located in the non-elevated part of northern India (Molnar et al. Reference Molnar, Boos and Battisti2010; Boos & Kuang, Reference Boos and Kuang2013), while the Himalaya insulates this region from the cold and dry mid-latitude winds (Boos & Kuang, Reference Boos and Kuang2010; Acosta & Huber, Reference Acosta and Huber2020) (Fig. 1). In meteorology, monsoon characterization and monitoring is based on instrumental records of climatic parameters (Parthasarathy et al. Reference Parthasarathy, Rupakumar and Kothawale1992; Liu & Yin, Reference Liu and Yin2002; Zhang & Wang, Reference Zhang and Wang2008; Zhao et al. Reference Zhao, Zhou, Chen and He2009) or atmospheric circulation (Goswami et al. Reference Goswami, Krishnamurthy and Annamalai1999; Wang & Fan, Reference Wang and Fan1999) primarily to understand the short-term temporal changes in monsoon behaviour. However, understanding deep time monsoon features from geological records is complicated and modern meteorological indices are not applicable. For deep time monsoonal climate characterization, different proxies such as isotopes and terrestrial fossils (animals and plants), often combined with climate modelling, have been used to understand its behaviour (Clift et al. Reference Clift, Hodges, Heslop, Hanningan, Long and Calves2008, Reference Clift, Kulhanek, Zhou, Bowen, Vincent, Lyle and Hahn2020; Srivastava et al. Reference Srivastava, Paudayal, Utescher and Mehrotra2018; Farnsworth et al. Reference Farnsworth, Lunt, Robinson, Valdes, Roberts, Clift, Markwick, Su, Wrobel, Bragg, Kelland and Pancost2019; Bhatia et al. Reference Bhatia, Khan, Srivastava, Hazra, Spicer, Hazra, Mehrotra, Spicer, Bera and Roy2021a,b) and thus have to use different criteria to define monsoon patterns. Typically, geological proxies use estimates of rainfall to understand monsoon fluctuations (Sanyal et al. Reference Sanyal, Bhattacharya, Kumar, Ghosh and Sangode2004, Reference Sanyal, Bhattacharya and Prasad2005; Clift et al. Reference Clift, Hodges, Heslop, Hanningan, Long and Calves2008, Reference Clift, Kulhanek, Zhou, Bowen, Vincent, Lyle and Hahn2020; Farnsworth et al. Reference Farnsworth, Lunt, Robinson, Valdes, Roberts, Clift, Markwick, Su, Wrobel, Bragg, Kelland and Pancost2019), while plant proxies use either seasonal rainfall data (Ding et al. Reference Ding, Spicer, Yang, Xu, Cai, Li, Lai, Wang, Spicer, Yue, Shukla, Srivastava, Khan, Bera and Mehrotra2017; Srivastava et al. Reference Srivastava, Paudayal, Utescher and Mehrotra2018) or integrated climate variable data as derived from leaf physiognomy (Spicer et al. Reference Spicer, Yang, Herman, Kodrul, Maslova, Spicer, Aleksandrova and Jin2016; Bhatia et al. Reference Bhatia, Khan, Srivastava, Hazra, Spicer, Hazra, Mehrotra, Spicer, Bera and Roy2021a,b) to understand monsoon presence.
Physiographic map showing the present fossil locality and previously studied sites: 1 – Darjeeling Siwalik, India; 2 – Surai Khola, Nepal (Hoorn et al. Reference Hoorn, Ohja and Quade2000); 3, 4 – Himachal Pradesh, India (Sanyal et al. Reference Sanyal, Bhattacharya, Kumar, Ghosh and Sangode2004); 5 – Arunachal Pradesh Siwalik, India; 6 – Indus marine A-1, Arabian Sea (Clift et al. Reference Clift, Hodges, Heslop, Hanningan, Long and Calves2008); 7 – IODP site 1456, eastern Arabian Sea (Clift et al. Reference Clift, Kulhanek, Zhou, Bowen, Vincent, Lyle and Hahn2020); 8 – ODP site 718, southern Bay of Bengal (Clift et al. Reference Clift, Hodges, Heslop, Hanningan, Long and Calves2008).

In the central and western Himalayan Foreland Basin, isotopic studies indicate that a vegetation shift from C3 to C4 photosynthesis is linked with an increase in the seasonality of rainfall during late Miocene time (Quade et al. Reference Quade, Cerling and Bowman1989, Reference Quade, Cater, Ojha, Adam and Harrison1995; Sanyal et al. Reference Sanyal, Bhattacharya, Kumar, Ghosh and Sangode2004, Reference Sanyal, Sarkar, Bhattacharya, Kumar, Ghosh and Agrawal2010). Moreover, recent data also suggest that winter precipitation caused by the western disturbances (WDs) and increase in frequency of forest fires also played an important role in providing positive feedback for this vegetation shift (Vögeli et al. Reference Vögeli, Najman, van der Beek, Huyghe, Wynn, Govin, van der Veen and Sachse2017; Karp et al. Reference Karp, Behrensmeyer and Freeman2018, Reference Karp, Uno, Polissar and Freeman2021; Srivastava et al. Reference Srivastava, Paudayal, Utescher and Mehrotra2018).
Quantitative palaeoclimate data using the Climate Leaf Analysis Multivariate Program (CLAMP) and Coexistence Approach (CA) on two palaeofloras retrieved from the Lower (middle Miocene: ∼13–11 Ma) and Middle (late Miocene: 9.5–6.8 Ma) Siwalik succession of the western Himalaya, Nepal, indicate an increasing trend in mean annual temperature and cold month mean temperature throughout this interval, while the warm month mean temperature remained the same (Srivastava et al. Reference Srivastava, Paudayal, Utescher and Mehrotra2018; Bhatia et al. Reference Bhatia, Srivastava, Spicer, Farnsworth, Spicer, Mehrotra, Paudayal and Valdes2021b). Moreover, rainfall data reveal that the ratio of summer to winter season precipitation increased from 3.47:1 to 9.16:1 (Srivastava et al. Reference Srivastava, Paudayal, Utescher and Mehrotra2018). However, quantitative climate data from the Lower (13–10.5 Ma) and Middle (10.5–2.6 Ma) Siwalik climate of Arunachal Pradesh (Fig. 1) in the eastern Himalaya using CLAMP analysis indicate a decreasing trend in the mean annual temperature and cold month mean temperature, while the warm month mean temperature remained nearly the same.
The CLAMP methodology is independent of taxonomy and utilizes the relationship between dicot leaf morphological traits and their prevailing climatic conditions (Yang et al. Reference Yang, Spicer, Spicer, Arens, Jacques, Tao, Kennedy, Herman, Steart, Srivastava, Mehrotra, Valdes, Mehrotra, Zhou and Lai2015; Spicer et al. Reference Spicer, Yang, Spicer and Farnsworth2021). In angiosperms, dicot leaves are directly exposed to their immediate prevailing climatic conditions, and evolutionary selection means they are tuned for maximizing photosynthetic performance against resource investment, and this includes optimizing transpiration and leaf mechanics (Givnish, Reference Givnish, Medina, Mooney and Vázquez-Yáñez1984; Pigliucci, Reference Pigliucci2003; Juenger et al. Reference Juenger, Pérez-Pérez and Mand Micol2005; Rodriguez et al. Reference Rodriguez, Debernardi and Palatnik2014). Because of this, dicot leaves display distinctive physiognomic/morphological trait spectra reflective of the prevailing local climate (Spicer et al. Reference Spicer, Yang, Spicer and Farnsworth2021). However, CLAMP has some limitations as it can only be applied to dicot fossil leaves and requires a minimum of 20 different leaf morphotypes (Wolfe, Reference Wolfe1993; Yang et al. Reference Yang, Spicer, Spicer, Arens, Jacques, Tao, Kennedy, Herman, Steart, Srivastava, Mehrotra, Valdes, Mehrotra, Zhou and Lai2015). Although CLAMP is robust in reconstructing the temperature-related climate variables, it however bears large uncertainties for rainfall prediction, because leaf forms are weakly constrained in wet regimes (Khan et al. Reference Khan, Spicer, Bera, Ghosh, Yang, Spicer, Guo, Su, Jacques and Grote2014). In comparison, the CA can be applied to any fossil assemblages having leaves, wood, flowers, fruits and pollen, requires a minimum of ten taxa and is based on the nearest living relative (NLR) approach (Mosbrugger & Utescher, Reference Mosbrugger and Utescher1997; Utescher et al. Reference Utescher, Bruch, Erdei, François, Ivanov, Jacques, Kern, Liu, Mosbrugger and Spicer2014). The CA has a similar bias, to some extent, as that of CLAMP where water-loving taxa may be preferentially more represented near water bodies that provide the conditions for fossilization.
The quantitative palaeoclimate estimations derived from CLAMP and CA indicate that in each region different forcing factors were responsible for climate and vegetation changes. Isotopic, palynological and phytolith data from different sites within the central and western Himalayan Foreland Basin, marine sites from the Arabian Sea, Bay of Bengal and South China Sea, and the northern part of China indicate an overall decreasing trend in annual moisture and temperature, particularly after middle Miocene time (Quade et al. Reference Quade, Cerling and Bowman1989, Reference Quade, Cater, Ojha, Adam and Harrison1995; Hoorn et al. Reference Hoorn, Ohja and Quade2000; Ohja et al. Reference Ohja, Butler, Quade and DeCelles2000; Sanyal et al. Reference Sanyal, Bhattacharya, Kumar, Ghosh and Sangode2004; Clift et al. Reference Clift, Hodges, Heslop, Hanningan, Long and Calves2008; Qin et al. Reference Qin, Ferguson, Zetter, Wang, Syabrya, Li, Yang and Li2011; Miao et al. Reference Miao, Herrmann, Wu, Yan and Yang2012, Reference Miao, Warny, Clift, Liu and Gregory2017; Wang et al. Reference Wang, Lu, Zhao, Zhang, Lei and Wang2019) (Fig. 1), and this change was most likely linked to the Northern Hemisphere glaciation/global cooling (Zachos et al. Reference Zachos, Pagani, Sloan, Thomas and Billups2001, Reference Zachos, Dickens and Zeebe2008). However, a recent study based on climate modelling and data comparison for eastern Asia shows an increase in overall rainfall up to Pliocene time due to the development of a ‘supermonsoon’ (Farnsworth et al. Reference Farnsworth, Lunt, Robinson, Valdes, Roberts, Clift, Markwick, Su, Wrobel, Bragg, Kelland and Pancost2019).
The NE region of India is surrounded by mountains in the north, east and south with hills within the region and an opening to the west to receive moisture transported by the westerlies (Fig. 1). This region receives most of the rainfall (∼151.3 cm) during the monsoon season, a considerably larger amount than the all-India average rainfall (86.5 cm) (Parthasarathy et al. Reference Parthasarathy, Munot and Kothawale1995). Moreover, the monthly variability of rainfall during the summer monsoon season is also low (Parthasarathy & Dhar, Reference Parthasarathy and Dhar1974). Besides this, the NE region receives a significant amount of rainfall (∼25 % of its annual total) during the pre-monsoon season (March–May/MAM), related to thunderstorms (Mahanta et al. Reference Mahanta, Sarma and Choudhury2013). The pre-monsoon (March–May/MAM) rainfall is a local convective rainfall, while summer monsoon (June–September/JJAS) rainfall is mainly delivered by large-scale summer monsoon circulation. Overall, the region receives 80 % of the annual rainfall during the pre-monsoon and summer monsoon seasons (Mahanta et al. Reference Mahanta, Sarma and Choudhury2013). Because of the unique hydrological setting of NE India, it is important to understand the evolution of such hydrological changes in the geological past. However, only a few attempts have been made to quantitatively reconstruct the hydrological changes in NE India (Tiwari et al. Reference Tiwari, Mehrotra, Srivastava and Shukla2012; Khan et al. Reference Khan, Spicer, Bera, Ghosh, Yang, Spicer, Guo, Su, Jacques and Grote2014; Srivastava et al. Reference Srivastava, Tiwari and Mehrotra2017). The CA has the ability to quantitatively reconstruct Neogene seasonal rainfall such as precipitation during the warmest months (MPwarm), which represents the pre-monsoon (March–May/MAM), and precipitation during the wettest months (MPwet), i.e. summer monsoon (June–September/JJAS) (Srivastava et al. Reference Srivastava, Tiwari and Mehrotra2017, Reference Srivastava, Paudayal, Utescher and Mehrotra2018).
Here, using the CA, we quantitatively reconstruct the climate of the Lower (middle Miocene) and Middle (late Miocene–Pliocene) Siwalik successions based on the fossil megaflora of the Darjeeling district (Fig. 2), eastern Himalaya (Fig. 1). The reconstructed climate data will be helpful in understanding the changing patterns in climate (temperature, rainfall and summer monsoon strength), vegetation shifts and C4 plant expansion during the Mio-Pliocene.
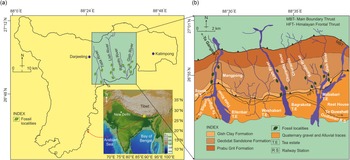
Geological map of the fossil locality showing different formations and fossil localities (red asterisks) (modified after Prasad et al. Reference Prasad, Kannaujia, Alok and Singh2015).

1.a. Geological setting of the study area
The deposition of muds, sands and gravels between the Lesser Himalaya in the north and the Gangetic Plains in the south since middle Miocene time was the product of ancient rivers draining from the active Himalayan orogeny. This sediment accumulation took place all along the length of the Himalayan Foreland Basin covering a longitudinal distance of ∼2400 km and attaining a thickness of ∼6 km (Kumar et al. Reference Kumar, Ghosh and Sangode2011; Jain et al. Reference Jain, Banerjee and Kale2020) in a coarsening upward succession known as the Siwalik Group (Fig. 1). The Siwalik succession is divided into three sub-groups, namely the Lower, Middle and Upper Siwalik (Pilgrim, Reference Pilgrim1910, Reference Pilgrim1913). The sediments of the Lower Siwalik are characterized by an alternation of fine- to medium-grained sandstones and variegated mudstones and are interpreted to have been deposited by meandering river systems, while the Middle Siwalik sediments are marked by medium- to coarse-grained, grey, micaceous salt-and-pepper coloured sandstone and are interpreted to have been deposited by a braided fluvial system. The Upper Siwalik comprises pebble and cobble conglomerates and formed as alluvial fan deposits near the mountain front (Tandon, Reference Tandon, Tandon, Pant and Casshyap1991; Chakraborty et al. Reference Chakraborty, Taral, More, Bera, Gupta and Tandon2020; Jain et al. Reference Jain, Banerjee and Kale2020).
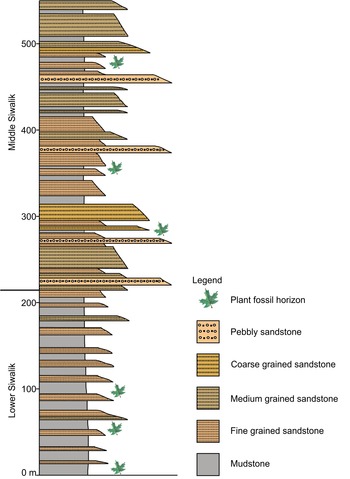
In Darjeeling, the Siwalik Group is represented by three formations, namely the Gish Clay, Geabdat Sandstone and Parbu Grit, which are equivalent to the Lower, Middle and Upper Siwalik (Ganguly & Rao, Reference Ganguly and Rao1970; Acharya, Reference Acharyya1994) (Fig. 2). The Gish Clay Formation is characterized by medium- to fine-grained, well-sorted sandstones, subordinate micaceous sandstones, bluish nodular silty shale and claystone, while the Geabdat Sandstone Formation bears weakly indurated, medium- to coarse-grained salt-and-pepper coloured sandstones. Calcareous concretions of various shapes and sizes are also present. The Parbu Grit Formation is characterized by pebbly sandstone and coarse to medium sandstone (Ganguly & Rao, Reference Ganguly and Rao1970; Acharyya, Reference Acharyya1994; Matin & Mukul, Reference Matin and Mukul2010; Khan et al. Reference Khan, Spicer, Bera, Ghosh, Yang, Spicer, Guo, Su, Jacques and Grote2014) (Table 1). Abundant plant fossils are present in the Gish Clay and Geabdat Sandstone formations (Fig. 3).
The lithostratigraphy of the Siwalik Group in the Darjeeling–Sikkim Himalayan region (after Taral & Chakraborty, Reference Taral and Chakraborty2018)

Generalized lithology of the Lower and Middle Siwalik of the studied area (Darjeeling).

1.b. Age and depositional environment of the study area
In Darjeeling, based on the lithostratigraphy, the age of the Lower and Middle Siwalik is assigned to the middle–late Miocene and Pliocene, respectively (Ganguly & Rao, Reference Ganguly and Rao1970; Acharyya, Reference Acharyya1994; Khan et al. Reference Khan, Spicer, Bera, Ghosh, Yang, Spicer, Guo, Su, Jacques and Grote2014). Furthermore, the dominance of characteristic leaf megafossils (such as Shorea sp., Albizia sp. and Acacia sp.) and invertebrate (Globigerenoides sp.) fossil assemblages suggest a depositional period of between middle Miocene and Pliocene in the Tista valley of the Darjeeling Siwalik (Acharyya et al. Reference Acharyya, Dutta and Sastry1979; D. K. Paruya, unpub. Ph.D. thesis, Univ. Calcutta, 2012; Khan et al. Reference Khan, Spicer, Spicer and Bera2016; More et al. Reference More, Rit, Khan, Paruya, Taral, Chakraborty and Bera2018). However, recent works based on lithostratigraphy, magnetostratigraphy and sub-basin correlation assigned the age of the Lower (Gish Clay Formation) and Middle (Geabdat Sandstone Formation) Siwalik of Darjeeling to the middle Miocene and late Miocene–Pliocene, respectively (Acharyya, Reference Acharyya1994; Taral et al. Reference Taral, Kar and Chakraborty2017; Taral & Chakraborty, Reference Taral and Chakraborty2018; Chakraborty et al. Reference Chakraborty, Taral, More, Bera, Gupta and Tandon2020; Roy et al. Reference Roy, Roy, Goyal, Ghosh and Sanyal2021).
It has been observed that the depositional environment of the eastern Siwalik differed from that of the western and central Siwalik. The sediments of the western and central regions are exclusively terrestrial and were deposited by meandering and braided rivers (DeCelles et al. Reference DeCelles, Gehrels, Quade and Ojha1998; Nakayama & Ulak, Reference Nakayama and Ulak1999; Kumar et al. Reference Kumar, Ghosh, Mazari and Sangode2003a,Reference Kumar, Ghosh and Sangode b, Reference Kumar, Ghosh and Sangode2011). However, the depositional environment of the eastern Siwalik has some marine influence (Mitra et al. Reference Mitra, Bera and Banerjee2000; Chirouze et al. Reference Chirouze, Dupont-Nivet, Huyghe, van der Beek, Chakraborti, Bernet and Erens2012; Coutand et al. Reference Coutand, Barrier, Govin, Grujic, Hoorn, Dupont-Nivet and Najman2016; More et al. Reference More, Paruya, Taral, Chakraborty and Bera2016; Taral et al. Reference Taral, Kar and Chakraborty2017; Roy et al. Reference Roy, Roy, Goyal, Ghosh and Sanyal2021). This dissimilarity is referable to the fact that the eastern region of India was not connected to Eurasia in the way that the western and central regions were before middle Miocene time (Sinha et al. Reference Sinha, Chatterjee and Satsangi1982; Ranga Rao, Reference Ranga Rao1983). This is due to the diachronous collision of the Indian Plate with the Eurasian Plate, which started from the west and progressed towards the east, and might have delayed the closure of marine incursions in the eastern Siwalik region (Rowley, Reference Rowley1996; Uddin & Lundberg, Reference Uddin and Lundberg2004; Yin, Reference Yin2006; Acharyya, Reference Acharyya2007).
In the Darjeeling Siwalik, the palynological assemblages recovered from the Geabdat Sandstone Formation of the Churanthi River section, which is 4 km west of the Gish River, include pollen grains of Palaeosantalaceaepites sp., Zonocostites sp. (Rhizophoraceae), Malvacearumpollis sp. (Malvaceae), Araliaceoipollenites (Araliaceae) and isolated salt glands of mangrove plant leaves (Heliospermopsis siwalikii and Heliospermopsis sp.) indicating the presence of brackish water in a possible nearshore marine environment (Mitra et al. Reference Mitra, Bera and Banerjee2000; More et al. Reference More, Paruya, Taral, Chakraborty and Bera2016). Moreover, the sedimentary structure, vertical succession of strata, palaeocurrent patterns and characteristic trace fossils, such as Cylindrichnus, Rosselia, Rhizocorallium, Chondrites and Zoophycos reported from the Geabdat Sandstone Formation of the Tista valley, strongly suggest a marine deltaic environment (Taral et al. Reference Taral, Kar and Chakraborty2017). Additionally, characteristic biomarkers derived from organic matter from upper Miocene to Pliocene sediments of the Darjeeling Siwalik indicate, apart from the dominance of a terrestrial environment, substantial contributions from marine sources (Roy et al. Reference Roy, Roy, Goyal, Ghosh and Sanyal2021). Furthermore, sedimentology, plant megafossils and palynological analysis indicate a brackish or marginal marine deltaic environment in the Bhutan and Arunachal Pradesh Siwalik of NE India (Singh & Tripathi, Reference Singh and Tripathi1990; Joshi et al. Reference Joshi, Tewari, Mehrotra, Chakraborty and De2003; Chirouze et al. Reference Chirouze, Dupont-Nivet, Huyghe, van der Beek, Chakraborti, Bernet and Erens2012; Coutand et al. Reference Coutand, Barrier, Govin, Grujic, Hoorn, Dupont-Nivet and Najman2016).
1.c. Modern climate of the fossil locality
The Darjeeling area has a sub-tropical to temperate/montane type of climate depending on elevation and aspect. The study site is located in the Oodlabari area of the Darjeeling district, West Bengal, and the present-day elevation of the area is ∼200 m above sea level. The studied area is under the influence of a strong summer monsoon climate, where moisture is mostly sourced from the Bay of Bengal. The mean annual precipitation is 2047 mm, the mean precipitation during the wettest month is 1655 mm, the mean precipitation during the driest month is 38 mm, while the mean precipitation during the warmest month is 255 mm. The ratio of WET:DRY is 43.5 (India Meteorological Department, 1931–1960).
2. Materials and methods
In the present study, we use plant megafossils reported from the Lower and Middle Siwalik succession of the Darjeeling district. All fossils were collected from two formations, namely the Gish Clay (Lower Siwalik) and Geabdat Sandstone (Middle Siwalik) (Table 2; Figs 2, 3). The fossils were excavated from sedimentary rocks exposed near the rivers, namely the Ghish, Lish, Ramthi and Tista in the Oodlabari area of the Darjeeling district, West Bengal (Figs 2, 3) (Antal & Awasthi, Reference Antal and Awasthi1993; Antal & Prasad, Reference Antal and Prasad1995, Reference Antal and Prasad1996a,Reference Antal and Prasad b,Reference Antal and Prasad c, Reference Antal and Prasad1997, Reference Antal and Prasad1998; Antal et al. Reference Antal, Prasad and Khare1996; Prasad et al. Reference Prasad, Panjawani, Kannaujia and Alok2009, Reference Prasad, Kannaujia, Alok and Singh2015).
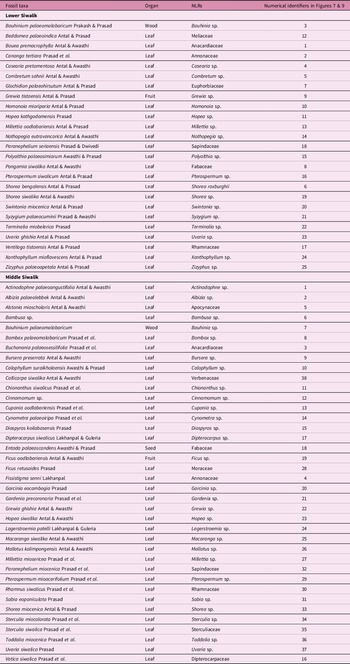
Fossil plants and their nearest living relatives (NLRs) from the Darjeeling Siwalik, West Bengal, India

In this study, we first identified the NLRs of all the fossil taxa and then segregated their habitats into the different forest types in which they are normally found. The forest types are classified according to their geographic, climatic and floristic traits that determine forest structure and composition (Champion & Seth, Reference Champion and Seth1968; Rundel, Reference Rundel1999). A plant is considered evergreen when it bears leaves throughout the year, while deciduous ones are those that shed their leaves each year, particularly during the dry season (Champion & Seth, Reference Champion and Seth1968).
The CA is used for the reconstruction of the Lower and Middle Siwalik climate of Darjeeling (Figs 1, 2). The CA is based on the philosophy of the NLR approach, which assumes that the modern analogues of the plant fossils have the same climatic tolerance as those of the fossils, and the technique can be applied to any fossil assemblage of leaves, wood, fruits, seeds and pollen. This methodology returns values consistent with those of other proxies for the Neogene to Quaternary periods where the majority of cases showed no significant change in the climatic requirement of any taxon (MacGinitie, Reference MacGinitie1941; Hickey, Reference Hickey1977; Chaloner & Creber, Reference Chaloner and Creber1990; Mosbrugger, Reference Mosbrugger, Jones and Rowe1999). In this methodology, the fossils are first identified systematically and then the climatic tolerances of their modern analogues are obtained by documenting the climatic conditions of the area within which that taxon is found today. Thereafter, the coexistence interval can be determined by observing the maximum overlap of each climatic variable across the entire fossil assemblage composition. The observed coexistence intervals are considered, where climatic tolerances of the maximum taxa are included, as the most suitable ranges of different palaeoclimatic variables for a given fossil flora. The taxa which are present outside these coexistence intervals are considered outliers. Outliers result from many factors including wrong identification, imprecise climatic information for the modern analogues and a change in climatic tolerances through geologic time (Mosbrugger & Utescher, Reference Mosbrugger and Utescher1997; Utescher et al. Reference Utescher, Bruch, Erdei, François, Ivanov, Jacques, Kern, Liu, Mosbrugger and Spicer2014). The CA, like CLAMP, relies only on the presence/absence of taxa and is independent of sample size and relative abundance. CA reconstructions have been validated by other independent methodologies such as CLAMP (Liang et al. Reference Liang, Bruch, Collinson, Mosbrugger, Li, Sun and Hilton2003; Uhl et al. Reference Uhl, Klotz, Traiser, Thiel, Utescher, Kowalski and Dilcher2007; Xing et al. Reference Xing, Utescher, Jacques, Tao, Liu, Huang and Zhou2012; Bondarenko et al. Reference Bondarenko, Blochina and Utescher2013). Generally, the CA results are also supported by oxygen isotope data retrieved from marine archives and palaeovegetational reconstruction (Mosbrugger et al. Reference Mosbrugger, Utescher and Dilcher2005; Utescher et al. Reference Utescher, Bondarenk and Mosbrugger2015; Srivastava et al. Reference Srivastava, Trivedi, Mehrotra, Paudayal, Limaye, Kumaran and Yadav2016, Reference Srivastava, Paudayal, Utescher and Mehrotra2018).
The CA reconstructs climatic variables such as mean annual temperature, cold month temperature, warm month temperature, mean annual precipitation, mean precipitation during the wettest months, mean precipitation during the driest months and mean precipitation during the warmest months. The climatic tolerances for all taxa in this study were obtained from the PALAEOFLORA database (Utescher & Mosbrugger, unpub. data, 2018: previously available at http://www.palaeoflora.de) (online Supplementary Material). The details of the PALAEOFLORA database and extraction of climate data for fossil NLRs are discussed by Utescher et al. (Reference Utescher, Bruch, Erdei, François, Ivanov, Jacques, Kern, Liu, Mosbrugger and Spicer2014).
3. Results
3.a. Palaeofloristic analysis of the Lower and Middle Siwalik flora of Darjeeling
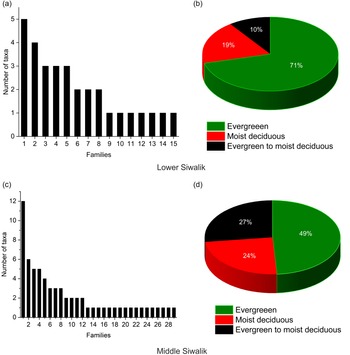
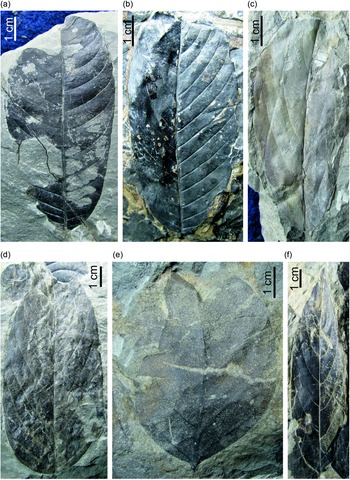
Modern analogues of the fossils reported from the Lower Siwalik succession belong to the families Anacardiaceae, Annonaceae, Combretaceae, Dipterocarpaceae, Euphorbiaceae, Fabaceae, Flacourtiaceae, Malvaceae, Meliaceae, Myrtaceae, Rhamnaceae, Rubiaceae, Sapindaceae and Xanthophyllaceae. A detailed list of taxa is provided in the online Supplementary Material. The most diverse plant families in the Lower Siwalik assemblage are: Flacourtiaceae and Fabaceae, followed by Anacardiaceae, Dipterocarpaceae, Combretaceae, Euphorbiaceae, Rhamnaceae, Meliaceae, Myrtaceae, Rubiaceae, Sapindaceae, Malvaceae, Tiliaceae and Xanthophyllaceae (Figs 4a, 5). The floristic assemblage suggests that 71 % of taxa are typically found in evergreen forests, whereas 19 % of taxa are typical of moist deciduous forests. However, only 10 % of taxa are evergreen to moist deciduous (Fig. 4b) (Champion & Seth, Reference Champion and Seth1968).
(a–d) Bar and pie diagrams showing the floristic diversity and forest types during the Lower and Middle Siwalik of Darjeeling. (a) Floristic diversity during the Lower Siwalik. 1 – Flacourtiaceae; 2 – Fabaceae; 3 – Anacardiaceae; 4 – Annonaceae; 5 – Dipterocarpaceae; 6 – Combretaceae; 7 – Euphorbiaceae; 8 – Rhamnaceae; 9 – Meliaceae; 10 – Myrtaceae; 11 – Rubiaceae; 12 – Sapindaceae; 13 – Malvaceae; 14 – Tiliaceae; 15 – Xanthophyllaceae. (b) Pie diagram showing the forest types during the deposition of the Lower Siwalik sediments. (c) Floristic diversity during the Middle Siwalik. 1 – Fabaceae; 2 – Dipterocarpaceae; 3 – Annonaceae; 4 – Malvaceae; 5 – Sapindaceae; 6 – Apocynaceae; 7 – Flacourtiaceae; 8 – Moraceae; 9 – Burseraceae; 10 – Ebenaceae; 11 – Euphorbiaceae; 12 – Lauraceae; 13 – Anacardiaceae; 14 – Bombacaceae; 15 – Calophyllaceae; 16 – Clusiaceae; 17 – Compositae; 18 – Dilleniaceae; 19 – Lythraceae; 20 – Marantaceae; 21 – Oleaceae; 22 – Poaceae; 23 – Rhamnaceae; 24 – Rubiaceae; 25 – Rutaceae; 26 – Sabiaceae; 27 – Tiliaceae; 28 – Verbenaceae; 29 – Vitaceae. (d) Pie diagram showing the forest types during the deposition of the Middle Siwalik sediments.

Fossil leaf assemblage from the Lower Siwalik of Darjeeling. (a) Combretum sahnii Antal & Awasthi. (b) Polyalthia palaeosimiarum Awasthi & Prasad. (c) Hydnocarpus palaeokurzii Antal & Awasthi. (d) Casearia pretomentosa Antal & Awasthi. (e) Pongamia siwalika Antal & Awasthi. (f) Nothopegia eutravancorica Antal & Awasthi (all scale bars = 1 cm).

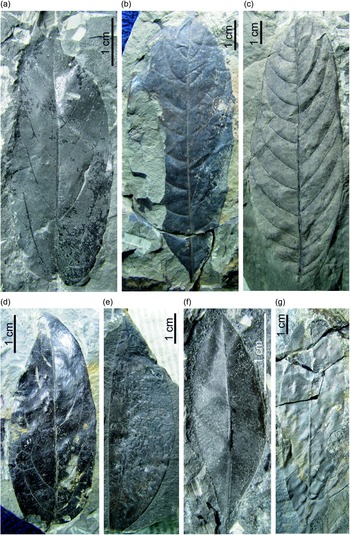
Modern analogues of the fossils from the Middle Siwalik succession belong to families such as Anacardiaceae, Annonaceae, Apocynaceae, Bombacaceae, Burseraceae, Calophyllaceae, Clusiaceae, Compositae (Asteraceae), Dilleniaceae, Dipterocarpaceae, Ebenaceae, Euphorbiaceae, Fabaceae, Flacourtiaceae, Lauraceae, Lythraceae, Marantaceae, Moraceae, Oleaceae, Poaceae, Rhamnaceae, Rutaceae, Sabiaceae, Sapindaceae, Malvaceae, Verbanaceae and Vitaceae. The most diverse families in the Middle Siwalik assemblage are Fabaceae, Dipterocarpaceae, Annonaceae and Malvaceae followed by Sapindaceae, Apocynaceae, Flacourtiaceae, Moraceae, Burseraceae, Ebenaceae, Euphorbiaceae, Lauraceae, Anacardiaceae, Bombacaceae, Calophyllaceae, Clusiaceae, Compositae, Dilleniaceae, Lythraceae, Marantaceae, Oleaceae, Poaceae, Rhamnaceae, Rubiaceae, Rutaceae, Sabiaceae, Tiliaceae, Verbenaceae and Vitaceae (Figs 4c, 6). The floristic assemblage suggests that 49 % of taxa today belong to evergreen forests, whereas 24 % of taxa are affiliated with moist deciduous forests, and 27 % of taxa are evergreen to moist deciduous (Fig. 4d) (Champion & Seth, Reference Champion and Seth1968).
Fossil leaf assemblage from the Middle Siwalik of Darjeeling. (a) Grewia ghishia Antal & Awasthi. (b) Vitis siwalicus Prasad et al. (c) Lagerstroemia patelii Lakhanpal & Guleria. (d) Hopea siwalika Antal & Awasthi. (e) Cynometra tertiara Antal & Awasthi. (f) Alsodeia palaeozeylanicum Antal & Awasthi. (g) Calophyllum suraikholaensis Awasthi & Prasad (all scale bars = 1 cm).

3.b. Temperature and rainfall reconstruction of the Lower and Middle Siwalik succession of Darjeeling
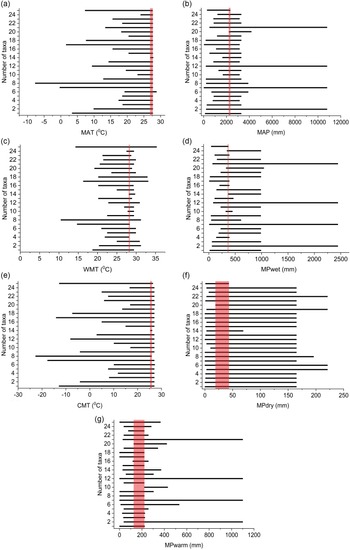
In the Lower Siwalik, 25 NLR taxa have been used for the climate reconstruction (Fig. 7) and a list of all the taxa, their NLRs and numerical identifiers used are provided in Table 2.
Climatic ranges of the NLRs identified for the palaeoflora of the Lower Siwalik of Darjeeling. Red shaded areas: Coexistence Intervals (CIs). (a) Mean annual temperature (MAT). (b) Warm month mean temperature (WMT). (c) Cold month mean temperature (CMT). (d) Mean annual precipitation (MAP). (e) Mean precipitation of the wettest month (MPwet). (f) Mean precipitation of the driest month (MPdry). (g) Mean precipitation of the warmest month (MPwarm). For taxa names, see Table 2.

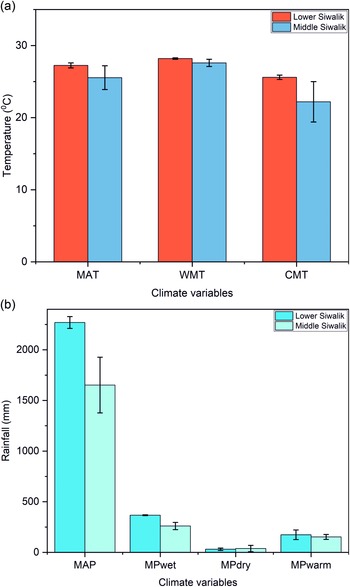
The reconstructed temperatures for the Lower Siwalik flora are: 27.2 ± 0.3 °C for the mean annual temperature, 28.2 ± 0.1 °C for the warm month temperature and 25.6 ± 0.3 °C for the cold month temperature (Fig. 8a). The reconstructed precipitations are: 2269.5 ± 58.5 mm for the mean annual precipitation, 367 ± 4 mm for the mean precipitation during the wettest months, 31 ± 12 mm for the mean precipitation during the driest months and 174 ± 47 mm for the mean precipitation during the warmest months (Fig. 8b). The results of the reconstruction are given in Table 3. As nearly 100 % of the NLR taxa coexist in the resulting coexistence intervals, the results are considered highly reliable (Fig. 7).
Climate reconstruction of the Lower and Middle Siwalik. (a) Temperature reconstruction of the Lower and Middle Siwalik. (b) Bar diagram showing rainfall reconstruction of the Lower and Middle Siwalik. Abbreviations as in Figure 7.

Quantitative climate reconstruction of the Lower and Middle Siwalik using the Coexistence Approach (CA) (present study) and Climate Leaf Analysis Multivariate Program (CLAMP) (previous study)

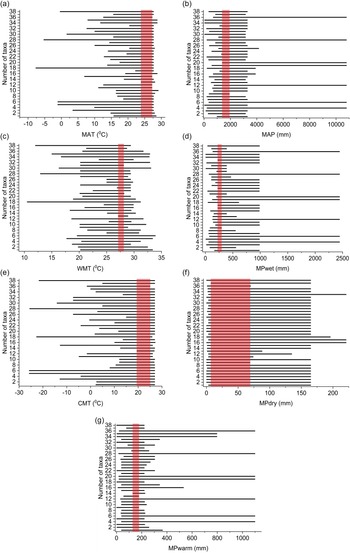
In the Middle Siwalik, 38 NLR taxa have been used for the climate reconstruction (Fig. 9) and a list of all the fossils, their NLRs and numerical identifiers are provided in Table 2. The reconstructed temperatures of the Middle Siwalik flora are: 25.5 ± 1.6 °C for the mean annual temperature, 27.6 ± 0.5 °C for the warm month temperature and 22.2 ± 2.8 °C for the cold month temperature (Fig. 8a). The precipitation reconstruction indicates 1652 ± 275 mm for the mean annual precipitation, 260.5 ± 35.5 mm for the mean precipitation during the wettest months, 38 ± 31 mm for the mean precipitation during the driest months and 152.5 ± 24.5 mm for the mean precipitation during the warmest months (Fig. 8b; Table 3). Climatic ranges of all the taxa included as NLRs overlap in the coexistence intervals (Fig. 9), again suggesting a robust result for the Middle Siwalik climate.
Climatic ranges of the NLRs identified for the palaeoflora of the Middle Siwalik of Darjeeling. Red shaded areas: Coexistence Intervals (CIs). (a) Mean annual temperature (MAT). (b) Warm month mean temperature (WMT). (c) Cold month mean temperature (CMT). (d) Mean annual precipitation (MAP). (e) Mean precipitation of the wettest month (MPwet). (f) Mean precipitation of the driest month (MPdry). (g) Mean precipitation of the warmest month (MPwarm). For taxa names, see Table 2.

4. Discussion
4.a. Changing patterns in temperature and rainfall during the Lower and Middle Siwalik succession of the eastern Himalaya
The reconstructed temperature data suggest that the mean annual temperature and cold month temperature were lower by 1.7 °C and 3.4 °C, respectively, in the Middle Siwalik than in the Lower Siwalik as far as the means of their coexistence intervals are concerned, while the warm month temperature was nearly the same (Fig. 8a; Table 3). The overall reconstructed temperature data indicate that a decrease in the mean annual temperature is due to a decrease in temperature of the cooler part of the year, while the warm season remained nearly the same from the Lower to Middle Siwalik (Fig. 8a; Table 3). Our temperature reconstruction is also supported by a previous CLAMP analysis conducted by Khan et al. (Reference Khan, Spicer, Bera, Ghosh, Yang, Spicer, Guo, Su, Jacques and Grote2014) on the Lower and Middle Siwalik of Arunachal Pradesh, eastern Himalaya (Fig. 1). Considering the entire coexistence interval ranges, and confidence intervals cited for the CLAMP results, both methods show overlapping returns for all temperature estimates (Table 3). Khan et al. (Reference Khan, Spicer, Bera, Ghosh, Yang, Spicer, Guo, Su, Jacques and Grote2014) also inferred a decreasing trend in mean annual temperature and cold month temperature by 2.6 °C and 4.3 °C, while the warm month temperature remains the same (Table 3). The CLAMP methodology is entirely different from that of the CA and is based on the physics of leaf morphology and climate relationships, which is independent of taxonomic affinities (Yang et al. Reference Yang, Spicer, Spicer, Arens, Jacques, Tao, Kennedy, Herman, Steart, Srivastava, Mehrotra, Valdes, Mehrotra, Zhou and Lai2015).
The rainfall reconstruction suggests a lower mean annual precipitation, mean precipitation during the wettest months and mean precipitation during the warmest months in the Middle Siwalik than in the Lower Siwalik (Table 3). This suggests that the Middle Siwalik was much drier than the Lower Siwalik. The data also imply that increased dryness in the Middle Siwalik was due to reductions in pre-monsoon (March–May/MAM) (MPwarm) and monsoon rainfall (June–September/JJAS) (MPwet) (Table 3).
The overall reconstructed climate data from the present and previous reconstructions (Table 3) suggest a cooling trend, particularly in the cooler (MPdry) part of the year and a decrease in pre-monsoon (MPwarm) and summer monsoon (MPwet) rainfall from the Lower to Middle Siwalik in the eastern Himalaya (Table 3).
In the western Himalaya, Sanyal et al. (Reference Sanyal, Bhattacharya, Kumar, Ghosh and Sangode2004), based on oxygen isotopes, suggested a high annual rainfall total at ∼10.5 Ma, which subsequently weakened during 10.5–6 Ma, and again became high at 6 Ma, with a peak at 5.5 Ma. However, in the central Himalayan Siwalik, Sanyal et al. (Reference Sanyal, Bhattacharya and Prasad2005) inferred that the monsoon became stronger after 8 Ma and attained a high level at ∼6 Ma, and subsequently diminished at ∼4 Ma to a level lower than that at 8 Ma. In a comparative study between the western and eastern Himalayan Siwalik, Vögeli et al. (Reference Vögeli, Najman, van der Beek, Huyghe, Wynn, Govin, van der Veen and Sachse2017) suggested that the modern E–W differentiation in climate was already established at ∼7 Ma. Regional changes towards a more seasonal climate in the west were linked to a decrease in the winter precipitation, while the eastern part remained year-round humid, due to the proximity of an abundant moisture source from the Bay of Bengal. Srivastava et al. (Reference Srivastava, Paudayal, Utescher and Mehrotra2018) suggested that the Middle (9.5–6.8 Ma) Siwalik was drier than the Lower (∼13–11 Ma) Siwalik, and this was most likely due to a decrease in rainfall during the winter season (dry season). A decrease in rainfall was also recorded from the Siwalik of Pakistan and Nepal during late Miocene time (10.5–6 Ma) (Dettman et al. Reference Dettman, Kohn, Quade, Ryerson, Ojha and Hamidullah2001; Badgley et al. Reference Badgley, Barry, Morgan, Nelson, Behrensmeyer, Cerling and Pilbeam2008), while increased evaporation of soil and leaf water was recorded from the upper Miocene (∼9–6 Ma) of Pakistan (Nelson, Reference Nelson2005; Badgley et al. Reference Badgley, Barry, Morgan, Nelson, Behrensmeyer, Cerling and Pilbeam2008). Hydrogen isotope data from the Bengal Fan show variability from 10.2 to 7.4 Ma and an increasing trend after 7.4 Ma, which suggests drying (Polissar et al. Reference Polissar, Uno, Phelps, Karp, Freeman and Pensky2021).
The cooling in temperature and weakening of the Asian summer monsoon during the Neogene period have also been reported from other terrestrial and marine archives. Sanyal et al. (Reference Sanyal, Bhattacharya, Kumar, Ghosh and Sangode2004), on the basis of an oxygen isotopic study from the Siwalik of the western Himalaya, inferred that the ISM strength was higher in late Miocene time than in Pliocene time. The palynological evidence from the Surai Khola section of Nepal indicates a cooling from late Miocene to Pliocene times (Hoorn et al. Reference Hoorn, Ohja and Quade2000).
Neogene chemical weathering data from ODP site 718 (Bengal Fan) and Indus Marine A-1 well (Arabian Sea), along with sedimentation rates from the Indus fan, indicate an overall wetter climate in middle Miocene time than in late Miocene–Pliocene times (Clift et al. Reference Clift, Hodges, Heslop, Hanningan, Long and Calves2008) (Fig. 1). Moreover, recent data of increasing haematite/goethite ratios from International Ocean Discovery Program Site U1456 indicate an overall long-term drying after ∼7.7 Ma (Clift et al. Reference Clift, Kulhanek, Zhou, Bowen, Vincent, Lyle and Hahn2020) (Fig. 1). Studies based on inorganic and organic proxies derived from marine archives from the Arabian Sea, Bay of Bengal and South China Sea have inferred that the decrease in temperature and overall rainfall during late Miocene–Pliocene times might be linked with the Northern Hemisphere glaciation/cooling (Wei et al. Reference Wei, Li, Liu, Shao and Liang2006; Miao et al. Reference Miao, Warny, Clift, Liu and Gregory2017; Clift et al. Reference Clift, Kulhanek, Zhou, Bowen, Vincent, Lyle and Hahn2020). All the aforesaid data either derived from continental sediments or marine sediments suggest a drying (mean annual) trend during the Neogene period.
However, recent climate modelling suggests the late Miocene to Pliocene as being a time of ‘supermonsoon’ and high annual rainfall total, based on overall rainfall modelled for East Asia (Farnsworth et al. Reference Farnsworth, Lunt, Robinson, Valdes, Roberts, Clift, Markwick, Su, Wrobel, Bragg, Kelland and Pancost2019). In the future, more quantitative terrestrial palaeoclimate data are required from different regions of south Asia to better understand the linkages of a decrease in temperature and Asian monsoon dynamics during the Neogene period.
4.b. Climate and vegetation changes during Lower and Middle Siwalik time in the Himalaya
The vegetation reconstructions suggest that the Middle Siwalik (Fig. 4c) flora was more diverse than the Lower Siwalik (Fig. 4a), but many families were common to both. However, families such as Combretaceae, Meliaceae and Myrtaceae were exclusive to the Lower Siwalik (Fig. 4a), while Apocynaceae, Asteraceae, Bombacaceae, Burseraceae, Calophyllaceae, Clusiaceae, Dilleniaceae, Ebenaceae, Lauraceae, Lythraceae, Marantaceae, Oleaceae, Poaceae, Rutaceae, Sabiaceae, Verbenaceae and Vitaceae were present only in the Middle Siwalik (Fig. 4c). In the Lower Siwalik, the Flacourtiaceae family was the most dominant and was followed by members of the Fabaceae, Anacardiaceae, Annonaceae and Dipterocarpaceae. The Fabaceae family was the most dominant in the Middle Siwalik and was followed by Dipterocarpaceae, Annonaceae, Malvaceae and Sapindaceae (Fig. 4a, c).
In the Lower Siwalik, evergreen taxa dominated over those typical of moist deciduous vegetation (Fig. 4b), while in the Middle Siwalik evergreen taxa decreased significantly and those classed as moist deciduous increased (Fig. 4d). The forest types of the Siwalik overall suggest that the evergreen taxa decreased significantly, while moist deciduous and evergreen to moist deciduous taxa increased from the Lower to Middle Siwalik (Fig. 4b, d). This change in the forest type coincides with the longer dry season (Champion & Seth, Reference Champion and Seth1968). Overall, the dominance of moist deciduous forest in the Middle Siwalik in comparison to the Lower Siwalik suggests an increase in seasonal aridity.
C4 plants are physiologically more efficient than C3 plants and can survive under more extreme conditions such as drought, high temperatures and low CO2 concentration. This allows them to broaden their ecological niches (Lundgren et al. Reference Lundgren, Christin, Escobar, Ripley, Besnard, Long, Hattersley, Ellis, Leegood and Osborne2016) and survive in a variety of habitats from low to high latitudes, from desert to submerged conditions, open grassland to forest understorey, and from nutrient depleted to fertile soils (Christin & Osborne, Reference Christin and Osborne2014). Molecular phylogenetic studies reveal that the C4 plants evolved between 33 and 25 Ma (Gaut & Doebley, Reference Gaut and Doebley1997; Bouchenak-Khelladi et al. Reference Bouchenak-Khelladi, Verboom, Hodkinson, Salamin, Francois, Chonghaile and Savolainen2009) and were most likely favoured by the lowering of atmospheric CO2 concentration during Oligocene–early Miocene times (Tipple & Pagani, Reference Tipple and Pagani2007). The available isotopic data indicate that the expansion of C4 plants was not synchronous either globally (Quade et al. Reference Quade, Cerling and Bowman1989, Reference Quade, Solounias and Cerling1994; Cerling, Reference Cerling1992; Cerling & Quade, Reference Cerling, Quade, Swart, Lohmann, McKenzie and Savin1993; Cerling et al. Reference Cerling, Wang and Quade1993; Kingston et al. Reference Kingston, Marino and Hill1994; Latorre et al. Reference Latorre, Quade and McIntosh1997; Fox & Koch, Reference Fox and Koch2003, Reference Fox and Koch2004; Feakins et al. Reference Feakins, deMenocal and Eglinton2005) or regionally (Sanyal et al. Reference Sanyal, Sarkar, Bhattacharya, Kumar, Ghosh and Agrawal2010).
A large number of studies have been conducted in the western and central Himalayan Siwalik to understand the vegetation shift and expansion of C4 plants (Quade et al. Reference Quade, Cerling and Bowman1989, Reference Quade, Cater, Ojha, Adam and Harrison1995; Tanaka, Reference Tanaka1997; Hoorn et al. Reference Hoorn, Ohja and Quade2000; Sanyal et al. Reference Sanyal, Bhattacharya, Kumar, Ghosh and Sangode2004, Reference Sanyal, Bhattacharya and Prasad2005, Reference Sanyal, Sarkar, Bhattacharya, Kumar, Ghosh and Agrawal2010; Singh et al. Reference Singh, Parkash, Awasthi and Kumar2011; Srivastava et al. Reference Srivastava, Paudayal, Utescher and Mehrotra2018; Karp et al. Reference Karp, Behrensmeyer and Freeman2018, Reference Karp, Uno, Polissar and Freeman2021; Tauxe & Feakins, Reference Tauxe and Feakins2020); however, few studies have been done in the eastern Himalayan Siwalik (Vögeli et al. Reference Vögeli, Najman, van der Beek, Huyghe, Wynn, Govin, van der Veen and Sachse2017). The isotopic data available from the western Himalayan Siwalik indicate that C4 plants expanded during late Miocene time (Singh et al. Reference Singh, Parkash, Awasthi and Kumar2011 and references therein), and an increase in the dryness was inferred as the most plausible cause of their expansion (Quade et al. Reference Quade, Cerling and Bowman1989, Reference Quade, Cater, Ojha, Adam and Harrison1995; Tanaka, Reference Tanaka1997; Hoorn et al. Reference Hoorn, Ohja and Quade2000; Sanyal et al. Reference Sanyal, Bhattacharya, Kumar, Ghosh and Sangode2004, Reference Sanyal, Bhattacharya and Prasad2005; Srivastava et al. Reference Srivastava, Paudayal, Utescher and Mehrotra2018). Sanyal et al. (Reference Sanyal, Sarkar, Bhattacharya, Kumar, Ghosh and Agrawal2010), based on the isotopic data, suggested that the timing and nature of enrichment in the carbon isotope ratio varied from one section to another, implying that the expansion of C4 plants in different zones of the Indian Siwaliks did not take place at the same time. They further suggested that changing monsoon intensity was not the sole cause for C4 plant expansion in this region because monsoon intensity and C4 plant expansion do not show a one to one correlation. Moreover, recent studies based on isotopic (oxygen and carbon) data derived from leaf wax and bivalves archived in marine (Arabian Sea and Indus River Basin) and continental (western and central Himalayan Siwalik) sediments indicate that the increase in aridity paved the way for the expansion of C4 plants over C3 plants (Dettman et al. Reference Dettman, Kohn, Quade, Ryerson, Ojha and Hamidullah2001; Huang et al. Reference Huang, Clemens, Liu, Wang and Prell2007; Suzuki et al. Reference Suzuki, Yamamoto and Seki2020).
Palaeoclimatic data from the Siwalik succession of the western and central Himalaya suggest that the expansion of C4 plants is linked to a weakening of winter rainfall brought by the WDs (Vögeli et al. Reference Vögeli, Najman, van der Beek, Huyghe, Wynn, Govin, van der Veen and Sachse2017; Srivastava et al. Reference Srivastava, Paudayal, Utescher and Mehrotra2018). The WDs are the atmospheric disturbances which bring rainfall particularly to northern India during the winter season. They originate mainly in the Mediterranean or West Atlantic region. In the Himalayan region, the WDs intensify owing to high orography and are the main source of snowfall over the region (Dimri & Chevuturi, Reference Dimri and Chevuturi2016). Sometimes WDs bring heavy rainfall and heavy snowfall over the northwestern Himalaya during the winter season (Dimri & Mohanty, Reference Dimri and Mohanty1999; Dimri, Reference Dimri2006). In northern India, the WDs have an impact in delaying or advancing the ISM (Das et al. Reference Das, Mukhopadhyay, Dandekar and Kshirsagar2002). Beyond that, Wu et al. (Reference Wu, Guo, Guiot, Hatté, Peng, Yu, Ge, Li, Sun and Zhao2014) and Srivastava et al. (Reference Srivastava, Paudayal, Utescher and Mehrotra2018) have also pointed out the role of higher temperatures, particularly in the cooler part of the year, in the expansion of C4 plants during the Middle Siwalik.
In contrast to the western and central Himalayan Siwalik, few studies are available for the eastern Himalaya to understand the C3–C4 vegetation change. Isotopic data from the Kameng section of the Arunachal Pradesh Siwalik suggested a persistent C3 vegetation since 13 Ma, and this is most likely explained by the absence of seasonal climate and lack of aridity, owing to the abundant moisture supply from the Bay of Bengal (Vögeli et al. Reference Vögeli, Najman, van der Beek, Huyghe, Wynn, Govin, van der Veen and Sachse2017). For the Darjeeling Siwalik no study has been done so far to understand possible C3 and C4 vegetation shifts during the Neogene period. However, our quantitatively reconstructed climate and vegetation data are important in understanding the dominance of seasonal forest in the Middle Siwalik (late Miocene–Pliocene) in comparison to the Lower Siwalik (middle Miocene). This expansion of seasonal forest can be related to the decrease in rainfall in the pre-monsoon (MPwarm) and monsoon seasons (MPwet) (Table 3). C4 plants preferentially grow in seasonal forests, compared to forests that have no seasonal climate (Srivastava et al. Reference Srivastava, Paudayal, Utescher and Mehrotra2018).
Recently, Ghosh et al. (Reference Ghosh, Sanyal, Sangode and Nanda2018, Reference Ghosh, Bera, Roy and Sanyal2021) suggested that changes in C3/C4 vegetation may also depend on the substrate (sand/clay). They explained that areas of fine-grained (silt and clay) overbank sediments, far from the active channels, have a pore water deficiency and favour the growth of C4 plants. A comparative study of the sedimentary structures among different Siwalik regions indicates that the abundance of fine-grained (silt and clay) overbank sediments is higher in the western Siwalik than the central and eastern Siwalik. The strong correlation between δ13C values and abundance of fine-grained (silt and clay) overbank sediments across different Siwalik regions suggests a significant influence of substrate on the abundance of C4 plants (Ghosh et al. Reference Ghosh, Sanyal, Sangode and Nanda2018, Reference Ghosh, Bera, Roy and Sanyal2021). Therefore, substrate level control in limiting the growth of C4 vegetation since 13 Ma in NE India cannot be ignored. Moreover, the marine influence in the Himalayan Foreland Basin of NE India might also have imposed some restriction on the growth of C4 vegetation, but this needs further investigation.
Overall, the aforesaid discussion indicates that more studies are required, particularly on the northeastern part of India, to understand the vegetation–climate relationship.
5. Conclusions
The climate of the Lower (middle Miocene) and Middle (late Miocene–Pliocene) Siwalik succession of Darjeeling (eastern Himalaya) was reconstructed using the Coexistence Approach. The reconstructed mean annual temperature and cold month temperature show a decreasing trend, while the warm month temperature remained the same from the Lower to Middle Siwalik. The CA result suggests that pre-monsoon (MPwarm) and summer monsoon rainfall (MPwet) decreased significantly from the Lower to Middle Siwalik, while winter rainfall (MPdry) remained nearly the same. The floristic assemblages suggest a vegetation shift from the dominance of evergreen taxa in the Lower Siwalik to more deciduous taxa during the Middle Siwalik. The data also suggest that the Middle Siwalik flora was more diverse than that of the Lower Siwalik.
Supplementary material
To view supplementary material for this article, please visit https://doi.org/10.1017/S0016756822000243
Acknowledgements
GS, HB and RCM are thankful to the director of the Birbal Sahni Institute of Palaeosciences, Lucknow for providing necessary facilities and encouragement during the research work. The present work was supported by SERB, New Delhi funded project no. CRG/2019/002461 and Chinese Academy of Sciences President’s International Fellowship Initiative (no. 2018VMC0005) awarded to GS. The present work is a contribution to the NECLIME (Neogene Climate Evolution of Eurasia). The authors are thankful to Robert A. Spicer and two anonymous reviewers for their constructive suggestions to improve the manuscript.
Conflicts of interest
None.