Introduction
The profile of scrapie has risen in recent years, with increasing public awareness that it is a disease that resembles BSE (bovine spongiform encephalopathy) in cattle and CJD (Creutzfeldt Jakob disease) in man. Eradication of scrapie is part of an EU control programme, to protect against the theoretical risk that BSE is present in sheep and goat populations, masked as scrapie. Major government intervention to bring scrapie under control has been a combination of selecting more resistant stock and closer surveillance of sheep and goat populations. Following recommendations of the Spongiform Encephalopathy Advisory Committee (SEAC), the UK National Scrapie Plan (NSP) was launched in July 2001 with the aim of increasing genetic resistance to scrapie. The genotypes that confer resistance/susceptibility to scrapie are categorised into five groups (Dawson et al., Reference Dawson, Hoinville, Hosie and Hunter1998; Warner, Reference Warner2003) (Group I = highest resistance, Group V = lowest resistance), and not only reflect potential resistance/susceptibility but also the potential for breeding animals to transfer alleles for resistance/susceptibility to their offspring.
However, rapid breeding for resistance of scrapie has been a concern, particularly in breeds where frequencies of resistant alleles are low or in rare breeds with smaller populations to select resistant animals from Gmur et al. (Reference Gmur, Gaillard and Dolf2004). It has been argued that selecting for just one genotype (ARR/ARR) could lead to unhealthy homogeneity (Elsen et al., Reference Elsen, Amigues, Schelcher, Ducrocq, Andréoletti, Eychenne, Tien Khang, Poivey, Lantier and Laplanche1999). Kao et al. (Reference Kao, Houston, Baylis, Chihota, Goldmann, Gravenor, Hunter and Mclean2003) advised caution although generally the ARR/ARR genotype appeared more resistant. Slate (Reference Slate2005) argued the possibility of other scrapie strains that might attack these genetically uniform animals in the future. Woolhouse et al. (Reference Woolhouse, Coen, Matthews, Foster, Elsen, Lewis, Haydon and Hunter2001) suggested that resistant types might still carry disease without showing obvious symptoms, although there has been no evidence of this to date (Houston et al., Reference Houston, Goldman, Chong, Jeffrey, Gonzalez, Foster, Parnham and Hunter2003). Therefore, further research is required to evaluate the possible consequences of selecting for resistance in large populations (Elsen et al., Reference Elsen, Amigues, Schelcher, Ducrocq, Andréoletti, Eychenne, Tien Khang, Poivey, Lantier and Laplanche1999). Bossers et al. (Reference Bossers, De Vries and Smits2000) suggested that selection for several PrP variants associated with resistance would be a safer strategy and would contribute to a more genetically diverse sheep population.
It is possible that scrapie-resistant sheep may be poorer for other traits that breeders value, such as meat or wool quality. Therefore, it is important to keep selection for resistance when there is low scrapie risk in perspective (Dawson et al., Reference Dawson, Hoinville, Hosie and Hunter1998). There have been numerous studies recently on the association of PrP genotype with dairy traits (Barillet et al., 2002; De Vries et al., Reference De Vries, Hamann, Drogemuller, Ganter and Distl2005), reproductive (De Vries et al., Reference De Vries, Hamann, Drogemuller, Garter and Distl2004b; Ponz et al., Reference Ponz, Tejedor, Montengudo and Arruga2006; Vitezica et al., Reference Vitezica, Moreno, Bodin, Francois, Barillet, Brunel and Elsen2006), growth, carcass and meat quality (Roden et al., 2001; De Vries et al., Reference De Vries, Borchers, Hamann, Drogemuller, Reinecke, Lupping and Distl2004a; Isler et al., Reference Isler, Freking, Thallman, Heaton and Leymaster2006) traits on a number of breeds. It has been suggested that susceptible genotypes have remained in the sheep population due to positive associations with commercial traits (Brandsma et al., Reference Brandsma, Janss and Visscher2004). A focus on scrapie genotype alone may prove risky if resistant alleles are antagonistic to other economically important traits, or if they are sufficiently rare that selection for them increases inbreeding and reduces genetic variability. Research so far has provided little evidence that PrP polymorphisms have phenotypic effects on, or linkage associations with, any other traits apart from scrapie resistance.
The aim of the study is to determine the frequency of genotypes in the CAMDA Welsh Mountain flock and to investigate whether there is an association between PrP genotype and weight and ultrasonically scanned traits.
Material and methods
Source of the animals
Data were obtained from the CAMDA Welsh Mountain flock, the longest-established and the first Group Breeding Scheme in the UK, set up in 1976. Scrapie testing was carried out in years 2001 to 2004, inclusive, under various schemes (The Ram Genotyping Scheme and Welsh Ewe Genotyping Scheme (WEGS)) of the National Scrapie Plan (NSP), on breeding animals and lambs that would potentially be used for breeding. Blood was collected into EDTA tubes and sent to a laboratory for genotyping. Each animal tested had a bolus inserted with an NSP electronic identification number. The traits recorded by Signet were eight-week weight (EWW), weight at ultrasonic scanning (SW) measured at ca. 20 weeks, ultrasonic muscle depth (MD) and ultrasonic fat depth (FD). Ultrasonic SW measurements of MD and FD were taken from the third lumbar vertebra (Signet, 2007). Not all animals with genotype records were identified in the Signet records, and therefore not all data were used in the study.
The analyses used a dataset with 11595 animals; however, there were only 971 animals with genotype records. Genotyped animals consisted of 116 male and 855 female animals. Fewer males were genotyped as animals were generally only tested if they would be kept for breeding. Genotyped animals were born in years 1997 to 2004. Genotyped animals in years with few records were excluded because effects of year and genotype could be confounded. Non-genotyped animals were not used in the comparisons in the association study. The numbers of records from genotyped animals for EWW, SW, MD and FD were 971, 656, 625 and 626, respectively.
Data analysis and models
For the study of PrP genotypes and their association with other traits, three types of analysis were performed using differing classifications of the PrP genotype.
Analysis 1: by genotypes
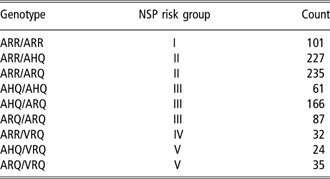
Ten genotypes were found in the CAMDA flock, but records for the VRQ/VRQ were removed because there were few animals in the group; thus nine classes remained (Table 1).
The distribution of animals by genotype for EWW
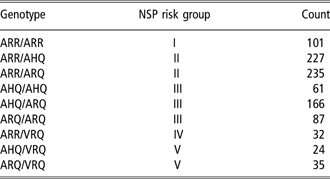
The numbers in each genotype for SW, MD and FD are smaller because of the smaller number of observations for these traits (total n = 656, 625 and 626 for SW, MD and FD).
Analysis 2: by risk categories
The 10 genotypes were put into four categories based upon the NSP risk groups (Table 1). Due to the weaknesses of data structure (there were few observations for some genotypes) risk categories 4 and 5 of the NSP were combined. The four groups were as follows: (1) ARR homozygous (NSP Group I); (2) ARR heterozygous with either AHQ or ARQ (NSP Group II); (3) AHQ homozygous, ARQ homozygous or AHQ/ARQ (NSP Group III); (4) VRQ heterozygous with ARR (NSP Group IV), AHQ or ARQ and VRQ homozygous (NSP Group V).
Analysis 3: by number of alleles
Four analyses were carried out for each of the four traits. Animals were categorised into classes depending on whether they carried 2, 1 or 0 copies of an allele. The four classes were as follows: (1) ARR allele: ARR/ARR, ARR/XXX, XXX/XXX; (2) AHQ allele: AHQ/AHQ, AHQ/XXX, XXX/XXX; (3) ARQ allele: ARQ/ARQ, ARQ/XXX, XXX/XXX; and (4) VRQ allele: VRQ containing, XXX/XXX, where XXX represents alleles other than the one specified. For the analysis of the VRQ allele, VRQ homozygous animals were grouped with the VRQ heterozygous animals.
Chosen models
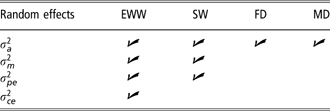
Models were initially tested for each trait to determine the fixed and random effects to be included (Table 2). PrP genotype was included as a fixed effect in addition to age of dam, year of birth, sex, birth rearing type and, for EWW only, the two- and three-way interactions between the latter three effects.
Random effects used in the models of EWW, SW, FD and MD
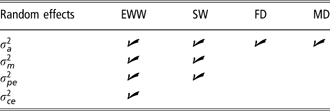
σ 2a direct additive effect; σ 2m maternal additive genetic variance; σ 2pe maternal permanent environmental variance and σ 2ce maternal common environmental variance.
The analyses were run using ASReml for all four traits (Gilmour et al., 2002). Convergence of logL was reached for each analysis and t-tests were carried out to determine the significance of differences between all possible pairwise comparisons of PrP genotype groups. The critical probability was P ⩽ 0.05, and Bonferroni corrections were also applied to Analyses 2 and 3. They were calculated as 0.0125 (P < 0.05/4) for Analysis 2 (genotype risk groups) and 0.0166 (P < 0.05/3) for Analysis 3 (number of alleles). The divisors in the Bonferroni correction were related to the number of comparisons in the analysis, e.g. in Analysis 2 there were four genotype risk groups.
Results
Description of allele and genotype frequencies
All 10 of the possible genotypes from four alleles (namely AHQ, ARQ, ARR and VRQ) were observed. The ARR allele was most common (35.8%), followed by ARQ (31.4%), AHQ (27.8%) and VRQ (5.0%). Overall, the most common genotype was ARR/ARQ (24.2%), followed by ARR/AHQ (23.4%), AHQ/ARQ (17.1%), ARR/ARR (10.4%), ARQ/ARQ (9.0%) and AHQ/AHQ (6.3%). The less-common genotypes contained the VRQ allele and were ARQ/VRQ (3.6%), ARR/VRQ (3.3%), AHQ/VRQ (2.5%) and VRQ/VRQ (0.3%). There has been a change in allele proportions since selection started in 2001 for resistant genotypes. The ARR allele increased from 24.4% in 2001 to 48.6% in 2004, whereas the other alleles decreased. Similarly, the most resistant genotypes, those containing the ARR allele (NSP Groups I and II), increased in frequency and the most susceptible, those containing the VRQ allele (NSP Groups IV and V), decreased in frequency in the same years.
Analysis 1: by genotypes
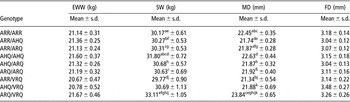
The highest mean measurements for EWW, SW and MD were from ARQ/VRQ, followed by AHQ/AHQ, whereas minimum mean measurements were from ARR/VRQ. Maximum and minimum mean measurements for FD were from genotypes AHQ/VRQ and both AHQ/ARQ and ARR/AHQ, respectively. There were no significant differences between genotypes for EWW or FD. However, some pairwise comparisons were significant for traits SW and MD (Table 3). For SW, the AHQ homozygote had a significantly heavier mean SW than genotypes containing the ARR allele. Also, ARQ/VRQ had a significantly heavier mean SW than all other genotypes except AHQ/AHQ and AHQ/VRQ. For MD, ARQ/VRQ had a significantly higher mean MD than all other genotypes bar AHQ/AHQ. Also there were significant differences between ARR homozygotes and both ARR/ARQ and ARR/VRQ, AHQ homozygotes and both ARR/AHQ and ARR/VRQ, and ARQ homozygotes and ARR/ARQ. It should be noted that there were relatively few animals of the AHQ/AHQ and VRQ-containing genotypes.
Analysis 1: by genotypes

Estimated means and standard deviations for nine genotypes found in the CAMDA flock for eight-week weight (EWW), scan weight (SW), muscle depth (MD) and fat depth (FD).
Genotypes with the same letter superscripts were significantly different from each other at P ⩽ 0.05.
Analysis 2: by risk categories
Group II had the greatest number of animals and Group IV had the fewest. With the exception of one result, it was observed that there were no significant differences between the four risk groups (Table 4). Group I had a significantly higher mean than Group II for MD.
Analysis 2: by risk categories

Estimated means and standard deviations for eight-week weight (EWW), scan weight (SW), muscle depth (MD) and fat depth (FD).
*Significant at both P ⩽ 0.05 and P ⩽ 0.0125 (Bonferroni correction).
Analysis 3: by number of alleles
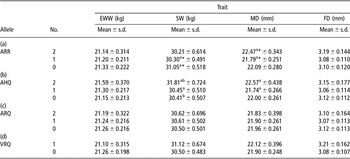
There were no significant differences in traits EWW and FD in each of the allele categories (Table 5). For SW there were significant differences between ARR/XXX and XXX/XXX, between AHQ/AHQ and AHQ/XXX, and between AHQ/AHQ and XXX/XXX. However, the latter two comparisons were not significant when Bonferroni corrections were used. For SW, the genotype with no ARR allele had a significantly heavier mean than the heterozygous ARR genotype. Also, the homozygous AHQ genotype had a significantly heavier mean than a genotype with one or no AHQ alleles (when Bonferroni correction was not used). For MD there was a significant difference between ARR/ARR and ARR/XXX and between AHQ/AHQ and AHQ/XXX, but again the latter comparison was not significant with the use of Bonferroni correction (Table 5). Both ARR and AHQ homozygotes had higher means than their corresponding heterozygotes.
Analysis 3: by number of alleles

Estimated means and standard deviations for classes categorised on whether there are 2, 1 or 0 copies of alleles (a) ARR, (b) AHQ, (c) ARQ and (d) VRQ for eight-week weight (EWW), scan weight (SW), muscle depth (MD) and fat depth (FD).
a,bSignificant when P ⩽ 0.05.
*Significant at both P ⩽ 0.05 and P ⩽ 0.016 (Bonferroni correction).
Discussion
As previously found by Lonyong et al. (2004), four alleles were present in the CAMDA flock, namely AHQ, ARQ, ARR and VRQ, and these gave rise to 10 genotypes covering all the five risk categories designated by the NSP. Initial PrP genotype frequencies are a determining factor on the time it would take a flock to become fully resistant (Lonyong, Reference Lonyong2003). The allele frequencies were similar to that found by Roden et al. (Reference Roden, Nieuwhof, Bishop, Jones, Haresign and Gubbins2006) in the Welsh Mountain breed, using a sample size of over 96 000 animals tested during 2001 to 2003, and by Eglin et al. (Reference Eglin, Warner, Gubbins, Sivam and Dawson2005). The ARH allele was reported in both studies above but was only present in 0.1% of the sample, thus indicating its rarity in the Welsh Mountain breed.
Eglin et al. (Reference Eglin, Warner, Gubbins, Sivam and Dawson2005) reported considerable variations in the distribution of NSP risk groups within and between sectors of the sheep industry. It has been reported that hill breeds tend to have a lower proportion of NSP Group I genotypes, and a greater proportion of Group III genotypes, than that of the non-hill breeds. In the CAMDA flock the proportions in NSP Groups I, II and III were 10.4%, 47.6% and 32.3%. Hill breeds generally have high frequencies of ARQ and AHQ alleles (Eglin et al., Reference Eglin, Warner, Gubbins, Sivam and Dawson2005), and hence have many animals in NSP Groups III and II. Proportions in NSP Groups IV and V were low, with values of 3.3% and 6.4%, respectively; and generally in most breeds NSP Group V tends to have a proportion of less than 10% (Eglin et al., Reference Eglin, Warner, Gubbins, Sivam and Dawson2005).
After the first genotyping in 2001, the CAMDA group carried out selective breeding and culling in an attempt to improve the genetic resistance of the flock to scrapie. Thus, it was expected that within the following years there would be an increase in the allele conferring most resistance (ARR) and a decrease in the allele that confers least resistance (VRQ).
It has been well documented that there are significant differences among breeds in the genotypes that are susceptible to scrapie, depending upon which alleles are present. Studies have indicated that in breeds that carry the VRQ allele, such as the Welsh Mountain, Cheviot, Swaledale and Shetland, scrapie occurs mostly in genotypes VRQ/VRQ and ARQ/VRQ, and rarely in AHQ/VRQ and ARR/VRQ genotypes (Dawson et al., Reference Dawson, Hoinville, Hosie and Hunter1998). Overall the ARR allele that confers resistance was the most common allele, probably as a result of recent selection in the CAMDA flock. The ARQ allele was the next most frequent allele, and has been reported as the most common in the UK. Overall ARQ/ARR was the most common genotype in the CAMDA flock (24%), as well as being reported as the most common in the UK. A small proportion (<4%) had the ARQ/VRQ genotype, which is thought to be highly susceptible, accounting for over 50% of the reported cases in the UK (Baylis et al., Reference Baylis, Chihota, Stevenson, Goldmann, Smith, Sivarn, Tongue and Gravenor2004). The AHQ allele was also quite frequent in the CAMDA flock, and was reported as relatively abundant in hill breeds by Eglin et al. (Reference Eglin, Warner, Gubbins, Sivam and Dawson2005). The AHQ allele was observed mostly in the ARR/AHQ genotype, which would be expected to be quite resistant if exposed. Genotypes with the VRQ allele are thought to have the greatest scrapie risk and were the least common in the CAMDA flock (<10%).
Tranulis (Reference Tranulis2002) suggested that, given the large number of different PrP genotypes in many sheep breeds, a major association between PrP and selected traits would be improbable. Results from this study indicate little evidence that there is any association between PrP genotype and the four traits analysed, and selection for the ARR allele did not appear to be detrimental to these traits.
In the analysis of genotypes, AHQ homozygotes had a significantly higher mean scan-weight than ARR homozygotes and heterozygous genotypes. The AHQ allele is regarded as conferring fairly high resistance; therefore, selection of genotypes carrying the allele should not be detrimental. However, ARQ/VRQ, probably the most susceptible of the genotypes analysed, had a significantly higher mean scan weight than six of the other eight genotypes. This may indicate that selecting against VRQ may decrease SW. However, there were few animals in some genotype classes, which may lead to weaknesses in data structure; hence, it might be sensible to treat some of the results obtained in the analysis with caution.
The use of the Bonferroni correction have been used in similar types of analyses (Vitezica et al., Reference Vitezica, Moreno, Bouix, Barillet, Perret and Elsen2005; Man et al., 2006; Sawalha et al., 2006), but its use, which reduces the likelihood that values will be described as significant, is sometimes questionable. In the genotype risk category analysis there was a significant difference at P ⩽ 0.05 between Group I and Group II for MD but it was not significant when Bonferroni correction was applied. Group I was significantly better in the trait than Group II, and thus selecting the more resistant genotype would not be damaging to the breeding objective of increased lean meat. As expected, a similar association was observed in the allele analysis for the ARR allele; however, the difference in MD between genotypes with one and two copies of the allele was also significant when Bonferroni correction was applied. There were significant differences at P ⩽ 0.05 between AHQ/AHQ and AHQ/XXX for SW and MD and between AHQ/AHQ and XXX/XXX for SW; however, none of these differences were significant when the Bonferroni correction was applied. It should be noted that the frequency of AHQ/AHQ was fairly low.
There has not been strong evidence from other studies that there is an association between PrP genotype and performance traits; however, some associations have been found. In the Romanov breed, the resistant ARR haplotype was associated with longer carcasses, narrow rumps, and less marbling than the ARQ and VRQ haplotypes (Isler et al., Reference Isler, Freking, Thallman, Heaton and Leymaster2006). Selection of ARR/ARR genotypes had a small positive effect on litter size in the Texel, but a small negative effect on 135-day weight (Brandsma et al., Reference Brandsma, Janss and Visscher2004). In Ripollesa sheep the ARH allele was associated with an increased litter size (Casellas et al., Reference Casellas, Caja, Bach, Francino and Piedrafita2007). De Vries et al. (Reference De Vries, Borchers, Hamann, Drogemuller, Reinecke, Lupping and Distl2004a) found that daily live-weight gain and back MD of the German black-headed sheep breed were better in animals without an ARR allele than in those with an ARR allele; however, this result was based upon a relatively few animals. Ponz et al. (Reference Ponz, Tejedor, Montengudo and Arruga2006) found a lower estimated breeding value for prolificacy of animals with the VRQ/VRQ genotype and therefore concluded selecting against the genotype would not cause a negative effect. Alexander et al. (Reference Alexander, Stobart, Russell, O’Rourke, Lewis, Logan, Duncan and Moss2005) found that Suffolk ewes without the R allele gave birth to more multiple lambs than ewes heterozygous for the allele, and produced lambs with lower individual weaned weights (but a higher total weaned weight). Similarly, Alexander et al. (Reference Alexander, Stobart, Russell, O’Rourke, Lewis, Logan, Duncan and Moss2005) found that in western white-faced commercial flock ewes without the R allele and heterozygotes also produced more lambs than homozygous R ewes, but there were no differences between genotypes in the total weight of lambs weaned. Similarly to this study, some of the above investigations also had small datasets and some genotypes with low frequencies.
Implications
In summary, selection for scrapie resistance will not adversely affect progress in the traits considered. It can be seen that resistance of the CAMDA flock to scrapie is gradually increasing by selecting appropriate breeding animals. An issue arising in the selection of resistant PrP genotype is whether it should be a new criterion incorporated into a selection index, which perhaps should be the case if PrP genotypes are associated with other traits. Currently, tandem selection is applied by selecting upon PrP genotype and traits in the selection index separately. This could be more beneficial as rapid fixation of the resistant gene would reduce future costs of genotyping over generations and it may be more desirable from a marketing perspective (Dekkers, Reference Dekkers2004). There has been limited integration of molecular and quantitative information combined into indices so far, but systems are starting to become available (Dodds et al., Reference Dodds, McEvan and Davis2007). The development of these combined indices will be challenging, such as deriving optimal weightings for candidate genes for both short- and long-term responses to selection.
Acknowledgements
The genotyping was funded through the various schemes of the National Scrapie Plan. The authors would like to thank the CAMDA Welsh Mountain breeding group and the Meat and Livestock Commission for supplying the data.