Data are the foundation of modern observational science. Antarctic data cover all fields of science, but researchers working in Antarctica (south of 60 deg. S) need to function within an international legal framework agreed through the Antarctic Treaty System (ATS 2012) and their coordinating science body, the Scientific Committee on Antarctic Research (SCAR 2012) helps them to do that, especially in the ways in which data are acquired, accessed and shared (Fig. 1). Science is thus done differently in Antarctica – a fact that is neither widely appreciated nor understood in the general science community (e.g., Berkman Reference Berkman2001). For Antarctic data, the Treaty requires open sharing and exchange, and the importance of both collaborative and international efforts has been recognised by the Treaty for the last 50 years.
Map of Antarctica highlighting areas south of 60oS that are covered by the Antarctic Treaty. The logos are for several agencies of importance to Antarctic collaboration in science and data: Antarctic Treaty, SCAR, IPY and SDLS.

Data management covers all aspects of the handling of Antarctic data. This paper instead uses the term ‘data care’ to clearly distinguish an important subset of data management, in particular data searches, integration, presentation, sharing, archival/retrieval, collaborations, innovations/outreach, and reporting; we place greatest emphasis on data sharing, collaborations and archival/retrieval because these have the greatest potential for enhancing future creative collaborative Antarctic research studies.
All researchers and science-managers recognise the importance of acquiring data to create research projects and to promote careers. Yet, few individuals now proactively promote rapid data sharing and requesting and allocating sufficient funds to fully process and archive all of their data. Data sharing is a common issue (Nelson Reference Nelson2009). With rapidly increasing volumes of digital data (Bell et al. Reference Bell, Hey and Szaley2009), data care is fast becoming overly complex and challenging (e.g., Showstack Reference Showstack2009; NAS 2009; AGU 2009), with increasing need for changes in data care.
There are many examples of successful Antarctic Earth science collaborations in the past (e.g., IGY, IPY, ANTOSTRAT, ACE, IODP) and currently (e.g., PAIS, ANDRILL, SDLS), and most have defined data management plans. Projects with great success are those that perceive sciences' relevant needs, inspire researchers from many countries and achieve their success through:
• sharing data with colleagues soon after data collection: and
• fairly reporting data (i.e., research results) by respecting intellectual property rights and attributing data from all colleagues.
Updating the current culture of data care (i.e., science care) to promote greater successes in collaborative studies would ‘raise the bar’ in data/science – we believe this is possible, and below we suggest ways that current science culture might be updated.
Much effort and funding has been directed to data management and most data topics addressed here. However, this paper differs from others in the data management arena, and follows a humanistic approach – ‘a perceive, inspire, achieve and succeed’ theme for progress in Antarctic science. New perspectives on current topics can and will inspire future achievements and successes in Antarctic data care and enhanced collaborations in Antarctic science.
The concepts discussed below have evolved from ideas raised in data discussions and data writings of researchers, data managers and others in the Antarctic data community – and from personal data management and research activities during the great analog-to-digital-world transition of the past 40 years. To others goes the credit for the beneficial concepts and to me goes the remainder.
Definition of terms and acronyms used are in Appendix A.
1. Data acquisition and processing – the digital world
There are hundreds of geoscience data acquisition platforms and systems currently in use by all countries that collect data in Antarctica from satellites to sub-sea (e.g. Fig. 2). The data are processed in situ in real-time or almost real-time or at home after the field season. With few exceptions (e.g., rock samples and ice-cores, sea-water samples, other physical samples), these systems now create large digital data sets that are becoming larger as data-sampling rates increase and additional sensors are added. Current data philosophy is to acquire the highest-resolution digital data (i.e., highest data-sampling) possible to optimise cost and research objectives. The result is the acquisition of vast digital data sets with great potential, but sets that are commonly too large and costly for full processing and analysis. These new data sets thereby result in new challenges in the discovery, access, sharing, distribution, use, archiving and reformatting of the data, as discussed below.
Examples of platforms and systems currently used for data acquisition in Antarctic science: (A) NASA QuickBird satellite (from Uregina 2012); (B) British Antarctic Survey aircraft (from Cosmosmagazine 2008); (C) AWI ship R/V Polarstern (from AWI 2012); (D) Multinational ANDRILL rig (from Riesselman Reference Riesselman2008); (E) ship mapping systems (from USGS 2012).
2. Data access and sharing – enhancing science
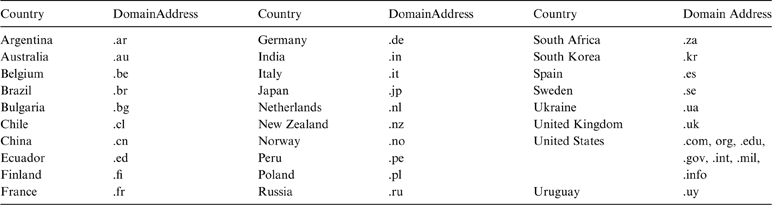
Antarctic science is done principally by researchers from the 28 countries that are currently consultative members of the Antarctic Treaty (Table 1). Consultative countries must maintain a significant interest in Antarctic science; they commonly have stations in Antarctica, they collect data and conduct research there, and researchers from research institutions in those countries publish and archive data.
List of Consultative Parties (Countries) to the Antarctic Treaty as of September 2012, and the common country domain addresses for websites in those countries.
Note: the domain address “.aq” cited herein is exclusively for Antarctica.
Sharing data, and using proper data citations (Parsons et al. Reference Parsons, Duerr and Minster2010) from the outset of a project, is the ultimate statement of trust, respect and congeniality in collaborative research projects with other organisations and nations. The more data shared and accessed, the more discussions and ideas, which leads to the strongest science results. These fundamental tenets are reflected in new initiatives implemented (e.g., Polar Information Commons (PIC 2012), “Open Access” (Suber Reference Suber2010), etc.) and proposed below to provide rapid access to Antarctic data.
3. Data discovery – new search opportunities
Internet global ‘search engines’ (e.g., www.google.com, www.scholar.google.com, www.scirus.com, www.sciencenet.kit.edu; www.ojose.com, etc.) have vastly improved data discovery for all types of data. These ‘engines’ can give website links to institutions (e.g., data repositories), directories (e.g., metadata lists), and specific sources (e.g., individual researchers; research papers) that may have the desired data set.
We give one example using www.scirus.com, which is an ‘engine’ that can, unlike most others, do sequential keyword searches to refine and narrow the search. Other ‘engines’ use character strings to refine searches, but have limitations on the number of characters that can be used. Regardless, all ‘engines’ are useful and give additional results. A simple global scirus.com search for ‘Antarctic bathymetric data’ provides ∼15,000 links. Searching those links for ‘outer shelf’ gives ∼1,600 links and then searching those links for ‘Antarctic Peninsula’ gives ∼500 links. A search for websites in just Russia and the United Kingdom (Table 1) for ‘Antarctic bathymetry data’ (url:.ru OR url:.uk); yields about 1,500 links.
Such searches provide a fast way to locate data globally or in specific countries. Still, sometimes the best way to locate a specific data set is to ask a colleague who is working in that science field.
4. Data integration – collections and maps
Data integration is the compilation and cross-linking of multiple data sets from different sources, and is a key component of collaborative research. Collections of physical samples and data bases and maps are examples of data integration commonly undertaken by multiple investigators collaborating on a project (e.g., Fig. 3). Such examples include compilation of a single data type (e.g., seismic data compilations, fossil collections, aerial photo collections) and integration of multiple data types (e.g., maps with geographic and geologic features). Maps establish geographic distribution of data and objects. Time-series maps and plots establish historical changes useful for future predictions.
Examples of diverse hydrographic data collections compiled to make a detailed bathymetric map of South Georgia Island (From Graham et al. Reference Graham, Fretwell, Larter, Hodgson, Wilson, Tate and Morris2008): (A) GEBCO map; (B) newly-compiled map; (C) index map; (D) trackline, swath and sounding data used for compilation.
Antarctic data have been integrated since the first historical observations of the 18th Century (e.g., weather, bathymetry). Data integration continues today within SCAR's Standing Scientific Groups as key objectives of the multiple Scientific Research Programs, Action, Expert and Planning Groups and individual projects (e.g., Turner et al. Reference Turner, Bindschadler, Convey, di Prisco, Fahrbach, Gutt, Hodgson, Mayewski and Summerhayes2009). These groups compile data sets, create maps and analyse data for all geoscience data disciplines such as geospatial and geodetic, permafrost, bathymetry, magnetic anomaly, sub-glacial lakes, marine seismic and others (see SCAR-SSG 2012 for a complete list of SCAR research groups).
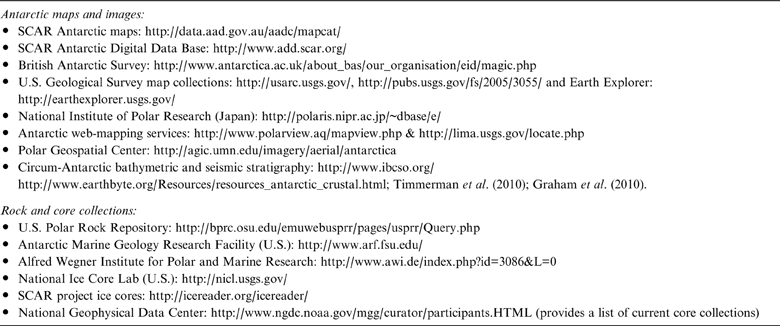
In addition to SCAR groups, numerous national agencies, projects and individual researchers have compiled Antarctic data and made maps that can be found via careful internet searches. A small sampling of such current Antarctic-data groups is given in Table 2.
Examples of Antarctic data groups creating and holding Antarctic maps and rock and core collections.
4.1. Challenges and opportunities
Many long-standing unresolved challenges exist in integrating data and compiling maps, and there are opportunities for the next generation of researchers to conquer these with creative use of future technologies. The challenges reflect the inherent difficulties in integrating data sets collected and/or processed by different organisations at different times and with different equipment systems and different data-formats:
• locating ‘old’ data sets, including analog data: Currently, computer searches, metadata lists and talking to colleagues are the best sources, as discussed above in section 3.
• Standardising data formats and reformatting: This commonly requires digital conversion by scanning of analog data and additional computer reformatting of prior digital data sets.
• verifying data quality: This requires computer processing and human oversight.
• acquiring copies of data: This is a major issue for many projects, especially those requiring copies of highly-valued data. New possible solutions are proposed below.
• merging data in real time: This is a common desire and requires new communication technologies such as web-mapping services (e.g., Table 2).
5. Data presentation – displays extraordinaire
Rapid technological changes in computer and multimedia equipment (e.g., text, images, video, music), especially increasing computational speed and memory capacity, have dramatically altered and advanced the ways that data are presented within the science community and to the general public. These changes have also resulted in at least two fundamental science–cultural shifts in data presentations, with regard to maps and research presentations.
5.1. Maps
Maps that were once compiled and contoured by hand, using limited data points at uneven and/or wide data spacings, have evolved into digitally-compiled, -gridded, -interpolated and – contoured images, commonly based on massive data sets with closely spaced points. With previous maps, observation points were plotted so that accuracy and completeness of the data sets and map could be evaluated, but today data points are commonly not shown and it is not possible to directly evaluate data coverage, status of data sets and accuracy of the image. Digital maps give the impression that there is closely-spaced point-coverage of uniformly processed data, but this is not always the case. Such new digital spatial-images can now be rapidly altered, displayed in multiple dimensions and made into time-series ‘movies’ to illustrate historical geospatial changes. Are our new geospatial images with their accompanying metadata actually more accurate representations of our prior maps or do they just seem so? The fundamental science–cultural shift is that our concept of ‘maps’ is evolving into one of ‘geospatial images’ and soon into sequences of images to be ‘geospatial animations’.
5.2. Research presentations
Information (both data and concepts) is increasingly presented using advances in multimedia technology. As noted by E.O. Wilson (Reference Wilson1975, Reference Wilson1998, Reference Wilson2010, pers.comm. 2010), when the complexity of science due to data technology advances and surpasses the ability of the brain to process such complexity, as is now happening, the brain's reaction is to fall back to a favored ‘default’ concept(s). This ‘default’ may have little to do with the science concepts being transmitted, rather being related to natural inherent cultural ideas and/or values. Multimedia presentations are gaining acceptance and value in all science-presentation venues because they provide cultural context to the science message and thereby enhance the listener's perception and desire to understand complex data/ideas being presented. The fundamental science–cultural shift is toward incorporating multimedia technology and cultural arts into all research presentations for greater understanding by the audience.
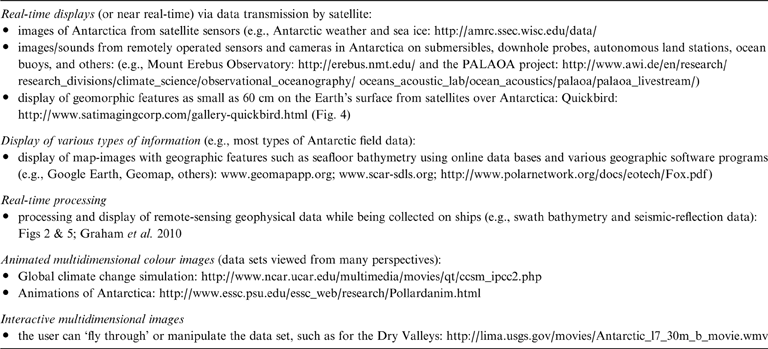
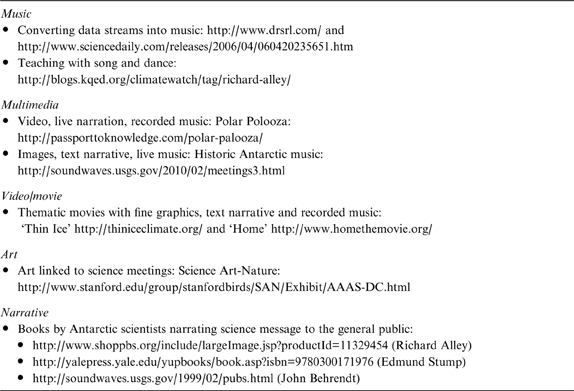
Table 3 gives some examples of state-of-the-art capabilities in the broad context of data presentations for ‘raw’ and processed data. These data-presentation techniques allow the visualising of larger and more complex data sets to facilitate data analyses than was previously possible. The common use of animated displays of data sets (e.g., video, film, models) is yet another way by which historical changes in the data sets can be observed and documented, such as in changes in ice flows and geologic models (Figs 4, 5).
Examples of state-of-the-art capabilities in data presentations.
Example of 0·60-m composite panchromatic and multispectral images from the QuickBird satellite across the coast of the western Ross Sea (from Sanchez & Kooyman Reference Sanchez and Kooyman2004). Land to lower left, ice (blue) and open water (black) to upper right.
Example of detailed mapping of the seafloor and subsurface of the Ross Sea. See Figure 3 for examples of the mapping systems: (top) map of the seafloor from swath bathymetry data; (bottom) multichannel seismic-reflection data showing the 3D configuration of subsurface horizons. Modified from Böhm et al. Reference Böhm, Oakoglu, Picotti and De Santis2009.
6. Data reporting – living the ‘dream’
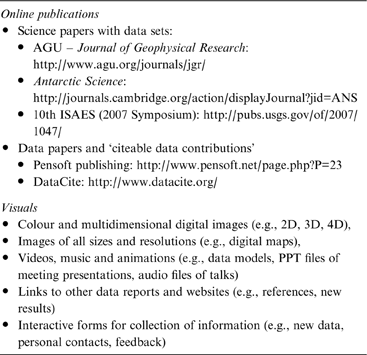
The digital world now gives researchers powerful tools for the reporting of all types of data, most rapidly via the internet to the global audience. Expectations on speed of publication have changed in time frame from years to months, if not in near-real-time. Publication of science papers with data sets, data papers and citeable data sets can readily be done online and can include many types of visuals at generally low cost (Table 4) And, papers to be presented at science symposia, can now be published online by the time of the meeting (e.g., Cooper et al. (Reference Cooper and Raymond2007) for 10th ISAES).
Examples of online publications and types of visuals that can be included web at relatively low cost.
What was once a dream of rapid/instant publication and community interactions is now a reality and an expectation (e.g. Suber Reference Suber2010)! Again, technology is changing faster than the brain is evolving (Wilson Reference Wilson1998), creating greater confusion about modern data/science concepts. Such confusion calls out to scientists to use more-intuitive modern techniques (e.g., cultural, narrative, multimedia, etc.) in presenting their data and research results, especially to the general public.
7. Data innovation and conceptual science – working ‘outside the box’
Many scientists are now bringing cultural arts (e.g., music, art, video, multimedia, narrative) back into science in creative analyses and presentations of data, to further use our varied human perceptions to understand and explain natural phenomena (Cooper Reference Cooper2010; Cooper & Stafford Reference Cooper and Stafford2012). Modern observational science, like a photograph, provides a ‘snapshot’ of data and model analysis that fits a particular data set and current science/data theory or theories. Conceptual science that embraces the cultural arts, like a painting, melds data and concepts to give historical perspective and understanding linked to human experience in science/data. Modern science with vast data is increasingly complex and poorly understood by the general science community and more so by the general public. Conceptual science can simplify and present and teach science/data topics to audiences in more-understandable ways (e.g. Kastens et al. Reference Kastens, Manduca, Cervato, Frodeman, Goodwin, Liben, Mogk, Spangler, Stillings and Titus2009). The boundary between modern and conceptual science is rapidly changing, due to the ways in which data are being processed and displayed (Olson Reference Olson2009).
One example is the field of ‘Phenomenology’ that expresses mathematically the results of observed phenomena without paying detailed attention to their fundamental significance. New scanning multispectral techniques of satellites (e.g., MODIS satellites (KOSC 2012)) provide many examples of the fuzzy boundary between phenomenology and theory. Another alternative is the ‘Narrative inquiry’ that is a discipline within the broader field of qualitative research, in which understanding of the natural world and science is via scientist narrative to the audience in explaining the meaning of things that have happened (e.g., Niepold et al. Reference Niepold, Herring and McConville2009). Narrative is also useful in combination with metadata and data in retaining a context in which the data were collected and used, for reconstructing evolution of theories and models (e.g., Karasti et al. Reference Karasti, Baker and Bowker2002). Table 5 gives some further examples.
Some examples of scientists using their creative arts skills in data and science presentations.
The most accurate science and greatest impact on audience is when researchers themselves create and are involved, as they narrate and perform/present their work live.
8. Data archival – science's legacy
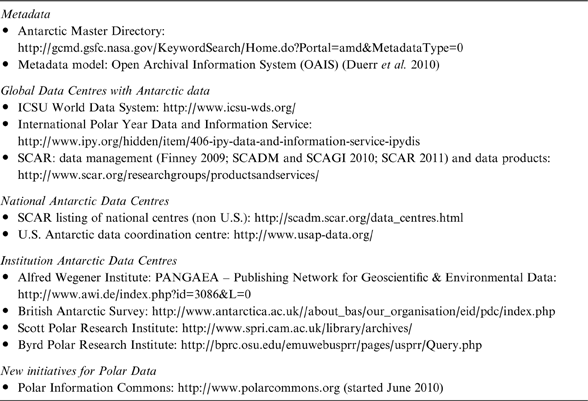
Data need to be preserved for use by future generations and, to this end, extensive efforts and billions of dollars have been invested to date in national and global data management systems and facilities for Antarctic data. Thousands of ‘agencies’ currently actively archive and store metadata and/or data sets at the global, national, institution and individual-researcher levels. And there are new initiatives for data preservation (e.g., PIC 2012). State-of-the-art archival facilities have large collections of metadata and/or data sets that are readily accessible and available via the internet (Table 6).
Some examples of state-of-the-art archival and retrieval facilities and groups for Antarctica.
Technology facilitates data preservation, but cannot yet solve the fundamental problem that no permanent (hundreds of years) storage media for digital data sets now exists (SNIA 2007; BRTF 2008). The current solution is the perpetual reformatting of data. This expensive and time-consuming process results in degraded and lost data. A further issue is that our current science–culture places higher priority on new data collection than on data preservation, which exacerbates the long-term problem of data preservation. Solutions lie in revisiting and understanding historic pre-digital archival processes (e.g., archival papers, etchings) and in developing future creative technologies (e.g., quantum fields, superconductivity, molecular processes). These topics are beyond the scope of Antarctic science, but greater attention to reformatting and use of prior Antarctic data are within our scope and would be beneficial.
9. Data care – celebrating successes and tackling issues
9.1. Successful collaborations – advancing progress in Antarctic science
The bumper sticker ‘Antarctica: the heart of it all’ (Fig. 6) distributed at the 6th Gondwana Symposium in 1985 expresses not only the geologic unity of Antarctica but also reflects the wholesome spirit of collaboration that characterises all of Antarctic science. Here we celebrate two examples: one for the global breadth of the science activities (International Polar Year) and the other for the long duration of successful operation (22 years) and direct link to the Antarctic Treaty (the Antarctic Seismic Data Library System for Cooperative Research).
Bumper sticker from the 6th Gondwana Symposium (1985) that symbolises the geologic unity of Antarctica and reflects the heart of wholesome collaboration that characterises Antarctic science.
9.1.1. International Polar Year (IPY)
The 4th International Polar Year (IPY 2007–2009) was multidisciplinary, international and collaborative (IPY 2011). The IPY science program (IPY 2007) was linked to its data policy (IPY 2008). The two components were organised, managed, documented and funded separately, with largely different researchers and staff. The philosophy of IPY upheld that of modern observational science, by separating observations (i.e., data) from analyses (i.e., data use) and thereby promoting the ‘two-class’ (?) arbitrary and artificial distinction of ‘data management’ and ‘basic research’. Yet, data are the heart of both ‘classes’.
IPY was highly successful collaborative science, yet, the major legacy of IPY will be the IPY data sets (LeDrew Reference LeDrew2008) that include ‘raw-observed’, processed, analysed, and reported data. This was also the case for IGY in 1956–58. Over the next five decades, science methods and models will change but the ‘raw-observed’ data will remain unchanged. What has higher value to long-term science – current models or ‘raw-observed data’?
IGY was the catalyst for the implementation of the Antarctic Treaty, SCAR, and elevating Antarctica to the World's only continent for peace and science. Since IGY, the Treaty has inspired researchers and managers to ‘learn’ techniques for peaceful collaborations in data sharing for the greatest benefit to Antarctic science and the global community. IPY is yet another extension of this ‘learning’ process in peacefully and effectively sharing and collaboratively using data.
9.1.2. Antarctic Seismic Data Library System of Cooperative Research (SDLS)
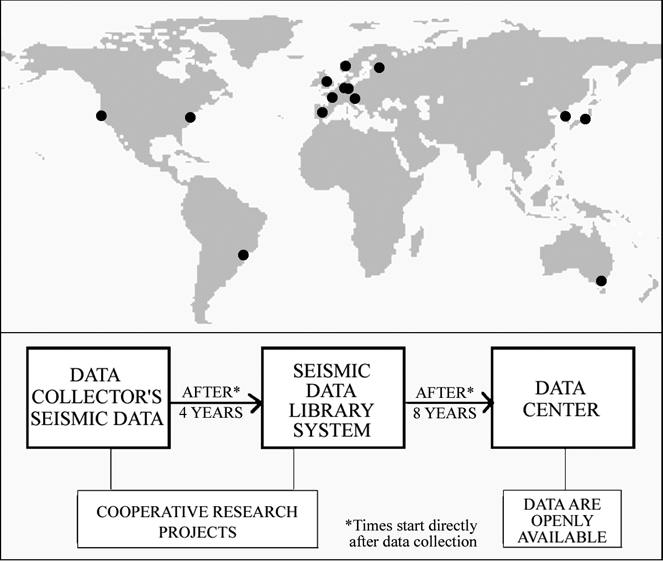
Within SCAR in 1991, geoscientists who collected multichannel seismic-reflection (MCS) data were inspired to establish a research-library system for sharing these data, to establish that MCS data were being used for cooperative geologic research and not for minerals exploration. The library system that the science community conceived and all agreed to (i.e., SDLS 2012), was adopted as ATCM Recommendation XVI-12 (1991), as part of the Antarctic Treaty system. The SDLS now has 14 branches in 12 countries (SDLS 2012), and is a key contributor of MCS and other seismic data for collaborative studies around Antarctica and in several science disciplines (Cooper et al. Reference Cooper, Barrett, Stagg, Storey, Stump and Wise2008, Reference Cooper, Barker, Barrett, Behrendt, Brancolini, Childs, Escutia, Jokat, Kristoffersen, Leitchenkov, Stagg, Tanahashi, Wardell, Webb, Berkman, Young, Walton and Lang2011).
The SDLS is a library for cooperative research, not a data centre or ‘data bank’. The ‘heart’ of the SDLS is the agreement on when and how data are shared (SCAR 1991). Unlike all other Antarctic data archives, the SDLS embodies a unique set of guidelines that are fair and respect the intellectual property rights of data collectors, while inspiring and encouraging data collectors to share their highly valued MCS data (Fig. 7).
Description of the Antarctic Seismic Data Library System for Cooperative Research (SDLS) for Antarctic seismic-reflection data: (top) Location of the 14 library branches in 12 countries; (bottom) Fundamental tenet of the SDLS showing how Antarctic seismic data are shared and used for cooperative research. Modified from Cooper et al. Reference Cooper, Barker, Barrett, Behrendt, Brancolini, Childs, Escutia, Jokat, Kristoffersen, Leitchenkov, Stagg, Tanahashi, Wardell, Webb, Berkman, Young, Walton and Lang2011.
Over the past 22 years, the SDLS has been developed and modified by the data collectors and users in the science community, as a ‘living document’, while preserving the basic data-sharing tenets. We believe the ‘living document’ aspect enjoins a human-to-data community connection that is not found in static data centers that operate under institutional rules outside of the control of the science community. Perhaps this special connection is a foundation of trust for building other data-sharing cooperative libraries for specialised and/or highly-valued data sets?
9.2. Tackling the issues – challenges to progress
9.2.1. Facing the “data deluge” -- can we change our science culture?
We currently face a “digital data deluge” (Bell et al. Reference Bell, Hey and Szaley2009) and a science-culture conundrum. We collect more data than we can process, analyse or share, and more data than we can efficiently store and retrieve, yet our science culture promotes collection of more data. Technology facilitates the data deluge, yet science–culture attitudes are the driving force. Why is this so? Data care activities are given low priority (and small funding) as compared with data collection activities. Can the conundrum be resolved? Yes, if desired.
The conundrum solution is conceptually easy (i.e. reset priorities) but practically is difficult. Yet, such a science–culture barrier was crossed in the 1600s as Newton ‘fathered’ the transition from prior philosophically-aligned science into the era of modern observational science (James Reference James1993). So too, data practices in future science could evolve to a new ordered system in which equal or greater priority was given to funding research studies that more effectively and efficiently share, combine and evaluate data we have (Baker & Barton 2010; Peterson Reference Peterson2010).
The current concept is ‘more new data creates better science than mining old data’. Possibly accurate, if the vast new data sets were all processed, combined and analysed. But, this is not the case and many new data go unprocessed and hence are left out of analyses. Data care is not that simple as recognised by the U.S. NSF (2003): “digital objects require constant and perpetual maintenance, and they depend on elaborate systems of hardware, software, data and information models, and standards that are upgraded or replaced every few years.”
How then should priorities be set? Should resources be directed to collecting extensive data sets that will only be partially analysed? Or should they go to reprocessing, sharing, compiling and analysing existing comprehensive data sets – and infilling with similar-resolution data? When our next generation of researchers debates and achieves answers to these state-of-the-art data-questions, Antarctic science will likely be done differently – with greater collaboration, more efficient data coordination, and more-thoroughly processed data sets to use for answering science questions.
9.2.2. Enhancing data sharing – three proposed options
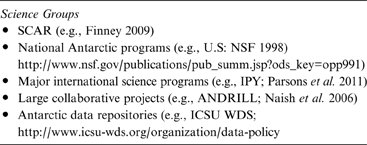
Antarctic research groups typically incorporate data access and data use guidelines in their data management plans (e.g., Table 7), in accord with Article 3 from the Antarctic Treaty. Yet in practice, access to project data can be restricted and slow, up to many years, even when release times are specified.
Examples of Antarctic science groups with data management plans
Interestingly, data of greatest immediate value to science (e.g., commercial high-resolution satellite data, aerogeophysical data, multi-channel seismic-reflection data) are often the slowest to be made openly accessible, for several reasons that also apply to other project data:
• inadequate time for processing the data;
• protecting data, under implied intellectual property rights, for use by project researchers and graduate students preparing reports and graduate degrees, respectively;
• low priority placed by the principal investigator on data management and data release;
• collecting sufficient data (in future field programs) to have adequate data for publication;
• insufficient funds to process and archive the data; and
• protecting commercial or national interests in the data for corporate or geopolitical reasons.
The first four reasons are under the control of the project researchers; the fifth is under the control of the funding agency; and the last is under the control of the national government. Are there ways that can be implemented to expedite data release, access and sharing?
Here, we propose three options for updating our Antarctic science culture to more quickly and fairly share data, to promote more dynamic and broader collaborative research. The options are based on needs for open data access and data sharing (e.g., Baker & Barton Reference Baker and Barton2009; Showstack Reference Showstack2009; Peterson Reference Peterson2010; Stone Reference Stone2010), and they would augment the efforts of the international community working on the new Polar Information Commons initiative (PIC 2012). They would also benefit both data collectors and data users, and could be initiated and implemented in full compliance with the tenets of the Antarctic Treaty.
Option 1 – Data Library: Follow the example of the data-access guidelines of the Antarctic Seismic Data Library System for Cooperative Research and implement digital research library systems with fair, clear and managed data access timelines with a ‘living document’ mechanism for the user-community to make changes:
• for the first ‘N’ years, the data would be the exclusive intellectual property of the data collector;
• for the next ‘M’ years, the data would be in a digital research library and could only be used for collaborative research projects with the data collector;
• after ‘N+M’ years, the data would go into the World Data System, or equivalent archive, and be openly accessible to anyone with the restriction that the user acknowledge the data collector;
• workshops would be held annually to seek user suggestions for operational changes;
• for the SDLS, ‘N’=‘M’=4 years, which are times agreed to in 1991 by all data-collectors. This option might be envisioned as similar to a networked publication and library system for scientific data, as suggested for linking multiple data centers (Dittert & Diepenbroek Reference Dittert and Diepenbroek2007).
Option 2 – Access timelines: Follow the example of the data release policy established for Antarctic data by the NSF Office of Polar Programs (NSF 1998). The new policy would give clear data access timelines:
• Antarctic data would be sent to designated data centers within “X” years from time of data collection. Data at the centres would be openly accessible;
• to assure compliance, funds for collection of further Antarctic data would not be given until the prior data are released.
For the US policy, the time frame ‘X’=2 years.
Option 3 – Open access: Follow the example of the “open access” movement in academia for sharing information for the common good (e.g. Suber Reference Suber2010). The concept initially for publications would be extended to other data sets and would establish protocols for data access:
• researchers would make data accessible ‘immediately’ via download on the world-wide web for use in collaborative research projects with the data collector;
• permanent storage of these data would be at research data libraries or data centres.
Enhanced data sharing is essential for promoting greater collaborative research and augmenting progress in Antarctic science.
10. Summary and conclusions – inspiring a new generation
Data are the ‘heart’ of modern observational science, yet data care activities (e.g., a subset of data management and including standard formatting, rapid sharing, preservation) have commonly been treated as the ‘tail’ that is wagged by researchers and put at the far end of all their science activities. The ‘tail wagging’ concept worked in the predominantly ‘analog-data world’ of relatively low data volumes. However, in our current digital-data society with huge-volume data sets that are rapidly exchanged, the prior concept impedes progress in data systems and linked science. It is time to ‘upgrade’ and put data on the ‘nose’ of science to guide us forward. We need new visions for our data/science (e.g., Costanza Reference Costanza2003).
In designing new concepts for today's observational science-culture, important data issues face the science community, and should be addressed. Three stand out and are:
• Data storage: There is yet no medium capable of permanent storage of digital data. Data storage for hundred's of years is not possible (SNIA 2007; BRTF 2008). The paradigm now is costly perpetual reformatting of data before it is lost forever.
• Data care priority: In modern science, data care activities are deemed low priority and receive low funding compared with collecting new data. Recognising that good science is only possible with good data, equal priority and funding should be directed to data care as given to new data collection.
• Data sharing: Data are the fundamental highly-valued resources of a researcher, who is required by the Antarctic Treaty to openly exchange (i.e., share) his/her data. More-effective ways (and policies) than current, such as at National Antarctic Data Centres and World Data System Data Centres, are needed to educate, inspire and ‘activate’ all researchers and their national governments about openly exchanging data in cooperative research studies. Collaboration breeds success in science, particularly in Antarctica.
The data storage issue awaits outside technological advances to resolve, but the data-care-priority and data-sharing issues are within control of our community, to achieve needed science–cultural changes. We recognise the extensive data management policies within ICSU and SCAR (e.g., SCAR 2011), and our visions augment these efforts. We propose three options (see section 9.2.2. above) for addressing these issues:
• Option 1 – Data Library;
• Option 2 – Access timelines;
• Option 3 – Open access.
All options would facilitate greater data sharing, and would incorporate prescribed data citation and data review procedures as now recommended by the American Geophysical Union (AGU 2009) and under consideration by the general science community (Parsons et al. Reference Parsons, Duerr and Minster2010). However, only Option 1 would further add the ‘living document’ component of continual updates that is embraced by the Antarctic Treaty to help ensure future viability and success.
Timely reporting of data has been a goal of all researchers. In practice, researchers have set high priority on publishing interpreted analyses/data, but have given low priority to reporting raw- and processed-digital field data, which may not get reported or reach archives for many years. In the case of analog data, they may never be published or go to archives, and are likely to be lost with time. This tendency reflects current cultural attitudes about modern science in general, as noted by Parsons et al. (Reference Parsons, Duerr and Minster2010): “Currently, someone who publishes really good data receives less credit than someone who publishes a minor paper in a journal. This culture of rewarding only papers and not data will not change until the scientific community collectively works to change academia's centuries-old approach to faculty assessment, promotion and award recognition.”
For Antarctica, can our concepts of modern science in the digital world be changed universally (i.e., in all countries) to make the use and care of data and its linked science more efficient and effective? Yes, if the science community perceives benefits and is inspired, then science-culture changes will be achieved.
The following actions are suggested based on perceptions, concepts and data-sharing options discussed above. These actions are intended to inspire and promote the updating of Antarctic science culture with new priorities. These would achieve a culture in which all Antarctic digital data collected are processed, analysed and archived in a ‘living document’ environment to facilitate stronger collaborative science with greater successes than today.
• All field and initially processed data collected by a project would, after a specified time interval, go into either an open-archive (e.g., WDS, PIC) or a data library for cooperative research (e.g., SDLS) before funding for other data collection projects are approved. A policy similar to this is currently in use by the U.S. National Science Foundation's Office of Polar Programs (NSF 1998).
• Proposals for projects would be given adequate funds to process and archive ALL data collected.
• Researchers would need to process and archive ALL data that they collect, as a condition of applying for research funds for new projects.
• Adequate funding would be ensured for the operation and maintenance of the archives and data libraries.
The above actions may seem severe and unworkable changes in today's science culture, but are feasible to achieve with time and adjustments in data care procedures. The benefits are great in resolving the current problem of increasing amounts of funds being spent to collect increasingly larger data sets that are not fully processed, fully analysed, fully reported or fully preserved. The suggested actions will require the attention of all national Antarctic science programs, and will in the long term refine, not detract from, science.
Other specific actions that would further enhance understanding of Antarctic science to achieve greater impact and value to the global science community and general public:
• place greater emphasis on real-time data processing and data compilations via satellite links, for more rapid reporting of new science discoveries;
• place greater emphasis on multidimensional data displays to put data into real-world and historic contexts;
• place greater emphasis on streamlining data archival and recovery and avoid duplication among multiple agencies and websites, and create a central user-friendly web portal; and
• incorporate cultural arts into science presentations for both scientific and general-public audiences, to add cultural context and relevance for greater impact and understanding.
The perceptions of data care expressed herein, especially those regarding sharing, preserving, reporting and funding of data, are hopefully a launching pad to inspire creative discussions between researchers and research managers – to perceive and achieve upgraded data- culture (science-culture) attitudes within the Antarctic community. This is but one vision of how ‘upgrading' data care in the digital world will facilitate and enhance collaborations, successes and progress in Antarctic science.
11. Acknowledgements
The paper reflects discussions with numerous Antarctic researchers and data managers over the 22-year history of the SDLS, during which my conversations with them have touched on all of the above topics. Researchers differ widely in views toward data management, but hold many tenets in common. I value their ideas and hope that views in this paper fairly represent a majority opinion. I thank Eric Beckmann for his assistance in compiling information on search engines, web-links and figures. I thank Florence Wong, Nigel Wardell, David Walton, Eric Beckmann, and an anonymous reviewer for helpful reviews of the manuscript. This research was supported in part by the USGS and the US National Science Foundation.
12. Appendix 1: Definitions and acronyms
The following terms and acronyms are used within the paper.
12.1. Definitions
- Data:
Information that a researcher collects, analyses, creates, uses and reports for their studies (e.g., field data, processed data).
- Collection:
a set of data or objects kept in one location (e.g., fossil/ rock/core collection, etc.)
- Map:
a visual or digital representation of a geographic region.
- State-of-the-art:
The most advanced technique or method used at the present time.
- Metadata:
Data about the structure, context and meaning of data sets.
- Data care:
Thoughtful collection, sharing, processing, analyses, and archival of digital data, as viewed toward the future of collaborative data use. ‘Data management’ is a common broader term that incorporates ‘data care’ and includes how data have been and are managed and administered.
12.2. Acronyms
ACE: Antarctic Climate Evolution Project; ANDRILL: Antarctic Drilling Project; ANTOSTRAT: Antarctic Offshore Stratigraphy Project; AWI: Alfred Wegener Institute for Polar and Marine Research; CASP: Cenozoic Antarctic Stratigraphy Project; GEBCO: General Bathymetric Chart of the Oceans; IGY: International Geophysical Year; IODP: International Ocean Drilling Program; IPY: International Polar Year; NASA: U.S. National Aeronautics and Space Administration; NSF: U.S. National Science Foundation; PIAS: Progress in Antarctic science: perceive, inspire, achieve, and succeed; PIC: Polar Information Commons; SCAR: Scientific Committee on Antarctic Research; SDLS: Antarctic Seismic Data Library System for Cooperative Research; WDS: World Data System (now incorporates former World Data Centres).