Introduction
Throughout human evolution, individuals have tended to group together in clusters in many types of environments. The spatial separation of clusters tends to act as a barrier to breeding, and matings are more likely to occur within, than between, clusters. Besides this geographical separation, the clusters are often stratified into socioeconomic groupings, so human populations can be differentiated both horizontally (geographical) and vertically (socially) (Harrison & Boyce, Reference Harrison, Boyce, Harrison and Boyce1972).
There are many studies that have examined the extent of geographical separation on variation in human biological characteristics: for example, the classic work on genetic polymorphisms by Mourant et al. (Reference Mourant, Kopec and Domaniewska-Sobczak1976). Mascie-Taylor & Lasker (Reference Mascie-Taylor and Lasker1987) modelled the regional migration in Britain for ABO and Rh blood groups and showed that the spatial clines would disappear in about ten generations. Differences between social groups in mean IQ scores (Burt, Reference Burt1961; Gibson, Reference Gibson1970; Waller, Reference Waller1971; Mascie-Taylor & Gibson, Reference Mascie-Taylor and Gibson1978; Nettle, Reference Nettle2003) and genetic markers (Cartwright et al., Reference Cartwright, Hargreaves and Sunderland1978) have also been reported, and there is some evidence that movement between social groups is selective for IQ and height (Krzyżanowska & Mascie-Taylor, Reference Krzyżanowska and Mascie-Taylor2011a).
However there have been very few studies that have examined the impact of geographical migration and social mobility simultaneously on biological characteristics (Mascie-Taylor, Reference Mascie-Taylor and Boyce1984). This study used data collected as part of an on-going British national cohort survey to examine the effects of both social mobility and regional geographical migration on variation in male height, weight and BMI.
Methods
The sample came from the National Child Development Study (NCDS), which commenced in 1958 and examined all children born in England, Wales and Scotland in the week 3–9th March. The children and their families were periodically re-studied in 1965, 1969 and 1974. Thereafter the index child was followed up into adulthood and there were re-studies when the child was 33 and 40 years of age. This study focuses on the 2090 father–son pairs for whom there were complete data on weight and height (see Krzyżanowska & Mascie-Taylor, Reference Krzyżanowska and Mascie-Taylor2011a, Reference Krzyżanowska and Mascie-Taylorb for additional information). All ethnic minority pairs (0.7%) were excluded from the analyses.
The extent of social class mobility and geographical migration was determined intra-generationally for the father and the son as well as inter-generationally between father and son. For fathers, intra-generational mobility was examined on three occasions: over the 7 years between 1958 and 1965; the 11 years between 1958 and 1969; and the 16 years between 1958 and 1974. For sons mobility was examined in the 9 years between 1991 and 2000. The inter-generational mobility of sons was examined twice: between 1965 and 1991 and 1958 and 2000.
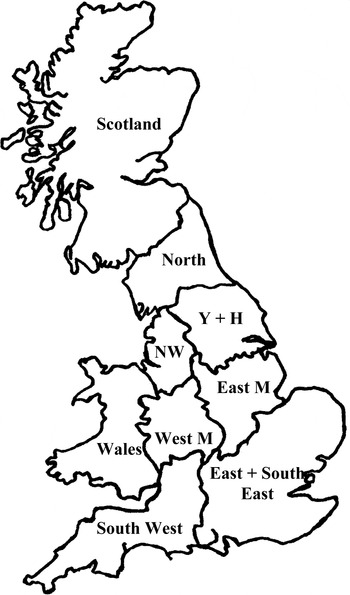
Social class was defined by the Registrar General's five-point occupational scale, where I refers to professional, II to intermediate (mainly managerial), III skilled worker, IV semi-skilled worker and V unskilled. Social mobility was categorized as none (no change in social class), upwardly mobile (moving up one or more social classes) or downwardly mobile (going down one or more social classes). The country was divided into nine standard regions (Fig. 1) and non-migrants were defined as those who resided in the same region while migrants changed their residence to another region. No attempt was made to differentiate the direction or extent (e.g. distance) of migration, so there were only two categories: non-migrants (sedentes) and migrants. In order to distinguish between social and geographical movement ‘mobility’ has been used only in the context of social movement and ‘migration’ for geographical movement.
Map of Britain showing the nine standard regions (Y+H=Yorkshire & Humberside; East M=East Midlands; West M=West Midlands; NW=North-West).

The standardized data on height, weight and BMI within each social class were used where the non-socially mobile and non-geographically migrants group were set as the reference group and assigned a value of zero. The analyses were performed by using SPSS (version 18.0.0).
Results
Inter-relationships between social mobility and geographical migration
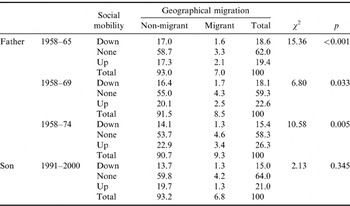
Table 1 presents the extent of intra-generational social mobility and geographical migration of fathers and sons. There was much more social mobility than geographical migration, but that might partly be a consequence of using the region as the unit, as information on within-region migration was not available. Between 1958 and 1965, 38.0% of fathers were socially mobile but only 7.0% were geographical migrants. Social mobility and geographical migration were not independent in the fathers' generation (χ 2(2)=15.36, p<0.001), and socially non-mobile fathers were more likely also to be geographically non-migrant while socially mobile fathers (whether upwardly or downwardly mobile) were more likely to be geographical migrants than expected (Table 1).
The relationships between intra-generational social mobility and regional migration (percentages)

A similar pattern was found in 1958–1969: 40.7% of fathers were socially mobile and 8.5% were geographical migrants. There were more socially mobile and geographical migrants than expected. Over the total period of father's intra-generational mobility (1958–1974) 41.7% were socially mobile and 9.3% were geographical migrants. The socially non-mobile also tended to be geographical non-migrants, but unlike the previous two time periods, it was only upwardly socially mobile fathers who were more likely to be geographical migrants (Table 1). Among sons no significant interaction was found (χ 2(2)=2.13, p=0.345) between social and geographical mobility (1991–2000) (Table 1).
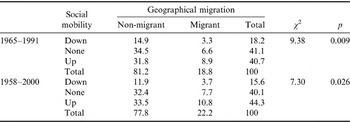
The inter-generational mobility between fathers and their sons revealed significant interactions between social and geographical mobility both for 1965–1991 and 1958–2000 (χ2(2)=9.38, p=0.009, and χ2(2)=7.30, p=0.026, respectively) (Table 2).
The relationships between inter-generational (father–son) social mobility and regional migration (percentages)

For 1965–1991, 58.9% of sons were socially mobile and 18.8% were geographical migrants, and a similar pattern was found for 1958–2000 (59.9% and 22.2%, respectively). There was an opposite relationship for downwardly mobile migrants. For 1965–1991 the socially non-mobile tended to be geographical non-migrants, upwardly socially mobile sons were more likely to be geographical migrants, while the downwardly social mobile were not more likely to be geographical migrants (Table 2). However, for 1958–2000 a different pattern emerged in that although the non-socially mobile also tended to be non-migrants, the socially mobile sons (whether upwardly or downwardly mobile) were more likely to be geographical migrants.
Impact of social mobility and geographical migration on variation in height, weight and BMI
In order to examine the inter-relationships of social mobility and geographical migration on the anthropometric variables a series of sequential multiple regression analyses were performed in which (a) the effect of social mobility was entered into the model initially followed by geographical migration and finally the interaction effect between social mobility and geographical migration, and (b) the effect of geographical migration was entered first, followed by social mobility and finally the interaction effect.
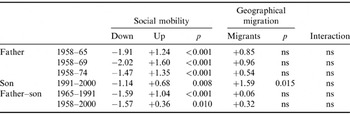
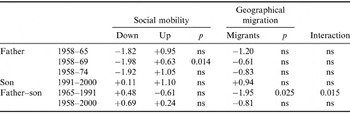
Tables 3–5 present the mean height, weight and BMI variation by social mobility and geographic migration (the non-socially mobile and non-migrants are the reference groups and have been set to a mean of zero) based on first entry into the model. A significant relationship was found between height, BMI and social mobility (Tables 3 and 5). The upwardly mobile were, on average, taller by between 1.2 and 1.6 cm and lighter by 0.21 kg m–2 in the fathers' generation, and taller by about 0.7 cm in the sons' generation, while the downwardly mobile fathers were shorter by between 1.5 and 2 cm and their sons by 1.1 cm (Tables 3 and 5). Inter-generational upwardly socially mobile sons were, on average, taller by 0.4 cm for 1958–2000 and 1 cm for 1965–1991, and downwardly mobile sons were shorter by 1.6 cm and had also a higher BMI (Tables 3 and 5).
Mean height differences by social mobility and geographic migration

Non-mobile reference group set to zero; ns, not significant.
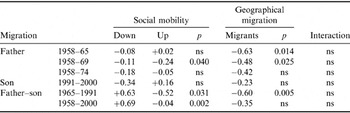
Mean weight differences by social mobility and geographic migration

Non-mobile reference group set to zero; ns, not significant.
Mean BMI differences by social mobility and geographic migration

Non-mobile reference group set to zero; ns, not significant.
There was a significant relationship between BMI and geographic migration. Migrating fathers had a lower BMI than sedentes, and this held for their sons migrating between 1965 and 1991 (Table 5).
In general, there was no significant relationship between weight and social mobility and geographic migration except for intra-generational mobility in 1958–1969 and inter-generational migration in 1965–1991 (Table 4). Upwardly mobile fathers were heavier than non-mobile ones by, on average, 0.6 kg, and the downwardly mobile were lighter by 2 kg. Migrating sons were also lighter than non-mobile ones by, on average, 2 kg (Table 4).
In the statistical analyses there was no significant interaction, which indicated that social mobility and geographical migration were acting in a simple additive way on height, weight and BMI.
Discussion
It is well known that spatial mobility is highly socially specific, with higher social groups being more mobile (Savage, Reference Savage1988; Fielding, Reference Fielding1992; Ringdal, Reference Ringdal1993). In keeping with these findings and a previous study on the NCDS (Mascie-Taylor, Reference Mascie-Taylor and Boyce1984), these results clearly show that social mobility and geographical migration are not independent, with socially non-mobile fathers and sons being more likely to stay in the same region, and fathers and sons who are socially mobile being more likely to move to another region. What is more, there was much more social mobility than geographical migration, but that might partly be because the geographical unit used was a standard region, and no information on intra-regional movement was available.
Height and BMI have been found to be significantly associated with social mobility and geographic migration when both kinds of mobility are considered separately (Krzyżanowska & Mascie-Taylor, Reference Krzyżanowska and Mascie-Taylor2011a, Reference Krzyżanowska and Mascie-Taylorb). People who were upwardly mobile were found to be taller than non-mobile ones, while the downwardly mobile were, on average, shorter and heavier (Krzyżanowska & Mascie-Taylor, Reference Krzyżanowska and Mascie-Taylor2011a). Geographical migrants were, on average, taller than non-migrants for both fathers and sons, but BMI was only significant in migrant fathers who had, on average, a lower BMI. No significant differences were found in weight between geographically or socially mobile groups (Krzyżanowska & Mascie-Taylor, Reference Krzyżanowska and Mascie-Taylor2011a, Reference Krzyżanowska and Mascie-Taylorb).
When the dual effect of social and geographical mobility on anthropometric traits was examined it appeared that height and BMI were significantly associated with social mobility and to some extent with geographical migration. The upwardly socially mobile were, on average, taller and had lower BMI values than the non-mobile, and geographical migrants had lower BMI values than non-migrants. Weight did not show any relationship with geographic and social mobility, except for fathers' mobility between 1958 and 1969 and sons' migration between 1965–1991, which is in agreement with previous studies (Krzyżanowska & Mascie-Taylor, Reference Krzyżanowska and Mascie-Taylor2011a, Reference Krzyżanowska and Mascie-Taylorb).
The effects of geographical and social mobility on height and weight were analysed in the British population by Mascie-Taylor (Reference Mascie-Taylor and Boyce1984). He found that there were no significant interactions between social mobility and geographical migration in relation to height and weight, and the present results are consistent with those findings as well as extending the notion of additivity to BMI.
To summarize, it is seen, particularly for height and BMI, that selective migration is more pronounced for social mobility than for geographical migration. Such selectivity contributes to the maintenance of social and geographical variation in height and BMI in the British population.