Introduction
Insect cuticle is integument composed of extracellular matrix secreted by the epidermal layer, which plays an important role in maintaining insect shape, preventing water evaporation and resisting external environmental infection (Balabanidou et al, Reference Balabanidou, Grigoraki and Vontas2018; Chen et al, Reference Chen, Tang, Zhou, Li, Chen, Zhang, Fu, Guo and Shi2023; Moussian, Reference Moussian2010). In mites, as in other arthropods, the cuticle consists of the envelope, epicuticle, and procuticle, with chitin and proteins primarily located in the procuticle (Falcón et al, Reference Falcón, Ferreira-Caliman, Franco Nunes, Tanaka, Nascimento and Gentile Bitondi2014; Menzel et al, Reference Menzel, Blaimer and Schmitt2017). Chitin, a common polysaccharide, is widely distributed in organisms and is an important component of insect cuticle (Gong et al, Reference Gong, Wang and Li2020; Kombrink et al, Reference Kombrink, Sánchez-Vallet and Thomma2011; Yu et al, Reference Yu, Liu, Li, Zhao, Ding, Zhang, Ma, Zhu, Li, Moussian and Zhang2016). In particular, chitin does not exist in plants and mammals (Kombrink et al, Reference Kombrink, Sánchez-Vallet and Thomma2011), so genes related to chitin metabolism are ideal molecular targets for pest control.
Chitin deacetylase (CDA) is widely distributed in protozoa, diatoms, bacteria, fungi, nematodes, and arthropods (Liang et al, Reference Liang, Song, Xing, Liu, Yu and Li2023). Based on the similarity of amino acid sequences, arthropods CDA is classified into five groups (Group I to V) (Zhang et al, Reference Zhang, Yan, Liu, Zhang, Gong and Hou2019). CDA in group I contains typical chitin-binding domain (CBD), catalytic domain (CAD), and low-density lipoprotein receptor ligand class a domain (LDLa). The domain composition of group II is the same as that of group I CDA, but the overall sequence similarity is less than 38% (Dixit et al, Reference Dixit, Arakane, Specht, Richard, Kramer, Beeman and Muthukrishnan2008). Groups III and IV contain both CBD and CAD, while Group V contains only a CAD (Jakubowska et al, Reference Jakubowska, Caccia, Gordon, Ferré and Herrero2010).
The function of group I CDA has been reported in many insects, such as Stegobium paniceum, Leptinotarsa decemlineata, Lasioderma serricorne, and so on (Quan et al, Reference Quan, Ladd, Duan, Wen, Doucet, Cusson and Krell2013; Wu et al, Reference Wu, Chen, Wang, Fu, Guo and Li2018; Yang et al, Reference Yang, Xu, Yan, Chen, Cao, Meng and Li2018, Reference Yang, Xu, Yan, Li and Jin2020). Studies have indicated that Group I CDA is involved in insect processes such as molting, pupation, and other growth and developmental stages, and is essential for maintaining the normal morphology of insects (Song et al, Reference Song, Chen, An, Ding and Bu2021; Wang et al, Reference Wang, Cheng, Lyu, Li, Chen and Lin2019; Wu et al, Reference Wu, Chen, Wang, Fu, Guo and Li2018). Knockdown of LsCDA1 in Lasioderma serricorne and TcCDA2 in Tribolium castaneum has been affect growth and development, and also result in wing deformities (Arakane et al, Reference Arakane, Dixit, Begum, Park, Specht, Merzendorfer, Kramer, Muthukrishnan and Beeman2009; Noh et al, Reference Noh, Muthukrishnan, Kramer and Arakane2018; Yang et al, Reference Yang, Xu, Yan, Li and Jin2020). In addition, silencing the TcCDA1, in Tribolium castaneum not only affects the structure of the cuticular tissue but also impacts the structure of the underlying tendon cells (Mun et al, Reference Mun, Noh, Erika, Karl, Kramerc and Yasuyuki2022). In summary, Group I CDA plays a pivotal role in insect molting and organ formation, and is regarded as an essential lethal gene in insect development.
Panonychus citri is a globally distributed citrus pest, with its damage not limited to citrus but extending to over 112 plant species (Migeon et al, Reference Migeon, Nouguier and Dorkeld2010; Yuan et al, Reference Yuan, Wei, Zhang, Gao, Liu, Wang and Wang2010).Currently, the control of P. citri primarily relied on chemically synthesised insecticides. However, the prolonged and extensive use of these insecticides resulted in the development of high resistance to multiple agents, significantly reducing control efficacy (Niu et al, Reference Niu, Liu, Dou and Wang2011; Van Leeuwen et al, Reference Van Leeuwen, Demaeght, Osborne, Dermauw, Gohlke, Nauen, Grbić, Tirry, Merzendorfer and Clark2012). Therefore, the search for new alternative strategies has become urgent. The role of CDA in P.citri has not yet been reported. CDA, as a key enzyme in chitin metabolism, has been confirmed to play an essential regulatory role in molting and development in various arthropods (Liu et al, Reference Liu, Li, Yang, Yang, Yang, Jiang, Dou, Smagghe and Wang2018; Xi et al, Reference Xi, Pan, Ye, Yu and Zhang2014; Yu et al, Reference Yu, Liu, Zhao, Zhang, Li, Zuber, Ma, Zhu, Moussian and Zhang2018). However, functional studies on CDA in P. citri have not yet been reported.
In this study, PcCDA1 and PcCDA2 were identified as Group I CDA proteins, and their mRNA expression profiles were obtained at different developmental stages. RNAi technology demonstrated that silencing the CDA in P. citri led to irreversible deformities and even death. This paper aims to explore the role of CDA in P. citri and provide scientific evidence for the development of molecular-targeted green control strategies.
Materials and methods
Materials
A stable population of P. citri has been maintained in the laboratory. The mites were cultured on tender citrus leaves under controlled conditions in an incubator (Percival Scientific, model: ARC-36VL-DR, Haidian District, Beijing) set at 25 ± 1°C, 70 ± 5% relative humidity (RH), and a 16:8 h light-dark photoperiod.
RNA isolation and cDNA preparation
RNA was isolated from 100 adult females using Trizol reagent (Sangon Biotechnology, Shanghai, China). Only adult females were used due to their availability and comprehensive genetic content. cDNA was generated through two-step reverse transcription with the PrimeScript™ II First Strand cDNA Synthesis Kit (Takara Bio, Dalian, China). A total of 10 μl of 2 × PCR master mix, 1 μl each of forward and reverse primers, and 1 μl of template were combined, and nuclease-free water was added to a final volume of 20 μl. To construct the 3′ and 5′ RACE libraries, the SMARTer™ RACE 5′/3′ Kit (Takara Bio, Dalian, China) was employed. The synthesised cDNA was stored at −20°C for subsequent use.
Cloning and identification of PcCDA
The NCBI database (http://www.ncbi.nlm.nih.gov/gorf/gorf.html) was used to obtain the partial sequences of PcCDA1 and PcCDA2. Specific primers were designed with the help of Oligo 7.0 software (Table S1), and these primers were applied in PCR to amplify the full-length PcCDA.
The ORFs were predicted using ORFfinder (ORFfinder Home – NCBI [nih.gov]), and sequence similarity was analysed through the NCBI database (http://www.ncbi.nlm.nih.gov/). Phylogenetic analysis was performed in MEGA 7.0 with the maximum likelihood method based on the Jukes–Cantor (JC) model, and bootstrap values were calculated from 1000 replicates. Sequence structural domains were identified using the SMART online tool (SMART: Main page [embl.de]), while amino acid sequence alignment across insects was completed with DNAMAN 6.0. GenBank IDs used for phylogenetic tree construction and sequence alignment are provided in the Supplementary materials.
Synthesis and delivery of dsRNA
Using Oligo 7.0 software, primers containing the T7 promoter sequences were designed (Table S1). The dsPcCDA1 and dsPcCDA2 fragments were directed at the conserved structural domains, while the RNA sequence of Aequorea victoria (dsGFP) served as a control. dsRNA was synthesised using the T7 High Yield Transcription Kit (Vazyme Biotech Co., Ltd., Nanjing, China) and stored at −80°C for later use.
The feeding method (Song et al, Reference Song, Chen, An, Ding and Bu2021) was used to deliver dsRNA into P. citri. Nymphs or adult females (n = 100, three biological replicates) were transferred onto citrus leaves containing 40 μL of dsPcCDA1, dsPcCDA2, or dsGFP solution at a concentration of 1500 ng/μL.
Biological observation
The malformation and mortality rates of nymphs (n = 100, 3 biological replicates for each group) were recorded at 12, 24, 36, and 48 h following feeding with 40 μL of dsPcCDA1, dsPcCDA2, or dsGFP at a concentration of 1500 ng/μL. Nymphs treated with RNAi for 24 and 48 h were selected for phenotype observation. Images were captured using a stereomicroscope (Leica Microsystems Ltd., Wetzlar, Germany).
RT-qPCR
This study aimed to investigate the expression of PcCDA at different developmental stages, eggs at 3, 4, and 5 days old (n = 300, E3, E4, E5), larvae at 1 and 2 days old (n = 150, L1, L2), protonymphs at 1 and 2 days old (n = 150, P1, P2), deutonymphs at 1 and 2 days old (n = 150, D1, D2), and adults at 1, 2, and 3 days old (n = 100, A1, A2, A3) were collected. Each collection included three biological replicates. The relative expression levels of PcCDA1 and PcCDA2 were measured at these stages.
This study aimed to evaluate the silencing effect of dsRNA, adult female mites (n = 50) were collected at 24, 48, 72, and 96 h after feeding with 40 μL of 1500 ng/μL dsPcCDA1, dsPcCDA2, or dsGFP. Each group included three biological replicates. The PcCDA1 and PcCDA2 expression profiles were assessed both before and after RNAi treatment.
This study aimed to investigate the role of PcCDA in lipid metabolism and chitin metabolism. Deutonymphs were collected 24 h after feeding with 40 μL of 1500 ng/μL dsPcCDA1, dsPcCDA2, or dsGFP. The relative mRNA expression levels of chitin synthetase (CHS1, CHS2) and Chitinase (CHT1, CHT2, CHT4).
Gene mRNA levels were determined using RT-qPCR. The relative expression of the target genes was normalised to the reference genes GAPDH and ELF1a, and calculated using the 2−ΔΔCT method. The primers utilised for the analysis are listed in Table S1 as previously described.
Haematoxylin and eosin staining
Deutonymph samples (n = 20, 3 biological replicates) collected 24 h after feeding of 1500 ng/μL dsPcCDA1, dsPcCDA2, or dsGFP were fixed in 4% glutaraldehyde. Frozen and paraffin sections were prepared and stained with haematoxylin and eosin (H&E), as previously described (Jiang et al, Reference Jiang, Mu, Jin, Anjum and Li2021). The slides were observed under a microscope, and images were captured using a Nikon digital camera.
Data analysis
One-way ANOVA and Student’s t-test were used to analyse all data, with results expressed as mean ± SD. Significant differences are indicated in the figures by either different lowercase letters or asterisks. Statistical thresholds were set as follows: P < 0.05 indicates significance, * P < 0.05, ** P < 0.01, *** P < 0.001, and ‘ns’ represents non-significant results (P > 0.05).
Results
Molecular cloning and phylogenetic investigation of PcCDA
The full-length cDNA of PcCDA1 and PcCDA2 encoded open-reading frames (ORFs) consisting of 532 and 533 amino acid residues, respectively. Both genes contained conserved domains characteristic of the group I CDA subfamily: a ChtBD2 domain, an LDLa domain, and a CAD domain (Figure S1).
Sequence alignment revealed significant differences between PcCDA1 and PcCDA2, with an amino acid similarity of only 75.89%. When aligned with other insect CDA sequences, PcCDA1 and PcCDA2 shared five characteristic motifs typical of CDAs, highlighting their conserved features (Fig. 1).
The amino acid sequences of insect CDAs were aligned using the DNAMAN 6 software. Conserved residues are highlighted in dark blue, indicating 100% sequence identity. Light blue represents lower conservation levels, with sequence identity ranging from 75% to 99%, while grey indicates sequence identity between 50% and 74%. Key conserved motifs are enclosed in red boxes, emphasising their functional importance in enzymatic activity.

Phylogenetic analysis showed that PcCDA1 and PcCDA2 clustered within Group I, with the closest relationship to TuCDA1 and TuCDA2 (Fig. 2), supported by a bootstrap value of 100, indicating a highly reliable evolutionary relationship. This analysis revealed conserved regions critical for CDA activity, highlighting the structural and functional similarities between PcCDA1 and PcCDA2.
A phylogenetic tree was generated using the MEGA 7.0 software. Bootstrap confidence levels, calculated from 1000 replicates, are displayed as numbers on the branches of the circular tree. Red triangles denote the chitin deacetylases identified in P. citri. The geneID of these sequences is given in Table S2.

Expression of PcCDA at different development
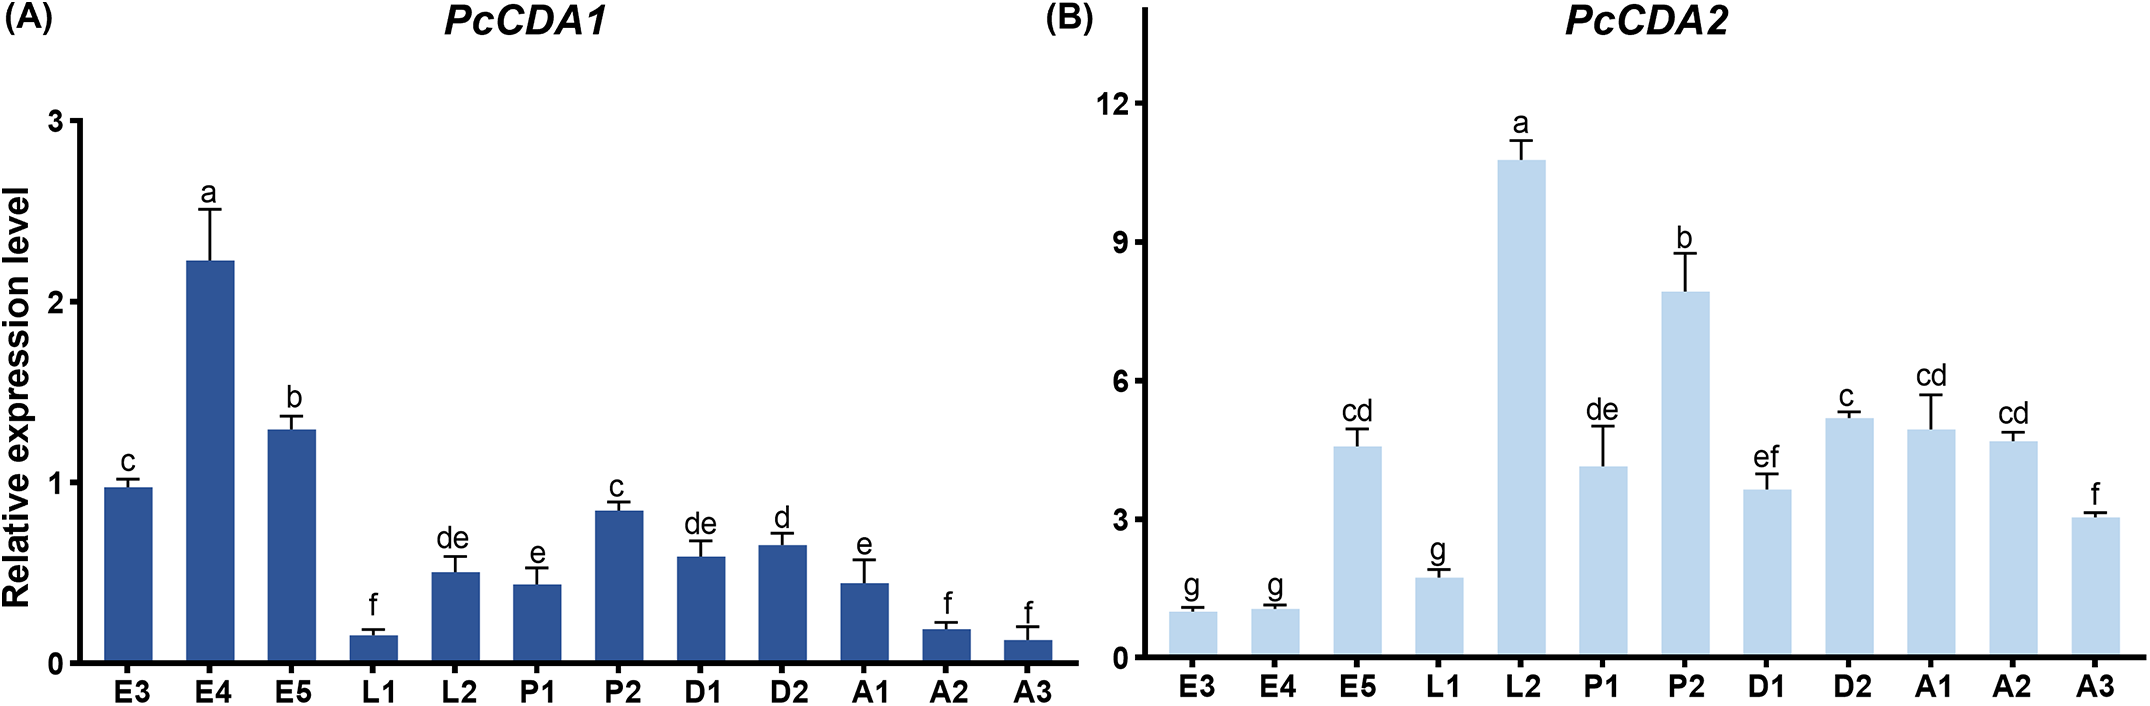
The mRNA expression levels of PcCDA1 (Fig. 3A) were highest during the egg stages (E4 and E5), gradually decreased during the larval stages (L1 and L2), and then increased upon entering the nymphal stages, where the expression remained relatively stable. However, PcCDA1 expression dropped to its lowest level during the adult stages. In contrast, PcCDA2 (Fig. 3B) exhibited lower expression during the egg stages, peaked at the late larval stage (L2), and maintained relatively high expression levels through the nymphal stages until the adult mid-stage. To sum up, the expression of PcCDA1 and PcCDA2 showed distinct regulatory patterns across developmental stages in P. citri, and the two genes may play stage-specific roles during the development of P. citri.
Expression levels of PcCDA1 and PcCDA2. (A) relative expression levels of PcCDA1(a) and PcCDA2(b) at various developmental stages of P. citri, including eggs (E3, E4, E5), larvae (L1, L2), protonymphs (P1, P2), deutonymphs (D1, D2), and adult mites (A1, A2, A3). expression levels are presented as means ± SE, with different letters above the bars indicating statistically significant differences (P < 0.05).

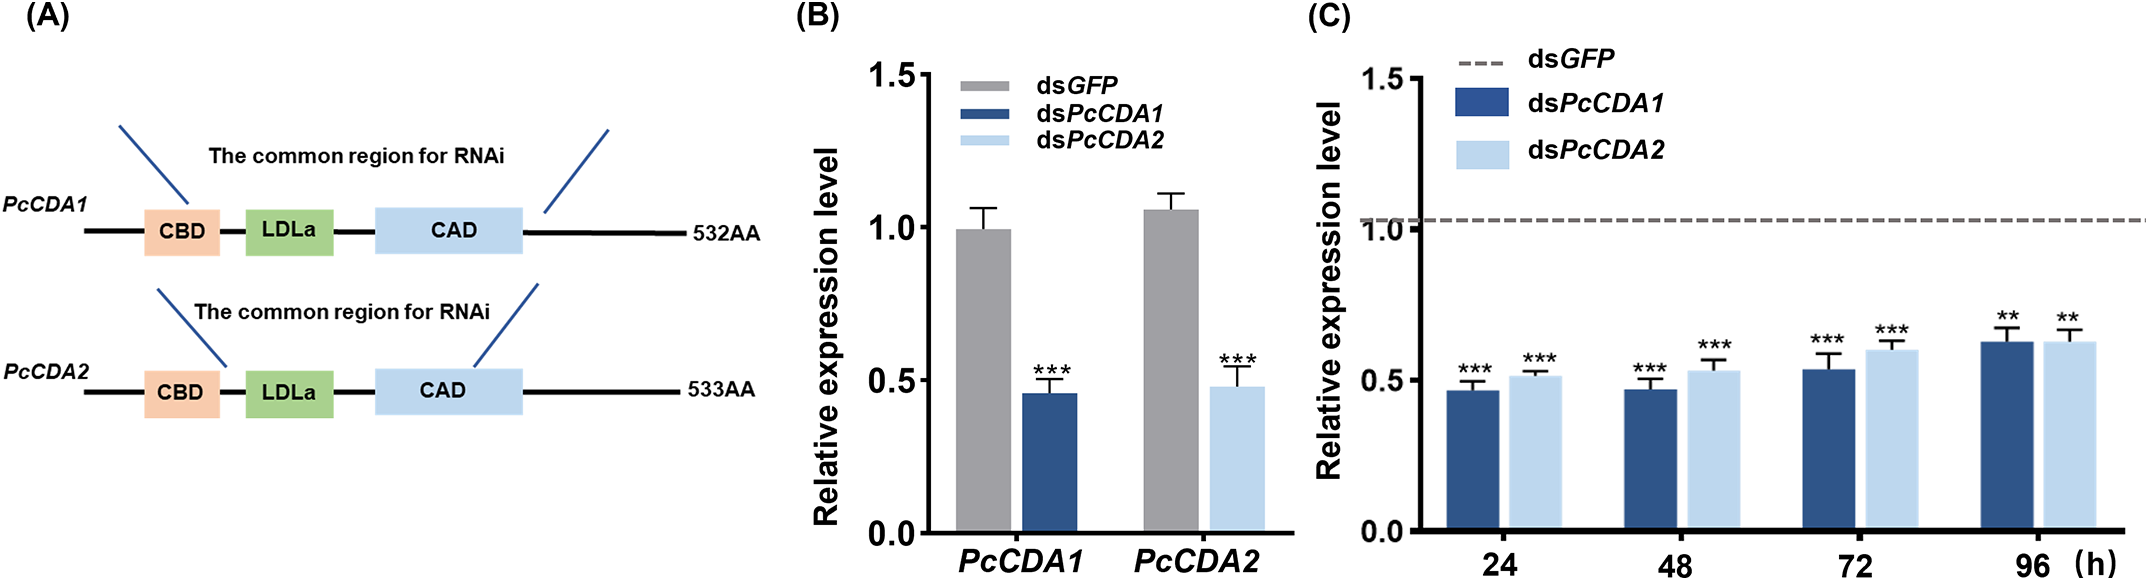
The dsRNA fragments were designed to target the conserved domain of group I CDA (Fig. 4A), ensuring effective inhibition of both PcCDA1 and PcCDA2. After feeding deutonymphs (D2) with 1500 ng/μL dsPcCDA1 or dsPcCDA2 for 24 h, the expression levels of PcCDA1 and PcCDA2 were reduced by 55.39% and 51.61%, respectively, demonstrating comparable silencing efficiency (Fig. 4B). Additionally, feeding with 1500 ng/μL dsPcCDA1 or dsPcCDA2 maintained significant inhibition of gene expression for up to 96 h post-treatment (Fig. 4C).
(A) structural diagrams of PcCDA1 and PcCDA2 proteins, highlighting dsRNA-targeted regions. Both contain a CBD, ldla, and CAD domain. (B) relative expression levels of PcCDA1 and PcCDA2 at 24 h post 1500 ng/µl dsRNA treatment compared to dsGFP control. (C) temporal expression levels of PcCDA1 and PcCDA2 at 24, 48, 72, and 96 h post 1500 ng/µl dsrna treatment. (*P < 0.05, **P < 0.01, ***P < 0.001).

RNAi phenotypes and impacts
PcCDA1 and PcCDA2 played a crucial role in the growth of P. citri. Compared to the control group, the cumulative molting rate significantly decreased after 48 h of dsRNA feeding (Fig. 5A), particularly in the dsPcCDA2 treatment group, where the molting rate dropped to 20.85%. Over the 48-h period, both the cumulative mortality rate and deformity rate significantly increased. In the dsPcCDA1 treatment group, the cumulative deformity rate and mortality rate were 23.58% and 16.94%, respectively, 24 h after feeding. In the dsPcCDA2 treatment group, the cumulative deformity rate and mortality rate were 24.32% and 20.71%, respectively. The deformity rate began to increase rapidly after 24 h of dsRNA feeding (Fig. 5B, C). After 48 h, the deformity rates for the dsPcCDA1 and dsPcCDA2 treatments reached 78.81% and 85.44%, and the mortality rates were 49.02% and 61.89%, respectively (Fig. 5B, C).
Morphologically, individuals treated with dsPcCDA1 or dsPcCDA2 exhibited failed molting and deformities, characterised by two noticeable indentations on the dorsal surface (Fig. 5E, F). In the deceased individuals, the indentations were more pronounced, with the entire dorsal surface showing inward wrinkling (Fig. 5G, H). These results indicated that PcCDA1 and PcCDA2 played a crucial role in maintaining the boby shape normality and facilitating successful molting in P. citri.
Effects of dsRNA treatment on cumulative molting rate, malformation rate, and mortality rate in P. citri. (A) The cumulative molting rates of deutonymphs treated with dsGFP, dsPcCDA1, and dsPcCDA2 within 48 h. (B, C) The cumulative malformation rates and mortality rates of different treatment groups at 12, 24, 36, and 48-h post-treatment. (*P < 0.05, **P < 0.01, ***P < 0.001, ns = not significant). (D) normal deutonymph, (D1) from dsgfp treatment group at 24 h; malformed deutonymphs (E, F) from dsPcCDA1 and dsPcCDA2 treatment groups at 24 h, respectively; dead deutonymphs (E1, F1) from dsPcCDA1 and dsPcCDA2 treatment groups at 24 h, respectively. Scale bar: 200 µm.

H&E staining
H&E staining and microscopic observation results showed that, 24 h after treatment, the epidermal structure in the dsGFP control group was regular, with a uniform epidermal layer thickness, averaging approximately 3.606 μm (Fig. 6A, A1, A2). After treatment with dsPcCDA1, the epidermal layer thickness slightly increased, with an average thickness of 5.476 μm, and the measurements fluctuated between 4.2 and 6.78 μm (Fig. 6B, B1, B2). In the dsPcCDA2 treatment group, the epidermal layer thickness further increased, with an average thickness of 9.312 μm, and the measurements ranged from 6.12 to 10.56 μm (Fig. 6C, C1, C2). These results indicated that PcCDA1 and PcCDA2 might play an important role in controlling the morphology and development of the epidermal layer, potentially regulating the formation of the new cuticle and the shedding of the old cuticle during molting, leading to the molting failure and deformities in P. citri.
Hematoxylin and eosin staining of deutonymphs treated with dsRNA. (A, A1, A2) control group treated with dsGFP, showing normal cuticular structure. (B, B1, B2) dsPcCDA1-treated group. (C, C1, C2) dsPcCDA2-treated group. A1–C1 show higher magnification of regions highlighted by blue dashed boxes in A–C. A2–C2 are light microscopy images showing cuticular thickness measurements (red lines). CUT: cuticle; FB: fat bodies; MUS: muscles. Scale bars: A–C = 100 μm; A2-C2 = 50 μm.

Expression of chitin synthesis and decomposition genes
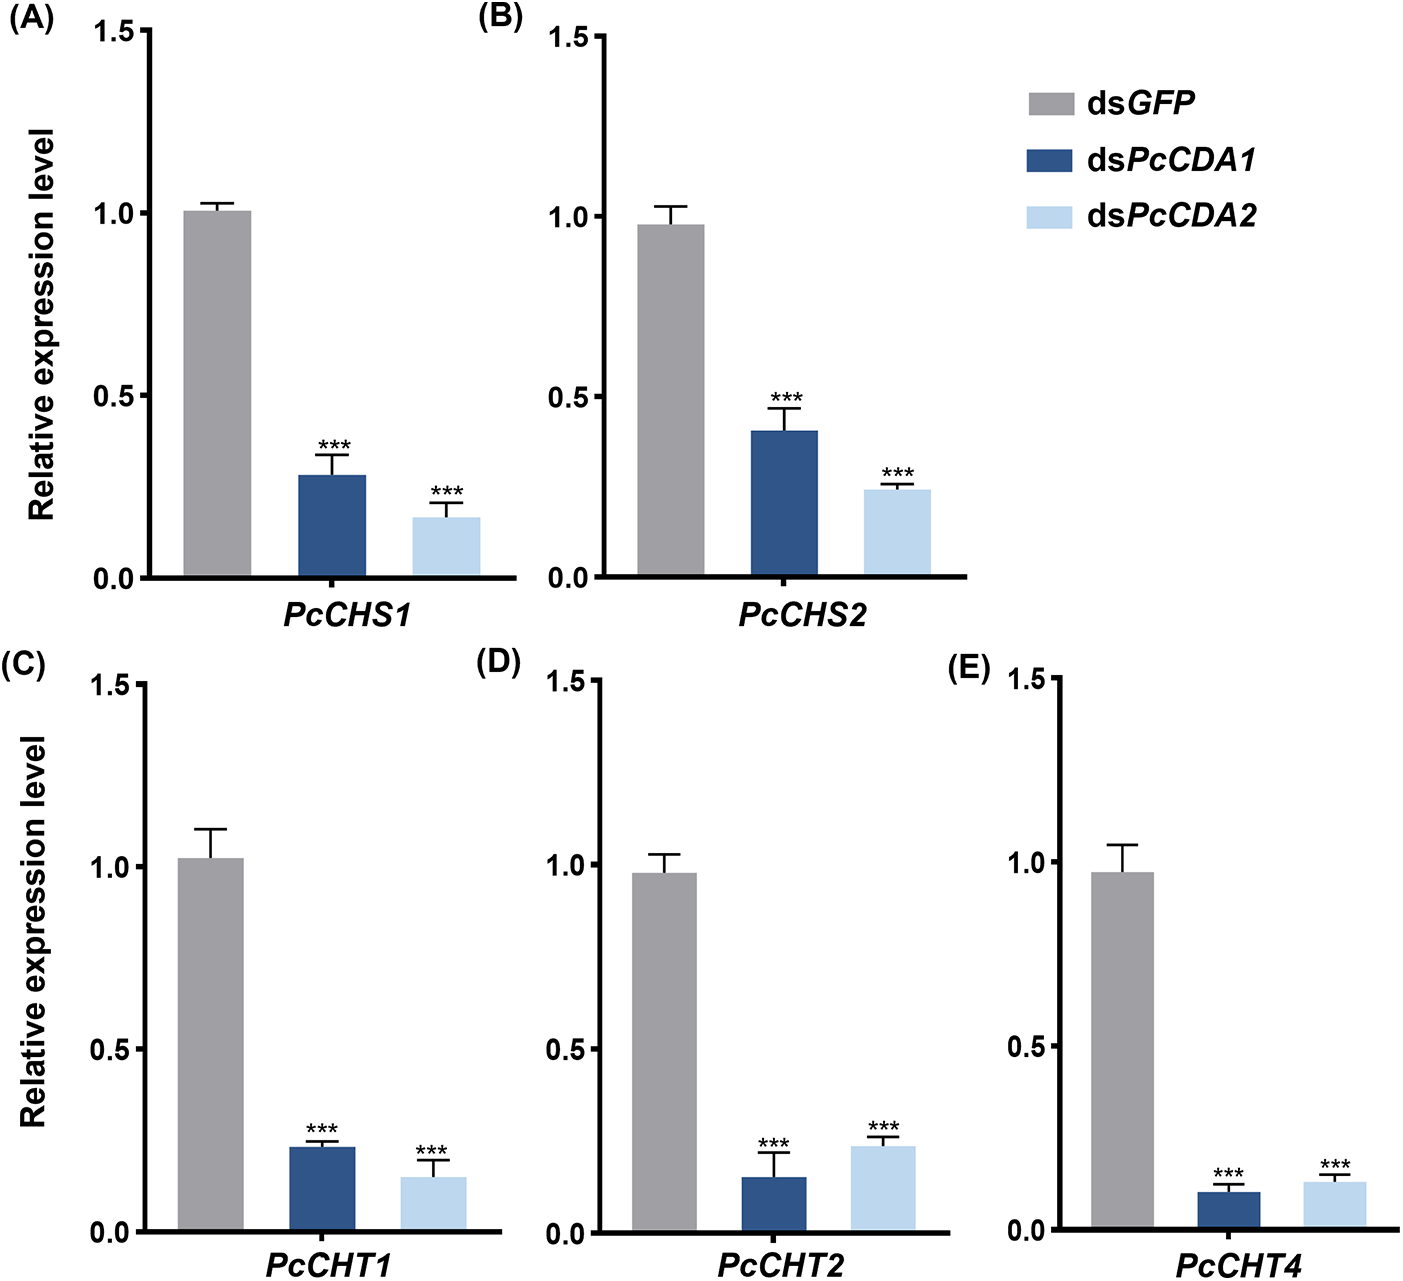
To analyse the effects of interfering with PcCDA1 and PcCDA2 on the expression of chitin synthesis and degradation-related genes, the relative expression levels of chitin synthesis and degradation genes were measured 24 h after RNAi treatment. The results showed that, compared to the dsGFP control group, silencing of both PcCDA1 and PcCDA2 significantly reduced the expression levels of PcCHS1 and PcCHS2 (Fig. 7A, B). Similarly, the expression levels of chitin degradation-related genes PcCHT1, PcCHT2, and PcCHT4 were also significantly downregulated (Fig. 7C, D, and E).
The relative expression levels of chitin synthesis and degradation genes were measured in deutonymph P. citri at 24 h post-RNAi treatment with dsPcCDA1 and dsPcCDA2, including (A) PcCHS1, (B) PcCHS2, (C) PcCHT1, (D) PcCHT2, and (E) PcCHT4. DsGFP was utilised as the control group. Data were presented as mean ± standard error of the mean (SEM). (***P < 0.001).

Discusion
In this study, PcCDA1 and PcCDA2 were cloned and identified for the first time. They were not only the key to the smooth molting of P. citri, but also play a role in maintaining normal body shape.
PcCDA1 and PcCDA2 belonged to group I CDA, and they had conserved structures of CBD, CAD, and LDLa, which were closely related to chitin metabolism and exoskeleton formation, and were ubiquitous in insects (Mun et al, Reference Mun, Noh, Erika, Karl, Kramerc and Yasuyuki2022; Noh et al, Reference Noh, Muthukrishnan, Kramer and Arakane2018). Compared with the egg stage, the relative expression of PcCDA1 decreased during the growth process, while PcCDA2 remained relatively stable and had high expression from the larvae. Similarly, in Leptinotarsa decemlineata, CDA2 played a crucial role during the growth period (Wu et al, Reference Wu, Chen, Wang, Fu, Guo and Li2018). PcCDA showed distinct stage-specific expression patterns, reflecting a division of labor that fulfilled the physiological requirements of different developmental stages, such as cuticle formation during embryogenesis and chitin metabolism during larval growth and molting (Yu et al, Reference Yu, Liu, Zhao, Zhang, Li, Zuber, Ma, Zhu, Moussian and Zhang2018; Zhao et al, Reference Zhao, Liu, Wu, Fu, Li, Lu and Guo2021).
The process from egg to larvae included the rupture of chorion and the formation of new cuticle of larvae, while in the growth period, the molting process also included the formation of new cuticle and the shedding of old cuticle, which involved the degradation, synthesis, and recombination of chitin (Chen et al, Reference Chen, Tang, Zhou, Li, Chen, Zhang, Fu, Guo and Shi2023; Das et al, Reference Das, Kumar, Shah and Sharma2022). The expression of PcCDA1 and PcCDA2 in nymphs was successfully knocked down by RNAi technology. Panonychus citri showed a low molting rate, and most individuals showed back depression, serious deformities, and even death. Silencing the CDA gene in Tetranychus urticae also observed the phenotype of back depression and death (Song et al, Reference Song, Chen, An, Ding and Bu2021). In addition, the cuticle thickness of PcCDA1 and PcCDA2 after being silenced increased by 1–6 μm compared with the control group. At the same time, the expression levels of chitin synthesis genes (PcCHS1 and PcCHS2) and degradation genes (PcCHT1, PcCHT2, and PcCHT4) decreased significantly. Previous studies had shown that the deacetylation modification of chitin by CDA was helpful to the degradation of chitin by CHT (Lee et al, Reference Lee, Silva, Lee, Hartl and Elias2008; Xi et al, Reference Xi, Pan, Ye, Yu and Zhang2014). When CDA expression was inhibited, the production of deacetylated chitin was reduced, and the expression of CHS and CHT genes was reduced through substrate-dependent feedback regulation (Liu et al, Reference Liu, Li, Yang, Yang, Yang, Jiang, Dou, Smagghe and Wang2018, Reference Liu, Wang, Zhong, Zhou, Jiang, Cheng, Dan, Hu, Li, Tang and Wu2022). At the same time, the old cuticle could not fall off normally, which affected the molting process and caused abnormal thickening of the cuticle structure. Similarly, it has been confirmed in Leptinotarsa decemlineata (Wu et al, Reference Wu, Chen, Wang, Fu, Guo and Li2018), Diaphorina citri (Zhang et al, Reference Zhang, Xia, Wang, Liu, Li, Yi, Lu and Yu2023), and Holotrichia parallela (Zhao et al, Reference Zhao, Liu, Wu, Fu, Li, Lu and Guo2021) that silencing CDA leads to abnormal molting, disrupting chitin metabolism and compromising structural integrity.
The accurate assembly of the insect cuticle could not be separated from chitin. Any abnormality in cuticle metabolism cause abnormalities and death during molting(Tang et al, Reference Tang, Wei, Zhao, Shi, Shen, Yang, Xie and Wang2016). For example, in Nilaparvata lugens, NlTRE silencing affected the process of chitin biosynthesis and degradation, thus affecting the molting process (Zhao et al, Reference Zhao, Yang, Shen, Liu, Shi, Wang and Tang2016). The inhibition of TcCPR27 and TcCPR18 led to the abnormal formation of the horizontal chitin layer and vertical pore tube in Tribolium castaneum (Noh et al, Reference Noh, Kramer, Muthukrishnan, Kanost, Beeman and Arakane2014). In Henosepilachna vigintioctopotata, the expression of the CHS gene affected the thickness and structure of the cuticle, and inhibition caused cuticle thinning and structural abnormality(Jiang et al, Reference Jiang, Mu, Jin, Anjum and Li2021). In this study, it was found that the silencing of PcCDA also affected the metabolism of chitin, thus affecting the cuticle structure, leading to abnormal molting and death. This was consistent with the previous research results, that is, the structure of the insect cuticle was closely related to chitin, and the abnormality of key genes in the chitin metabolism pathway seriously affected insect cuticle metabolism.
Chitin deacetylase are crucial for constructing the cuticle of P. citri. Specifically, PcCDA is vital for successful molting, and maintaining the structural integrity of the external cuticle. Furthermore, as a potential target for RNAi, PcCDAs provides a basis for developing pest management strategies.
Supplementary material
The supplementary material for this article can be found at https://doi.org/10.1017/S0007485325100291
Acknowledgements
This research was supported by the key project of the Ministry of Agriculture and Rural Affairs of China ‘Investigation on the Occurrence, Harm and Diffusion Risk of Agricultural Alien Invasive Species’ (13220141), The Graduate Innovation Foundation of Jiangxi Province, China (YC2022—B024).
Competing interest
All the authors have no conflict of interest to declare.