Implications
This paper aimed at assessing parameters which will be useful to estimate the genetic merit of dairy cattle for milk coagulation properties (MCP) predicted by mid-infrared spectroscopy (MIRS) during routine data recording. Estimates of heritability and genetic correlation indicate that selection for coagulation ability is feasible without altering results for milk quality traits. Selection for MCP can be helped, but not substituted, by selection for fat, protein and casein percentages. Repeated measures per cow are needed but MIRS seems to be suitable for genetic purposes.
Introduction
The interest for improving milk coagulation properties (MCP) has increased during last years. The ability of milk to react to the presence of rennet has been intensively studied in cattle (Aleandri et al., Reference Aleandri, Schneider and Buttazzoni1989; De Marchi et al., Reference De Marchi, Dal Zotto, Cassandro and Bittante2007). It has been widely demonstrated that milk with desirable clotting characteristics, namely relatively short clotting time, good firming rate and high curd firmness at cut, results in higher cheese yield than poorly coagulating milk (Johnson et al., Reference Johnson, Chen and Jaeggi2001; Pretto et al., Reference Pretto, De Marchi, Penasa and Cassandro2013) and increased profitability for the dairy industry (Bynum and Olson, Reference Bynum and Olson1982; Formaggioni et al., Reference Formaggioni, Sandri, Franceschi, Malacarne and Mariani2005). The improvement of MCP is strongly advisable to enhance dairy sector efficiency, especially in countries were milk is predominantly destined to cheese production (Geary et al., Reference Geary, Lopez-Villalobos, Garrick and Shalloo2010).
The main parameters describing MCP are the time elapsed between rennet addition and start of casein micelles aggregation (rennet coagulation time (RCT), min), and curd firmness 30 min after enzyme addition (a30, mm). Improvement of these traits can be achieved through selection for correlated traits such as milk protein content and composition (Bonfatti et al., Reference Bonfatti, Cecchinato, Gallo, Blasco and Carnier2011; Jensen et al., Reference Jensen, Holland, Poulsen and Larsen2012), milk acidity (López et al., Reference López, Lomholt and Qvist1998; Nájera et al., Reference Nájera, de Renobales and Barron2003) and somatic cell count (SCC; Politis and Ng-Kwai-Hang, Reference Politis and Ng-Kwai-Hang1988; Klei et al., Reference Klei, Yun, Sapru, Lynch, Barbano, Sears and Galton1998). Moreover, genetic variants at the protein loci have been demonstrated to exert an effect on MCP (Kübarsepp et al., Reference Kübarsepp, Henno, Viinalass and Sabre2005; Comin et al., Reference Comin, Cassandro, Chessa, Ojala, Dal Zotto, De Marchi, Carnier, Gallo, Pagnacco and Bittante2008). In addition, the possibility of improving MCP through selective breeding has been demonstrated in several studies, involving different dairy cattle populations in different countries. Additive genetic variation has been estimated in papers focusing on cow individual measures of MCP and heritabilities for RCT and a30 were found to be moderate (Ikonen et al., Reference Ikonen, Morri, Tyrisevä, Ruottinen and Ojala2004; Cassandro et al., Reference Cassandro, Comin, Ojala, Dal Zotto, De Marchi, Gallo, Carnier and Bittante2008; Vallas et al., Reference Vallas, Bovenhuis, Kaart, Pärna, Kiiman and Pärna2010). In addition, cow repeatabilities were moderate to high (Tyrisevä et al., Reference Tyrisevä, Ikonen and Ojala2003; Vallas et al., Reference Vallas, Bovenhuis, Kaart, Pärna, Kiiman and Pärna2010).
Genetic correlations among MCP, yield and composition traits revealed that technological properties of milk can be improved without hampering selection for production and quality traits (Pretto et al., Reference Pretto, López-Villalobos, Penasa and Cassandro2012). However, direct phenotyping for renneting ability would result in higher genetic gain because both related traits (Pretto et al., Reference Pretto, López-Villalobos, Penasa and Cassandro2012) and protein genotypes (Comin et al., Reference Comin, Cassandro, Chessa, Ojala, Dal Zotto, De Marchi, Carnier, Gallo, Pagnacco and Bittante2008; Penasa et al., Reference Penasa, Cassandro, Pretto, De Marchi, Comin, Chessa, Dal Zotto and Bittante2010; Vallas et al., Reference Vallas, Kaart, Värv, Pärna, Jõudu, Viinalass and Pärna2012) are not able to give the same genetic change. For instance, genetic correlations of MCP were found negligible with milk yield but moderate to strong with protein and casein percentages and SCC, generally moderate with fat percentage, and strong with milk pH.
The most used instruments to measure MCP are the computerized renneting meter (Ikonen et al., Reference Ikonen, Morri, Tyrisevä, Ruottinen and Ojala2004; Cassandro et al., Reference Cassandro, Comin, Ojala, Dal Zotto, De Marchi, Gallo, Carnier and Bittante2008), the Formagraph (Tyrisevä et al., Reference Tyrisevä, Ikonen and Ojala2003; Cipolat-Gotet et al., Reference Cipolat-Gotet, Cecchinato, De Marchi, Penasa and Bittante2012) and the Optigraph (Vallas et al., Reference Vallas, Bovenhuis, Kaart, Pärna, Kiiman and Pärna2010). Unfortunately these methodologies are not applicable at population level, and thus they are not useful for breeding purposes. The use of mid-infrared spectroscopy (MIRS) has been proposed to overcome these limitations and to predict several milk traits such as fatty acid composition (e.g. Soyeurt et al., Reference Soyeurt, Dardenne, Dehareng, Lognay, Veselko, Marlier, Bertozzi, Mayeres and Gengler2006; De Marchi et al., Reference De Marchi, Penasa, Cecchinato, Mele, Secchiari and Bittante2011) and MCP (Dal Zotto et al., Reference Dal Zotto, De Marchi, Cecchinato, Penasa, Cassandro, Carnier, Gallo and Bittante2008; Cecchinato et al., Reference Cecchinato, De Marchi, Gallo, Bittante and Carnier2009; De Marchi et al., Reference De Marchi, Fagan, O'Donnell, Cecchinato, Dal Zotto, Cassandro, Penasa and Bittante2009 and Reference De Marchi, Toffanin, Cassandro and Penasa2013). Milk coagulation properties are currently available in several Italian milk laboratories, both for individual and bulk milk samples (De Marchi et al., Reference De Marchi, Penasa, Tiezzi, Toffanin and Cassandro2012), since these laboratories have implemented MCP prediction models in Milko-Scan spectrometer (Foss Electric A/S, Hillerød, Denmark). Thus, the use of MIRS to predict MCP could be a valuable technology to collect phenotypes for genetic analyses.
The aims of this study were (i) to estimate heritability and repeatability of MCP predicted by MIRS during routine data collection and (ii) to assess phenotypic and genetic correlations of MCP with pH, quality traits, yields and somatic cell score (SCS) of milk from dairy cows.
Material and methods
From October 2011 to September 2012, 93 605 individual milk samples from 25 590 Holstein-Friesian cows were collected in 449 dairy farms during monthly test-day milk recording. Samples were processed according to International Committee for Animal Recording (ICAR) procedures, combined with preservative immediately after collection (Bronopol; Knoll Pharmaceuticals, Nottingham, UK) and analyzed in the laboratory of the Breeders Association of Veneto region (Padova, Italy). Protein (PP), fat (FP), casein (CP) and lactose (LP) percentages, and pH, RCT and a30 were assessed using Milko-Scan FT6000 (Foss Electric A/S). Mid-infrared spectroscopy models were implemented for routine prediction of MCP as reported by De Marchi et al. (Reference De Marchi, Penasa, Tiezzi, Toffanin and Cassandro2012); the authors estimated satisfactory accuracies with coefficients of determination in cross-validation of 0.76 and 0.70 for RCT and a30, respectively. Values of milk pH were obtained using MIRS prediction model implemented by Foss Electric A/S directly on Milko-Scan FT6000 (http://www.foss.dk/industry-solution/products/combifoss-ft). The potential of MIRS to predict milk pH was previously assessed by De Marchi et al. (Reference De Marchi, Fagan, O'Donnell, Cecchinato, Dal Zotto, Cassandro, Penasa and Bittante2009), who reported a coefficient of determination in cross-validation of 0.60. SCC was determined with Cell Fossomatic 250 (Foss Electric A/S) and was transformed to SCS according to the formula [SCS = 3 + log2(SCC/100 000)]. Besides the aforementioned traits, daily milk yield (MY, kg) was also recorded, and casein to protein (C : P) and protein to fat (P : F) ratios, and daily fat (FY), protein (PY), casein (CY) and lactose (LY) yields were calculated. In the present study, C : P and P : F were included as candidate correlated traits which could improve accuracy of genetic evaluation for MCP.
Only records from cows with known sire and dam were included in the analysis; cows were required to be in parity 1 to 9 and between 5 and 365 days in milk. Records were retained if RCT values were between 5 and 30 min, as this is the range on which the calibration equation was developed. Moreover, records were discarded from the dataset, if they deviated more than 3.5 standard deviations from the mean for each trait. Sires were required to have a minimum of five daughters distributed across at least three herds and cows were required to have a minimum of two herd-test-date (HTD) observations within a lactation. Records from HTD classes with less than three animals were removed from the dataset. After editing, 63 470 records from 16 089 cows in 345 herds were available for statistical analysis. Cows were progeny of 800 sires and the number of daughters per sire ranged from 5 to 417. Data were analyzed using the following linear animal model:
 $$y\, = \,Xb\, + \,{{Z}_h}h\, + \,{{Z}_p}p\, + \,{{Z}_a}a\, + \,e,$$
where y is the vector of phenotypic records for the analyzed trait (RCT, a30, MY, FY, PY, CY, LY, FP, PP, CP, LP, SCS, pH, C : P, P : F), b is the vector of fixed effects of parity (3 classes: parity 1, parity 2 and parities 3 to 9) and stage of lactation (12 monthly classes: 6 to 35 days; 36 to 65 days; 66 to 95 days; 96 to 125 days; 126 to 155 days; 156 to 185 days; 186 to 215 days; 216 to 245 days; 246 to 275 days; 276 to 305 days; 306 to 335 days; 336 to 365 days), h is the vector of solutions for HTD random effect, p is the vector of solutions for cow permanent environmental effect, a is the vector of solutions for animal additive genetic effect and e is the vector of random residuals. X, Zh, Zp and Za are the respective incidence matrices of the appropriate order.
Variance and covariance components were estimated using univariate and bivariate models implemented in a Bayesian framework using the software GIBBS3F90 (Misztal, available online at: http://nce.ads.uga.edu/%7Eignacy/programs.html). For univariate models, 250 000 iterations were run discarding the first 50 000 samples as burn-in and storing samples every 20 iterations, and for bivariate models chains included a total of 600 000 iterations with the first 100 000 samples as burn-in and a thinning interval of 50 iterations. Heritability (h 2), intra-herd heritability (h 2IH), repeatability (rep) and cow permanent environmental (h pe) and HTD (h htd) effects were defined as
 $$ {{h}^{\rm{2}}} \, = \,\frac{{\sigma _{{\rm{a}}}^{{\rm{2}}} }}{{\sigma _{{\rm{a}}}^{{\rm{2}}} \, + \,\sigma _{{{\rm{pe}}}}^{{\rm{2}}} \, + \,\sigma _{{{\rm{htd}}}}^{{\rm{2}}} \, + \,\sigma _{{\rm{e}}}^{{\rm{2}}} }} $$
 $$h_{{{\rm{IH}}}}^{{\rm{2}}} \, = \,\frac{{\sigma _{{\rm{a}}}^{{\rm{2}}} }}{{\sigma _{{\rm{a}}}^{{\rm{2}}} \, + \,\sigma _{{{\rm{pe}}}}^{{\rm{2}}} \, + \,\sigma _{{\rm{e}}}^{{\rm{2}}} }}$$
 $${\rm{rep}}\, = \,\frac{{\sigma _{{\rm{a}}}^{{\rm{2}}} \, + \,\sigma _{{{\rm{pe}}}}^{{\rm{2}}} }}{{\sigma _{{\rm{a}}}^{{\rm{2}}} \, + \,\sigma _{{{\rm{pe}}}}^{{\rm{2}}} \, + \,{\rm{\sigma }}_{{{\rm{htd}}}}^{{\rm{2}}} \, + \,\sigma _{{\rm{e}}}^{{\rm{2}}} }}$$
 $${{h}_{{\rm{pe}}}}\, = \,\frac{{\sigma _{{{\rm{pe}}}}^{{\rm{2}}} }}{{\sigma _{{\rm{a}}}^{{\rm{2}}} \, + \,\sigma _{{{\rm{pe}}}}^{{\rm{2}}} \, + \,\sigma _{{{\rm{htd}}}}^{{\rm{2}}} \, + \,\sigma _{{\rm{e}}}^{{\rm{2}}} }}$$
 $${{h}_{{\rm{htd}}}}\, = \,\frac{{\sigma _{{{\rm{htd}}}}^{{\rm{2}}} }}{{\sigma _{{\rm{a}}}^{{\rm{2}}} \, + \,{\rm{\sigma }}_{{{\rm{pe}}}}^{{\rm{2}}} \, + \,\sigma _{{{\rm{htd}}}}^{{\rm{2}}} \, + \,\sigma _{{\rm{e}}}^{{\rm{2}}} }}$$
Genetic (r gen), cow permanent environmental (r pe) and HTD (r htd) correlations for random effects were calculated as:
 $$no{{{r}_{{\rm{gen}}}}\, = \,\frac{{{{{{\rm cov}}}_{\rm a}}}}{{\sqrt {\sigma _{{{\rm{x,a}}}}^{{\rm{2}}} \, + \,\sigma _{{{\rm{y,a}}}}^{{\rm{2}}} } }}{\rm{,}}\;{{r}_{{\rm{pe}}}}\, = \,\frac{{{{{{\rm cov}}}_{{\rm{pe}}}}}}{{\sqrt {\sigma _{{{\rm{x,pe}}}}^{{\rm{2}}} \, + \,\sigma _{{{\rm{y,pe}}}}^{{\rm{2}}} } }}{\rm{,}} \cr \;{{r}_{{\rm{htd}}}}\, = \,\frac{{{\rm{co}}{{{\rm{v}}}_{{\rm{htd}}}}}}{{\sqrt {\sigma _{{{\rm{x,htd}}}}^{{\rm{2}}} \, + \,\sigma _{{{\rm{y,htd}}}}^{{\rm{2}}} } }}$$
where σ 2a is the additive genetic variance, σ 2pe is the cow permanent environmental variance, σ 2htd is the HTD variance and σ 2e is the residual variance. The posterior means of the marginal posterior distributions were considered as estimates of (co)variance components and related parameters, and the 95% highest probability density intervals (HPD95) were calculated as dispersion measure of the posterior distribution.
Results
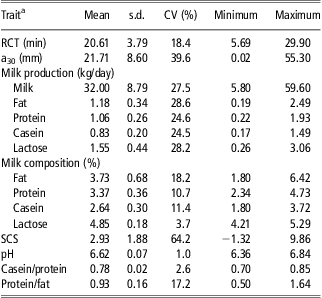
Descriptive statistics for the analyzed traits are given in Table 1. Milk yield, FY, PY, CY and LY averaged 32.00, 1.18, 1.06, 0.83 and 1.55 kg/day, respectively. Regarding milk components, FP, PP, CP and LP averaged 3.73%, 3.37%, 2.64% and 4.85%, respectively. Mean values for RCT, a30, pH and SCS were 20.61 min, 21.71 mm, 6.62 and 2.93, respectively (Table 1). Somatic cell score showed the highest CV (64.2%), whereas pH the lowest (1%). Rennet coagulation time and a30 showed CV of 18.4% and 39.6%, respectively. Coefficient of variation for yield traits ranged from 24.5% (CY) to 28.6% (FY) and for milk contents from 3.7% (LP) to 18.2% (FP). Finally, CV of C : P and P : F were 2.6% and 17.2%, respectively.
Descriptive statistics for milk coagulation properties, production and quality traits (n = 63 470)
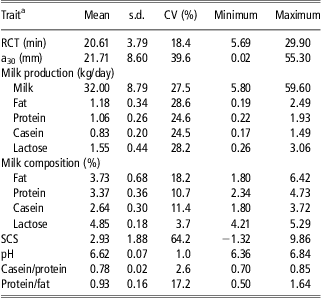
RCT = rennet coagulation time; SCS = somatic cell score.
aSCS = [3 + log2(SCC/100 000)]; a30 = curd firmness 30 min after rennet addition.
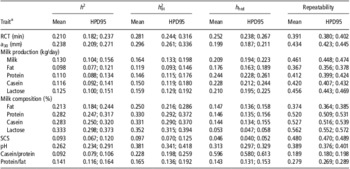
Heritabilities, intra-herd heritabilities, repeatabilities and HTD effect are reported in Table 2. The mean of the posterior distribution for each parameter is used as point estimate, and HPD95 are used as error indicator of the estimates. Rennet coagulation time, a30 and pH showed heritabilities of 0.210, 0.238 and 0.262, respectively. Heritabilities for daily yields were moderately low and ranged from 0.098 (FY) to 0.130 (MY). Milk constituents expressed as percentage showed higher estimates (0.213 for FP to 0.333 for LP), but with the same pattern of daily yields (Table 2). Finally, SCS showed low heritability (0.093), as well as C : P (0.092) and P : F (0.141).
Posterior means and 95% highest probability density intervals (HPD95) for heritability (h2), intra-herd heritability (h2IH), repeatability and herd-test-day effect (hhtd) of recorded traits

RCT = rennet coagulation time; SCS = somatic cell score.
aSCS = [3 + log2(SCC/100 000)]; a30 = curd firmness 30 min after rennet addition.
Intra-herd heritabilities differed from heritabilties only in the presence of a strong HTD effect. Herd-test-day effect was moderately low for MCP, being 0.252 for RCT and 0.199 for a30, leading to intra-herd heritabilites of 0.281 and 0.296, respectively (Table 2). Daily yield traits exhibited a moderately low HTD effect (0.176 for FY to 0.244 for PY) which led to intra-herd heritabilities from 0.119 (FY) to 0.164 (MY). Compared with yield traits, a relatively smaller HTD effect was found for milk composition; it was around 0.145 for FP, PP and CP, and 0.053 for LP. A negligible HTD effect was estimated for SCS (0.046), whereas pH showed the highest intra-herd heritability (0.381), suggesting a certain importance of HTD effect (0.313). Finally, the HTD effect for P : F was low (0.143), and it was high for C : P (0.596). Consequently, intra-herd heritability of C : P was much higher than its heritability (0.228 v. 0.092; Table 2).
Repeatabilities for RCT and a30 were 0.391 and 0.434, respectively (Table 2), suggesting that the magnitude of cow permanent environmental effects for these traits was similar to their heritabilities. Estimates of repeatability for daily yields (0.367 for FY to 0.461 for MY) were comparable to those reported for MCP, although cow permanent environmental effect was higher here. Among milk contents, FP exhibited the lowest repeatability (0.374) and the lowest cow permanent environmental effect. PP, CP and LP exhibited repeatabilities greater than 0.500 (Table 2), and cow permanent environmental effect was lower than their heritabilities. Moderate repeatabilities were also assessed for SCS (0.480) and pH (0.389), and the former trait exhibited the highest cow permanent environmental effect among all studied variables. Finally, C : P (0.189) and P : F (0.279) were less repeatable traits (Table 2).
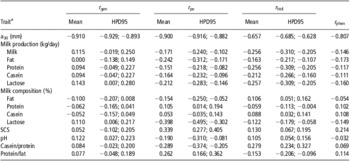
Table 3 summarizes the genetic, phenotypic, permanent environmental and HTD correlations between RCT and the other traits. Rennet coagulation time and a30 were strongly related either on the genetic (−0.910), permanent environmental (−0.900) and phenotypic (−0.807) level, whereas the correlation was slightly weaker at HTD level (−0.657). No significant genetic relationships of RCT with SCS, C : P, P : F, production and quality traits were detected as estimates included ‘0’ in the HPD95, except for LY and LP. Posterior distribution for the genetic relationship between RCT and pH did not include ‘0’, indicating an existing, although low correlation (0.122; Table 3).
Posterior means and 95% highest probability density intervals (HPD95) for genetic (rgen), cow permanent environmental (rpe) and herd-test-day (rhtd) correlations, and phenotypic relationships (rphen) between rennet coagulation time and milk yield and quality traits

SCS = somatic cell score.
aSCS = [3 + log2(SCC/100 000)]; a30 = curd firmness 30 min after rennet addition.
Permanent environmental correlations between RCT and the other traits were constantly stronger than genetic ones, and seldom exhibited the same sign. Estimates ranged from −0.242 to −0.151 for production traits, and from −0.398 to 0.105 for milk composition. Only FP was of sign concordant with the genetic correlation, and LP showed the strongest permanent environmental correlation with RCT among all traits (a30 excluded). A moderate permanent environmental correlation was found between RCT and SCS (0.339), and a low correlation was found between RCT and pH (−0.190). Again, permanent environmental correlations of RCT with C : P and P : F were higher than the genetic ones (Table 3).
Herd-test-day relationships between RCT and the other traits were moderate to low and not in all cases concordant with genetic and permanent environmental correlations. For yield traits, the posterior distributions were negative and comprised between −0.257 and −0.163. Correlations between RCT and milk contents, SCS and pH were very low, ranging from −0.122 to 0.130, and C : P and P : F showed moderate HTD correlation with RCT (0.279 and −0.153, respectively; Table 3). On the phenotypic level, RCT did not show any strong correlation with production and quality traits, and the highest correlation was with SCS (0.214).
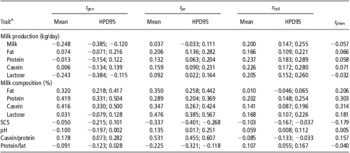
Table 4 summarizes the genetic, phenotypic, permanent environmental and HTD correlations between a30 and the other traits. The pattern of the relationships was different than that of RCT. Curd firmness showed stronger and negative genetic correlations with MY (−0.248) and LY (−0.243), although the latter relationship might be an indirect effect of the relationship with MY, being lactose constant in milk. Fat yield, PY and CY were not related to a30 on the genetic level (Table 4). Milk contents showed moderate genetic correlations with a30, except for LP, which did not correlate with a30. PP (0.419) and CP (0.416) showed the strongest correlations with a30, whereas FP was slightly less related (0.320). Somatic cell score and pH did not show significant correlations with a30 (Table 4). Concerning ratios of milk constituents, only C : P was related to a30.
Posterior means and 95% highest probability density intervals (HPD95) for genetic (rgen), cow permanent environmental (rpe) and herd-test-day (rhtd) correlations, and phenotypic relationships (rphen) between curd firmness 30 min after rennet addition and milk yield and quality traits

SCS = somatic cell score.
aSCS = [3 + log2(SCC/100 000)].
Permanent environmental correlations between a30 and yield traits ranged from 0.037 to 0.206. However, a30 was more strongly related to milk contents: 0.476 with LP, 0.350 with FP, 0.347 with CP and 0.289 with PP. Similarly to RCT, a30 was more strongly related to SCS and pH on the permanent environmental level than on the genetic one (Table 4). HTD correlations of a30 with production and quality traits were generally low, particularly with milk composition, SCS, pH, C : P and P : F. Finally, a30 scarcely correlated with the other traits at phenotypic level, and the highest correlations were with FP (0.206), PP (0.303) and CP (0.314).
Discussion
Mean (32.00 kg/day) and variation (CV of 27.5%) for MY of Holstein-Friesian from the present study are consistent with values (32.30 kg/day and 31%, respectively) reported by Cassandro et al. (Reference Cassandro, Comin, Ojala, Dal Zotto, De Marchi, Gallo, Carnier and Bittante2008) in an Italian study conducted on the same breed. Values of FP and PP are slightly lower than findings of Cassandro et al. (Reference Cassandro, Comin, Ojala, Dal Zotto, De Marchi, Gallo, Carnier and Bittante2008), with 3.73% v. 3.89% for FP and 3.37% v. 3.45% for PP, respectively, whereas CP is very similar (2.64% v. 2.65%, respectively). Variability for FP, PP and CP is comparable (CV of 18.2% v. 20.0%, 10.7% v. 12.0% and 11.4% v. 11.0%, respectively). The average value of SCS was lower (2.93) than that (3.08) of Cassandro et al. (Reference Cassandro, Comin, Ojala, Dal Zotto, De Marchi, Gallo, Carnier and Bittante2008), but the variability was of the same magnitude.
Milk coagulation properties were routinely predicted by MIRS; average values for RCT (20.61 min) and a30 (21.71 mm) are far from values of Cassandro et al. (Reference Cassandro, Comin, Ojala, Dal Zotto, De Marchi, Gallo, Carnier and Bittante2008), who reported 16.9 min for RCT and 32.0 mm for a30 measured by the computerized renneting meter. However, the variability was quite similar as the CV were 18.4 (v. 27%) and 39.6 (v. 35%) for RCT and a30, respectively. Average pH predicted by MIRS, showed a lower mean value (6.62 v. 6.67) compared with that of Cassandro et al. (Reference Cassandro, Comin, Ojala, Dal Zotto, De Marchi, Gallo, Carnier and Bittante2008) measured with a pH-meter. Average values for MCP and milk composition are worse than those of Cecchinato et al. (Reference Cecchinato, De Marchi, Gallo, Bittante and Carnier2009) in Italian Brown Swiss, who reported means of 15.0 min for RCT and 41.7 mm for a30 evaluated using the computerized renneting meter, and by Bonfatti et al. (Reference Bonfatti, Cecchinato, Gallo, Blasco and Carnier2011) in Italian Simmental, who reported RCT and a30 of 16.51 min and 29.08 mm, respectively, using the same mechanical device. Ikonen et al. (Reference Ikonen, Morri, Tyrisevä, Ruottinen and Ojala2004) found 11.80 ± 5.50 min for RCT and 24.0 ± 13.3 mm for a30 in Finnish Ayrshire and Tyrisevä et al. (Reference Tyrisevä, Vahlsten, Ruottinen and Ojala2004) reported 11.2 ± 5.0 min for RCT and 26.5 ± 11.8 mm for a30 in Finnish Ayrshire, Holstein and crossbred cows. Vallas et al. (Reference Vallas, Bovenhuis, Kaart, Pärna, Kiiman and Pärna2010) analyzed log-transformed RCT in Estonian Holstein population and found an average value of 2.3 (CV of 9%) and an average a30 of 27.0 mm (CV of 27%). However, direct comparison of MCP among breeds reared in different countries has to be made with caution because dairy populations have different genetic structure, and laboratory analyses are known to differ in terms of instruments used and activity of the coagulant (Pretto et al., Reference Pretto, Kaart, Vallas, Jõudu, Henno, Ancilotto, Cassandro and Pärna2011).
In the present study, MCP were predicted by MIRS using the calibration model developed by De Marchi et al. (Reference De Marchi, Penasa, Tiezzi, Toffanin and Cassandro2012) and installed by Foss Electric A/S on the laboratory instrument. The model works in the range from 5 to 30 min, and thus it does not consider the so-called noncoagulating (NC) milk, that is, milk with RCT longer than 30 min from rennet addition; however, only 3.5% of samples did not exhibit RCT within 30 min from the beginning of the analysis. The presence of records with RCT longer than 30 min does not necessarily mean that those samples are NC, as they might be because of the inability of the calibration equation to predict RCT when it approaches the 30 min values. The phenomenon of NC milk is associated to several factors such as pH, SCC, mastitis, κ-casein concentration and genotypes, stage of lactation and breed of cow. Besides the aforementioned factors, additive genetic effects seem to influence the occurrence of NC milk (e.g. Ikonen et al., Reference Ikonen, Morri, Tyrisevä, Ruottinen and Ojala2004; Tyrisevä et al., Reference Tyrisevä, Vahlsten, Ruottinen and Ojala2004). The inclusion of NC information in statistical models aiming at estimating covariance components for MCP may influence the assessment of genetic parameters for coagulation traits (Ikonen et al., Reference Ikonen, Morri, Tyrisevä, Ruottinen and Ojala2004), but the impact depends mainly on the proportion of NC samples: the lower the proportion, the lower the influence on covariance components.
The heritabilities and intra-herd heritabilities for RCT and a30 predicted by MIRS are moderate, but large enough for genetic improvement of the traits (Table 2). Cassandro et al. (Reference Cassandro, Comin, Ojala, Dal Zotto, De Marchi, Gallo, Carnier and Bittante2008) estimated heritabilities of 0.25 and 0.15 for RCT and a30, respectively, measured once on Holstein-Friesian cows using the Computerized Renneting Meter (CRM; Polo Trade, Monselice, Italy). Bonfatti et al. (Reference Bonfatti, Cecchinato, Gallo, Blasco and Carnier2011) reported heritabilities of 0.29 and 0.12 for RCT and a30 assessed using the CRM in Italian Simmental. The heritability for a30 was much higher in our study than in Cassandro et al. (Reference Cassandro, Comin, Ojala, Dal Zotto, De Marchi, Gallo, Carnier and Bittante2008) and Bonfatti et al. (Reference Bonfatti, Cecchinato, Gallo, Blasco and Carnier2011). Cecchinato et al. (Reference Cecchinato, De Marchi, Gallo, Bittante and Carnier2009) compared heritabilities of MCP assessed with CRM and Milko-Scan FT120 (Foss Electric A/S) and they reported higher estimates for RCT and a30 predicted by MIRS than for measures of these traits obtained with CRM. Ikonen et al. (Reference Ikonen, Morri, Tyrisevä, Ruottinen and Ojala2004) assessed heritability of 0.28 for RCT and 0.39 for a30 measured with the CRM on samples from Finnish Ayrshire cows sampled once. In the same study, estimates of herd effect were 0.05 and 0.06 for RCT and a30, respectively, which are lower than values found in the present work. Similarly, Tyrisevä et al. (Reference Tyrisevä, Vahlsten, Ruottinen and Ojala2004) estimated heritabilities of 0.21 and 0.22, and HTD effect of 0.06 and 0.09 for RCT and a30, respectively, in Finnish Ayrshire, Holstein and crossbred cows.
Vallas et al. (Reference Vallas, Bovenhuis, Kaart, Pärna, Kiiman and Pärna2010) used repeated measures for MCP assessed using Optigraph in Estonian Holstein cows. The authors reported heritabilities of 0.28 and 0.41 for log-transformed RCT and a30, respectively, repeatabilities of 0.45 and 0.50, and herd effect of 0.04 and 0.03. It is worth noting that in studies which dealt with multiple measures per cow, repeatabilities were higher than heritabilities, proving a consistent cow permanent environmental effect. Repeatability of RCT and a30 from the present work is lower than 0.500, and thus it is of undeniable importance to collect repeated measures per cow to obtain reliable estimates of breeding values for MCP. In addition, considering the results, herd environmental effect had moderate impact on MCP.
The present study confirmed the strong genetic and phenotypic correlations between RCT and a30, as previously reported (Tyrisevä et al., Reference Tyrisevä, Ikonen and Ojala2003; Ikonen et al., Reference Ikonen, Morri, Tyrisevä, Ruottinen and Ojala2004; Cassandro et al., Reference Cassandro, Comin, Ojala, Dal Zotto, De Marchi, Gallo, Carnier and Bittante2008). Only Vallas et al. (Reference Vallas, Bovenhuis, Kaart, Pärna, Kiiman and Pärna2010) found very weak relationships between a30 and log-transformed RCT. On the phenotypic level, MCP did not appear to be related to most of considered traits (coefficients of correlation were lower than 0.25 as absolute value), except for PP and CP, which showed a moderate correlation with a30 (0.303 and 0.314, respectively). This result is in agreement with Cassandro et al. (Reference Cassandro, Comin, Ojala, Dal Zotto, De Marchi, Gallo, Carnier and Bittante2008) who found comparable genetic correlations (0.23 and 0.32, respectively). Similarly, Vallas et al. (Reference Vallas, Bovenhuis, Kaart, Pärna, Kiiman and Pärna2010) reported a moderate relationship between PP and a30 (0.45). SCS was not phenotypically related to MCP, neither in the present study nor in the literature. On the contrary, in the aforementioned papers milk pH showed moderate phenotypic correlations with MCP, with values often higher than 0.30 as absolute value, indicating that milk characterized by high pH has worse renneting ability (Okigbo et al., Reference Okigbo, Richardson, Brown and Ernstrom1985; Nájera et al., Reference Nájera, de Renobales and Barron2003). The same relationship was not found in the present work, which reported phenotypic correlation very close to zero between MCP and pH. A possible explanation might be that measures of pH from the present work may depend on the predicting ability of the calibration equation used and further study is needed to investigate strategies to improve the equation for this trait.
Curd firmness was positively and favorably correlated with some milk component traits, particularly with PP, CP and FP, whereas an antagonistic genetic correlation between MY and a30 (−0.248) has been assessed. On the contrary, RCT was not strongly related to yield and quality traits. On the cow permanent environmental level, correlations between a30 and FP (0.350), PP (0.289) and CP (0.347) reflected the genetic relationships. Surprisingly, LP was correlated both with RCT (−0.398) and a30 (0.476). Genetic correlations are partially in agreement with the literature: Cassandro et al. (Reference Cassandro, Comin, Ojala, Dal Zotto, De Marchi, Gallo, Carnier and Bittante2008) reported moderate relationships of RCT and a30 with MY (−0.24 and 0.22, respectively) and CP (−0.22 and 0.53), and of a30 with PP (0.44), but all other correlations with milk contents were very low. Vallas et al. (Reference Vallas, Bovenhuis, Kaart, Pärna, Kiiman and Pärna2010) estimated moderate to low correlations with PP (0.19 and 0.48 for log-transformed RCT and a30, respectively), and between a30 and FP (0.25). Ikonen et al. (Reference Ikonen, Morri, Tyrisevä, Ruottinen and Ojala2004) found weak correlations with MY and milk percentages. Contrarily, Lindström et al. (Reference Lindström, Antila and Syväjärvi1984) found strong genetic relationships of clotting time with FP (−0.91) and PP (−0.58), and a null genetic correlation with LP (−0.05).
SCS was not genetically related to MCP (0.052 and −0.050 with RCT and a30, respectively), although it was moderately related on the cow permanent environmental level (0.339 and −0.337, respectively). The low genetic correlations are not in agreement with findings from studies that used single cow measurements (Ikonen et al., Reference Ikonen, Morri, Tyrisevä, Ruottinen and Ojala2004; Cassandro et al., Reference Cassandro, Comin, Ojala, Dal Zotto, De Marchi, Gallo, Carnier and Bittante2008), but are consistent with Vallas et al. (Reference Vallas, Bovenhuis, Kaart, Pärna, Kiiman and Pärna2010), who collected repeated measures per cow and included the cow permanent environmental effect in the model. It is important to underline that only in the case of repeated sampling it is possible to estimate additive genetic and permanent environmental correlations as different entities. In fact, Cassandro et al. (Reference Cassandro, Comin, Ojala, Dal Zotto, De Marchi, Gallo, Carnier and Bittante2008) assessed genetic correlations of 0.22 and −0.40 between SCS and RCT, and SCS and a30, respectively, and Ikonen et al. (Reference Ikonen, Morri, Tyrisevä, Ruottinen and Ojala2004) found values of 0.29 and −0.45. On the other hand, Vallas et al. (Reference Vallas, Bovenhuis, Kaart, Pärna, Kiiman and Pärna2010) estimated genetic correlations of −0.06 and −0.04. Results suggest that SCS is related to MCP when a single measure per cow is considered and the genetic and permanent environmental effect of the cow cannot be disentangled. However, further research is needed as previous results were obtained from different populations.
Milk pH was weakly related to MCP at the genetic (0.122 and −0.100 with RCT and a30, respectively) and cow permanent environmental (−0.190 and 0.135, respectively) level. The results for genetic relationships are much lower than those reported by other authors and this might be related to the predicting ability of the calibration equation used. In Cassandro et al. (Reference Cassandro, Comin, Ojala, Dal Zotto, De Marchi, Gallo, Carnier and Bittante2008) genetic correlations of pH with RCT and a30 were 0.81 and −0.85, respectively; in Bonfatti et al. (Reference Bonfatti, Cecchinato, Gallo, Blasco and Carnier2011) they were 0.61 and −0.61; and in Ikonen et al. (Reference Ikonen, Morri, Tyrisevä, Ruottinen and Ojala2004) 0.50 and −0.32. However, Vallas et al. (Reference Vallas, Bovenhuis, Kaart, Pärna, Kiiman and Pärna2010) estimated genetic relationships of −0.06 between pH and a30, and of 0.69 between pH and log-transformed RCT. Casein to protein and P : F ratios were not related to MCP on the phenotypic and genetic level, whereas a relationship was found on the cow permanent environmental level, particularly in the case of C : P. Results indicate that ratios of milk constituents are not suitable for an indirect selection to improve RCT and a30.
Mid-infrared spectroscopy models used in this study to predict MCP exhibited coefficients of determination of cross-validation equal to 0.76 for RCT and 0.70 for a30 (De Marchi et al., Reference De Marchi, Penasa, Tiezzi, Toffanin and Cassandro2012); these values can be regarded as a phenotypic relationship between the trait of interest (real milk coagulation ability) and the correlated trait (MIRS-predicted milk coagulation ability). The coefficients obtained here are not optimal, but the lack in prediction is compensated by the higher number of records obtained per cow when MIRS is routinely implemented. Pretto et al. (Reference Pretto, López-Villalobos, Penasa and Cassandro2012) provided an accurate estimation of the genetic progress achievable under different breeding scenarios.
Current selection index for Italian Holstein-Friesian breed includes PY, FY, PP and FP (with higher emphasis on protein than fat and on yields than percentages), and SCS, fertility, functional longevity, type, udder composite index and feet and legs index. In a recent study, Pretto et al. (Reference Pretto, López-Villalobos, Penasa and Cassandro2012) reported that current selection index for Italian-Holstein breed leads to a small genetic improvement of MCP, and thus the direct inclusion of RCT and a30 is necessary to genetically enhance coagulation traits. This is the consequence of the rather low genetic correlations between MCP and most production and quality traits (except for a30 with PP and CP), as confirmed in the present study. Repeatability of MCP was moderate, suggesting that a single measure per cow is not representative of animal performance. HTD environmental effect has been confirmed to be moderate for MCP; however, a consistent number of herds should be sampled on several months of the year, as differences in MCP are expected to arise from different seasons. HTD correlations between MCP and yield traits were moderate to low, but favorable as shorter RCT and firmer curd were associated to increased yield traits.
Conclusions
Genetic variation for MCP predicted by MIRS exists and can be exploited to improve RCT and a30 in dairy cows. Genetic correlations of MCP with production traits, milk composition, SCS, pH, C : P and P : F were generally low, except for the relationship of a30 with PP and CP. Overall, milk quality traits measured during routine data collection did not provide a valuable tool to predict MCP nor to enhance the accuracy of breeding value estimation. An exception is represented by PP and CP, which could be included as correlated traits in the estimation of breeding values for a30.
Ackowledgments
The authors thank the laboratory of the Breeders Association of Veneto region (Padova, Italy) for providing data and the Italian Holstein Friesian Cattle Breeders Association (ANAFI, Cremona, Italy) for pedigree information. The first author gratefully acknowledges the European Social Fund (FSE) for financing the research scholarship.
Authors’ contribution
F. Tiezzi performed the statistical analyses and wrote the first draft of the manuscript. D. Pretto and M. Penasa were involved in drafting the paper. M. De Marchi and M. Cassandro designed the research. All authors contributed to the interpretation and discussion of the results.