I. INTRODUCTION
High-entropy alloys (HEAs) were proposed in 2004, which were composed of five elements or more than five elements with the moral ratio varying from 5 to 35%.Reference Yeh, Chen, Lin, Gan, Chin, Sun, Tsau and Chang1 Some of the HEAs possess high strength, excellent wear resistance, corrosion resistance, oxidation resistance, high elevated-temperature resistance, good high temperature creep resistance, and soften resistance.Reference Zhang, Liaw and Zhang2–Reference Tong, Chen, Yeh, Lin, Chen, Shun and Chang12
However, it is still a challenge to prepare a HEA with high strength and high ductility simultaneously. Furthermore, most HEAs usually suffer from inferior liquidity, castability, and compositional inhomogeniety due to the high concentration of the multiple elements.Reference Lu, Dong, Guo, Jiang, Kang, Wang, Wen, Wang, Jie, Cao, Ruan and Li13–Reference Lu, Gao, Jiang, Chen, Wang, Jie, Kang, Zhang, Guo, Ruan, Zhao, Cao and Li15 To overcome these shortcomings of the HEAs, Lu et al.Reference Lu, Dong, Guo, Jiang, Kang, Wang, Wen, Wang, Jie, Cao, Ruan and Li13 first proposed the design concept of eutectic high-entropy alloys (EHEAs). Using the novel EHEAs concept, the fine homogeneous high-quality industrial scale ingots with excellent castability, high fracture, and high ductility could be obtained. The AlCoCrFeNi2.1Reference Lu, Dong, Guo, Jiang, Kang, Wang, Wen, Wang, Jie, Cao, Ruan and Li13,Reference Lu, Gao, Jiang, Chen, Wang, Jie, Kang, Zhang, Guo, Ruan, Zhao, Cao and Li15,Reference Gao, Lu, Zhang, Liang, Wu, Sha, Liu and Zha16 EHEA exhibits high tensile ductility and high fracture strength at room cryogenic and elevated temperature. Moreover, the (Zr0.6,Nb0.74,Hf0.55,Ta0.65)CoCrFeNi2.0,Reference Lu, Jiang, Guo, Wang, Cao and Li17 Nb25Sc25Ti25Zr25,Reference Rogal, Morgiel, Świątek and Czerwiński18 CoCrFeNiNbχ,Reference Jiang, Jiang, Qiao, Lu, Wang, Cao and Li14,Reference He, Wang, Shang, Leng, Li and Wang19,Reference He, Wang, Cheng, Wang, Li, Dang, Wang and Liu20 and AlCoCrFeNiNbχReference Ma and Zhang21 EHEAs have been reported for their excellent strength and ductility. Compared with the eutectic alloy, the hypoeutectic HEAs (HEHEAs) demonstrate much more superiority. The hypoeutectic Sn–6.5Zn alloy exhibits better applications than the eutectic alloy.Reference El-Daly, Desoky, Saad, Mansor, Lotfy, Abd-Elmoniem and Hashem22 Moreover, a previous study has found that the temper brittleness is rarely occurred in the HEHEAs, which is determined by the composition segregation in the phase interface.Reference He, Wang, Shang, Leng, Li and Wang19 The HEHEAs possessed the proeutectic phase and eutectic phase.
Moreover, the anticorrosion property of HEHEAs is worth to wait due to the less interfaces than eutectic alloys.Reference Wang, Nie, Wang, Wang and Gao23–Reference Osório, Peixoto, Canté and Garcia25 The Nb element has been reported as a beneficial factor in corrosion behavior in many alloy systems. The alloyed Nb (1–2 wt%) in Ni–25Cr–Fe has a positive impact in oxidation resistance.Reference Xu, Lu, Yang, Yan and Li26 Ni–Ti–Nb alloys showed higher open circuit potentials (OCPs), higher corrosion potentials, and lower corrosion current density than Ni–Ti alloys.Reference Li, Li, Huang, Gibson, Zheng, Liu, Sun and Fu27 Nb significantly increased the repassivation value from −0.315 to 0.840 V in Ti–Ni–Cu–Nb alloys.Reference Lethabane, Olubambi and Chikwanda28 However, the effect of the Nb element on corrosion behavior of CoCrFeNiNbχ HEHEAs is not clear. In the present work, CoCrFeNiNbχ (χ = 0.15, 0.3, 0.45) HEHEAs were prepared. The stability of the Laves phase at elevated temperature, mechanical properties, and corrosion resistance of CoCrFeNiNbχ were investigated.
II. MATERIALS AND METHODS
The CoCrFeNiNbχ alloys were prepared by the vacuum-arc-melting method in a Ti-getter argon atmosphere. All the constituent elements which were used as raw materials have a purity of 99.9 wt%. To ensure chemical homogeneity, the ingots were melted more than 5 times. The samples were annealed at temperatures of 500 and 800 °C for 12 h and quenched in water, respectively. The crystal structure of the as-cast samples was analyzed by X-ray diffraction (XRD). The microstructure of the samples was characterized by using a scanning electron microscope (SEM; SE-4800). The samples were corroded after polishing by choosing a mixing solution HNO3 and HCl (1:3, vol%) as an etching solution. The chemical compositions of the samples were analyzed on an energy dispersive spectrometer. Nanoindentation experiments were performed at room temperature (RT), using a Hysitron Triboindenter (TI-900; Hysitron, Eden Prelli, Minnesota) equipped with the in situ atomic force microscope. The two different phases were identified through the optical microscope equipped on the Triboindenter. To obtain the typical load–displacement (P–h) curves, the maximum load, the loading rate, and the fixed holding time were 6000 μN, 1000 μN/s, and 2 s, respectively. The incipient plasticity was probed by measuring the first pop-in behavior in the loading segment of the (P–h) curves under a maximum fixed load of 1000 μN and a constant rate of 50 μN/s. The thermal draft was maintained below 0.05 nm/s among the whole experiments. The hardness was measured with a Vickers hardness tester under a load of 500 g for 10 s. The RT compressive test was carried out on Ø 3 × 6 mm samples with a strain rate of 1.8 × 10⁻³ s−1 using a material testing machine (INSTRON 5982, Instron, Boston, Massachusetts). Potentiodynamic polarization and electrochemical impedance spectroscopy (EIS) experiments were conducted using a CHI660E workstation (CH Instruments, Shanghai, China). Electrochemical tests were conducted in 3.5 wt% NaCl solution at RT. Tests were carried out using a three-electrode system with a saturated calomel electrode (SCE) as the reference electrode, a platinum sheet as the auxiliary, and the measured samples as the working electrode. The samples were allowed to corrode freely for 20 min until reaching a steady value as the OCPs. The surface area of the working electrodes was 10 × 10 mm. The potentiodynamic polarization tests were performed with a scan rate of 5 mV/s, and the EIS tests were carried out at the OCP with the amplitude of 10 mV, running from 10−2–105 Hz.
III. RESULTS
A. Structure of the CoCrFeNibχ (χ = 0.15, 0.3, 0.45) HEHEAs
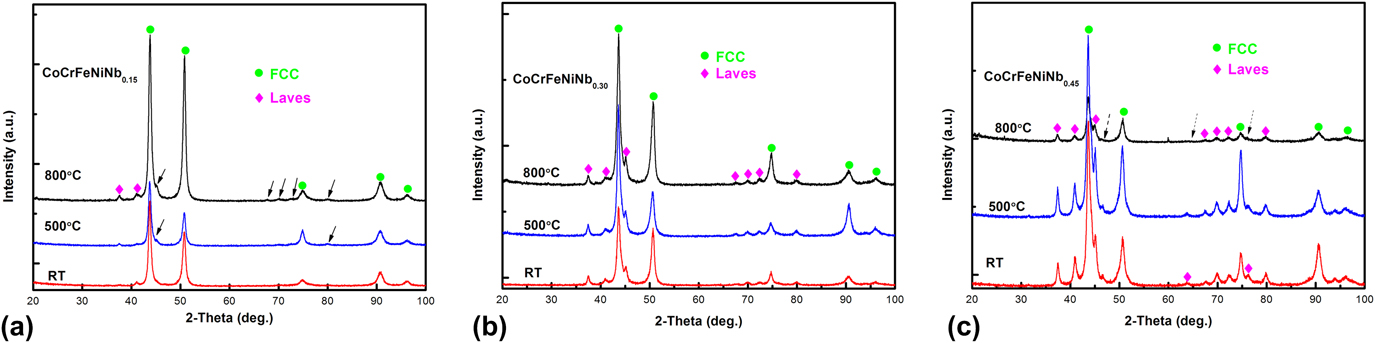
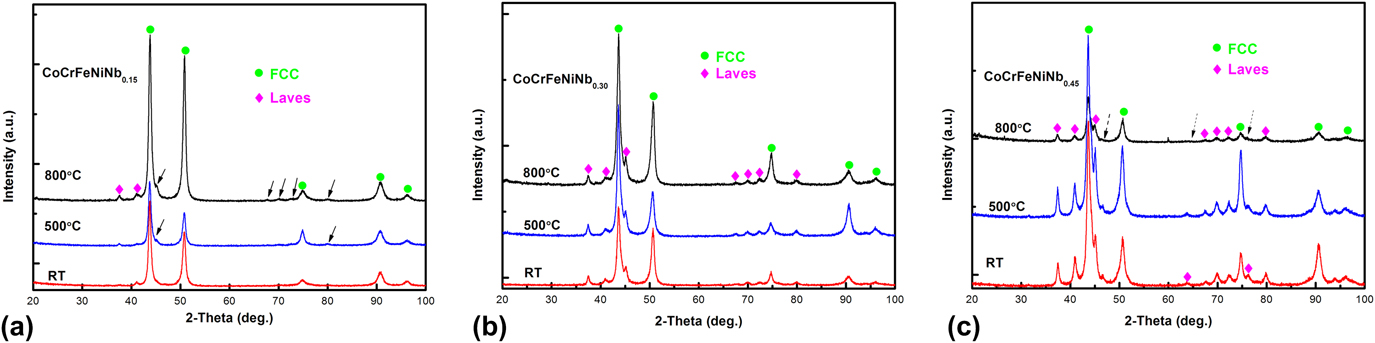
The XRD patterns of the CoCrFeNibχ alloys are shown in Fig. 1. XRD analysis indicated the presence of the FCC and Laves phase in the CoCrFeNib0.15 alloy [see Fig. 1(a)]. The Nb-rich Laves phase was reported as a hexagonal crystal structure in Ref. Reference He, Wang, Shang, Leng, Li and Wang19. There are some tiny diffraction peaks from the Nb-rich Laves phase appeared after annealing in the CoCrFeNib0.15 alloy. The XRD patterns of the CoCrFeNib0.3 alloy are shown in Fig. 1(b). In addition to the diffraction peaks in the CoCrFeNib0.15 alloy, more tiny peaks from the Nb-rich Laves phase are found in the CoCrFeNib0.3 alloy. However, the FCC and the Laves phases are not significantly affected by annealing. The XRD patterns of the CoCrFeNi Nb0.45 alloy are shown in Fig. 1(c). The XRD patterns of resulting CoCrFeNiNb0.45 are similar to that of the CoCrFeNiNb0.3 alloy, but the intensity of diffraction peaks from the Laves phase is significantly higher. However, when annealed above 800 °C, some of the diffraction peaks from the Laves phase disappeared. Meanwhile, the intensity of other diffraction peaks from the Laves phase was lower.
XRD patterns of the as-cast and annealed CoCrFeNiNbχ HEAs at 500 and 800 °C: (a) CoCrFeNiNb0.15, (b) CoCrFeNiNb0.3, (c) CoCrFeNiNb0.45, The solid arrow is used to indicate the new formed phase, and the dotted arrow is used to indicate the disappeared phase.
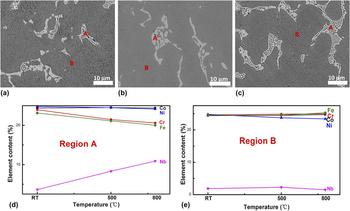
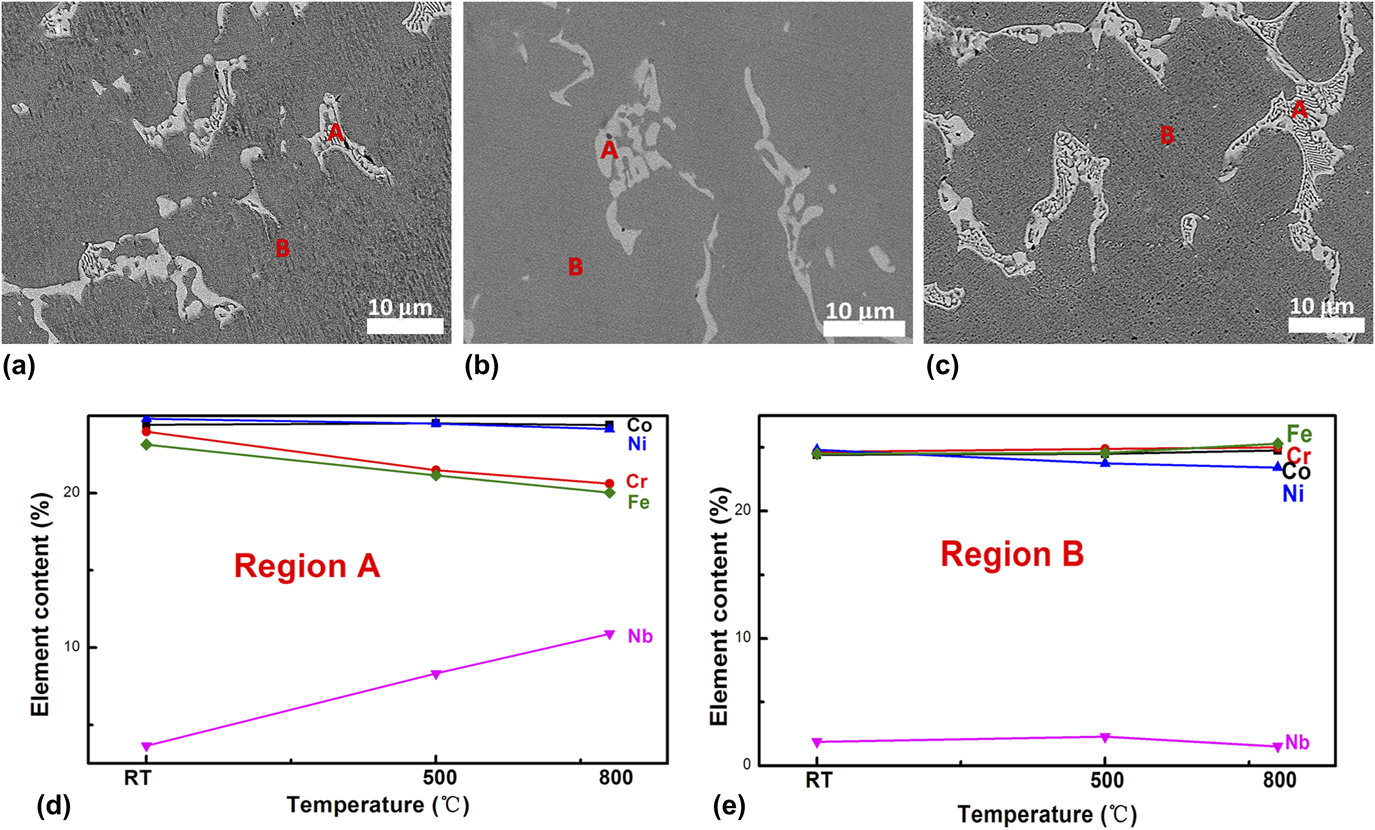
The microstructure and the variation of each constituent element of CoCrFeNib0.15 HEHEAs after annealing are shown in Fig. 2. The results of Figs. 2(a)–2(c) showed that the lamellar structure (region A) increased after annealing. The results of Figs. 2(d) and 2(e) showed that the lamellar structure region (region A) is Nb-enriched compared with the other region (region B). With the increased temperature, the content of the constituent element in region A experienced a huge variation compared with region B. After annealing, the content of Nb in region B is still very low. The primary phase with FCC structure is in region B, while the two-phase (FCC and Laves phase) eutectic structure is in region A.
(a) SEM image of the as-cast CoCrFeNiNb0.15, (b) SEM image of the CoCrFeNiNb0.15 annealed at 500 °C, (c) SEM image of the CoCrFeNiNb0.15 annealed at 800 °C, (d) variation of constituent elements at the as-cast and annealed states in region A, and (e) variation of constituent elements at the as-cast and annealed states in region B. The proeutectic phase is marked as B, and region A is eutectic.
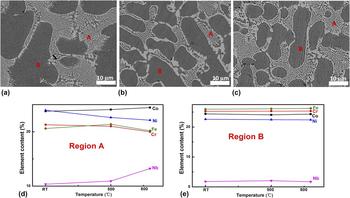
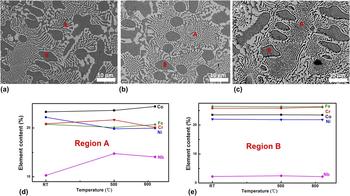
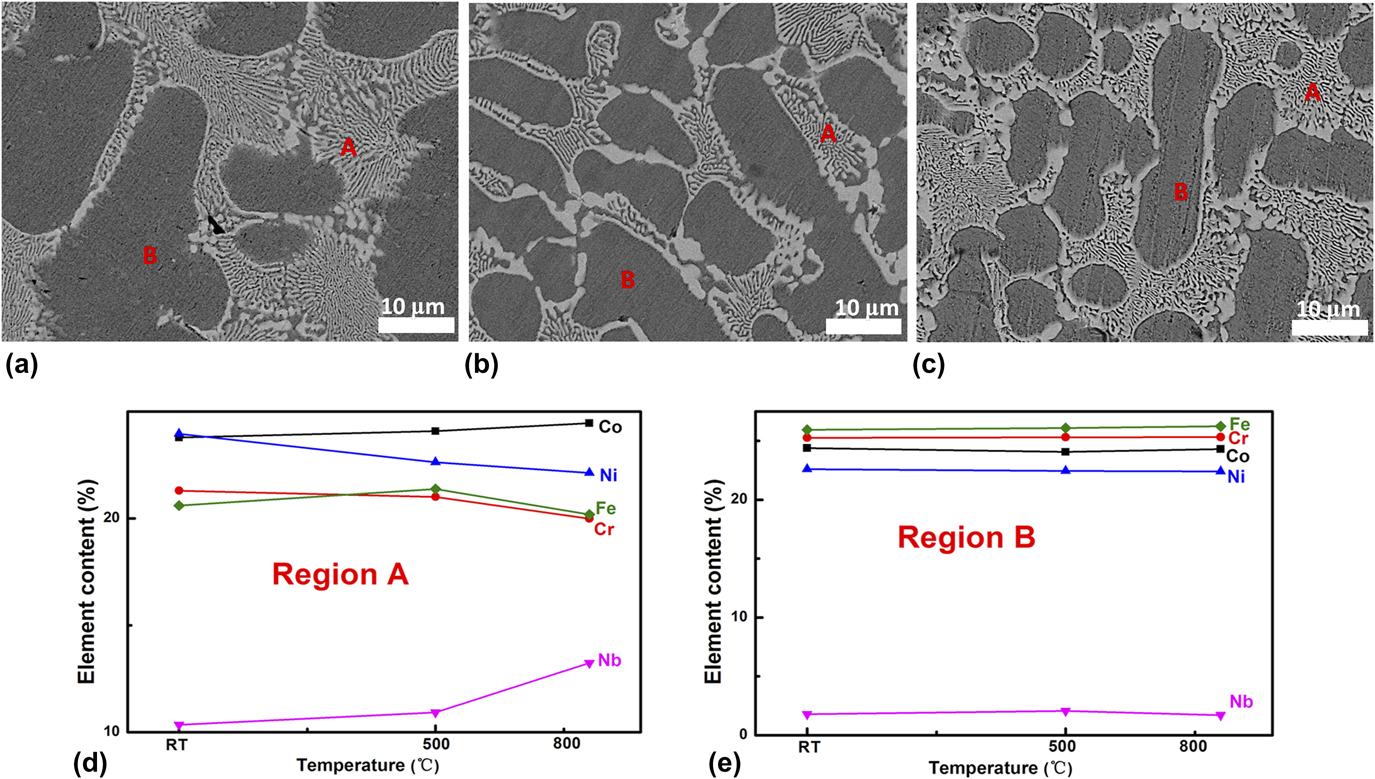
The microstructure and the variation of each constituent element of CoCrFeNib0.3 and CoCrFeNib0.45 HEHEAs after annealing are shown in Figs. 3 and 4, respectively. The lamellar structure in CoCrFeNib0.3 HEHEA experienced a more uniform dispersion after annealing. The contents of constituent elements in region A changed heavily compared with region B, as shown in Fig. 3.
(a) SEM image of the as-cast CoCrFeNiNb0.3, (b) SEM image of the CoCrFeNiNb0.3 annealed at 500 °C, (c) SEM image of the CoCrFeNiNb0.3 annealed at 800 °C, (d) variation of constituent elements at the as-cast and annealed states in region A, and (e) variation of constituent elements at the as-cast and annealed states in region B. The proeutectic phase is marked as B, and region A is eutectic.
(a) SEM image of the as-cast CoCrFeNiNb0.45, (b) SEM image of the CoCrFeNiNb0.45 annealed at 500 °C, (c) SEM image of the CoCrFeNiNb0.45 annealed at 800 °C, (d) variation of constituent elements at the as-cast and annealed states in region A, and (e) variation of constituent elements at the as-cast and annealed states in region B. The proeutectic phase is marked as B, and region A is eutectic.
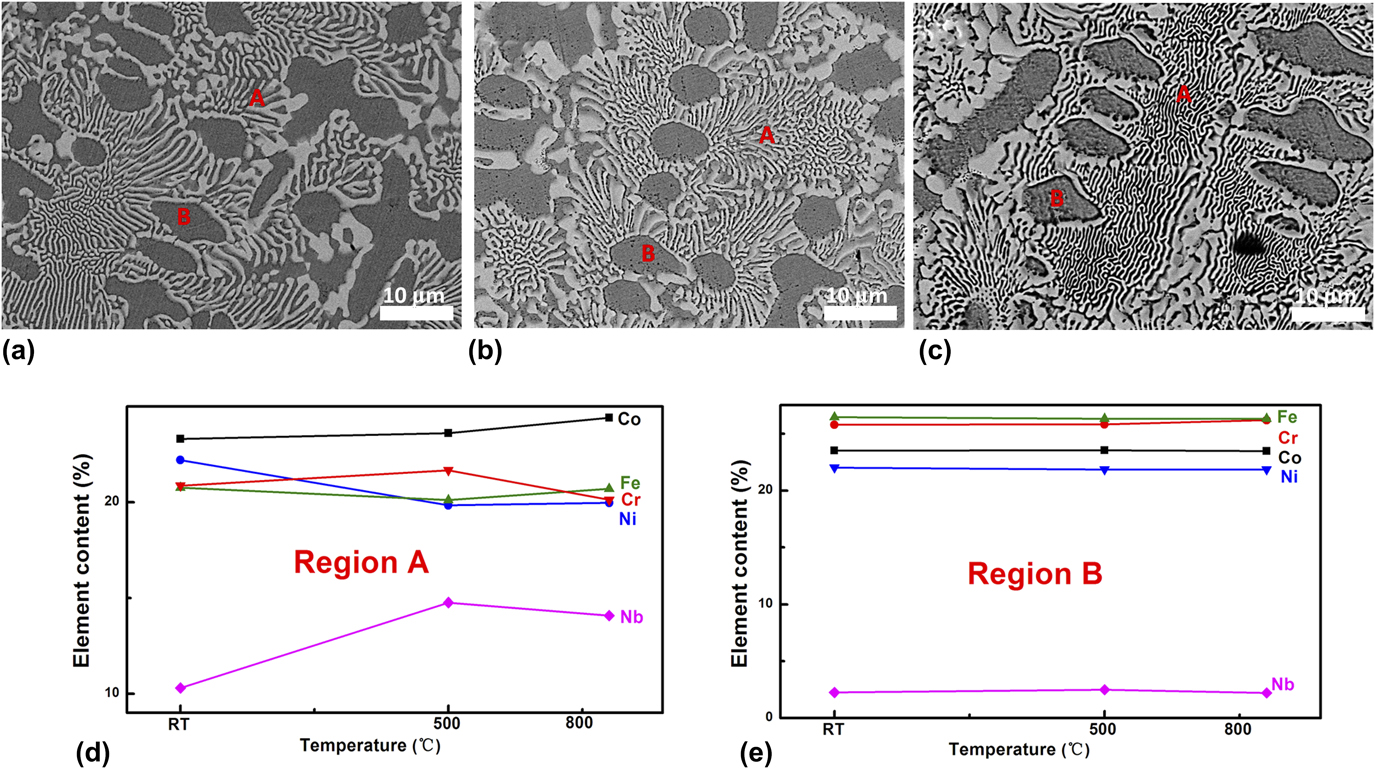
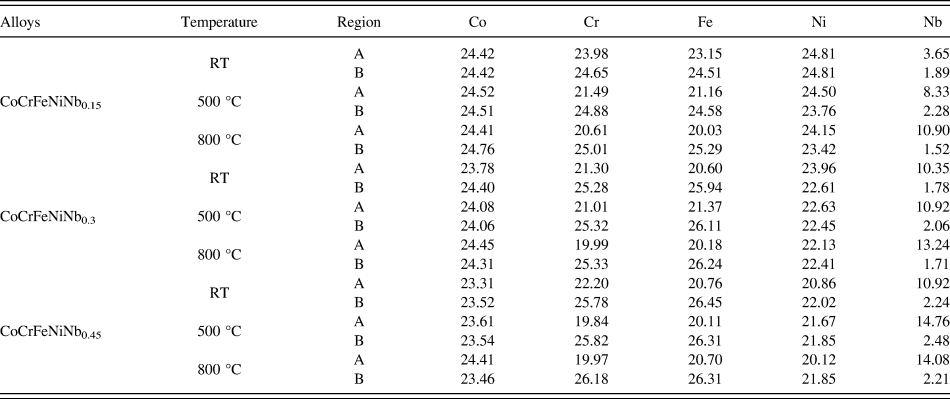
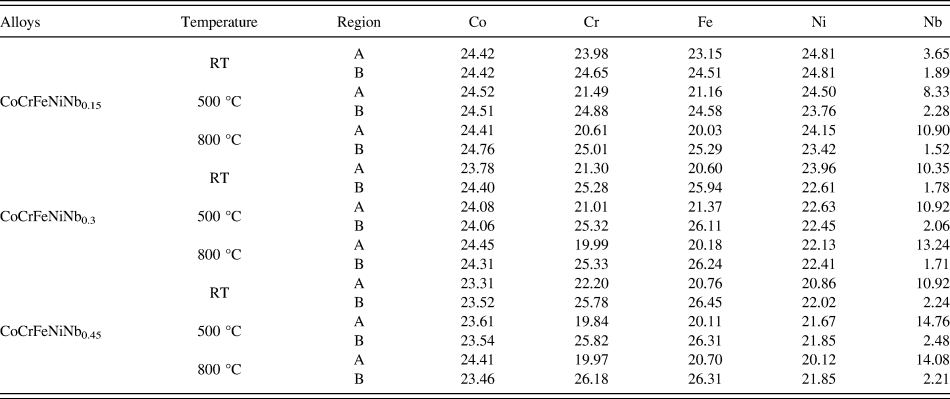
The results in Fig. 4 showed that the lamellar structure increased after annealing at 500 °C. However, part of the lamellar structure coarsened after annealing at 800 °C. Comparing Figs. 2, 3, and 4, it can be found that the formation of the lamellar structure in CoCrFeNibχ HEHEAs is related to the content of the Nb element and the annealing temperature. The content of constituent elements in region B nearly has no change compared with region A. Compositions of CoCrFeNibχ alloys are listed in Table I.
Chemical composition of the as-cast and annealed CoCrFeNiNbχ alloys (at.%).
B. Nanoindentation tests of CoCrFeNiNbχ HEHEAs
There are two things to be taken into consideration during the nanoindentation test.Reference Zhang, Yu, Zhang, Liu, Ma, Liaw, Li and Liu29 The first is that the maximum load should be selected to ensure the data is accurate. It is because that the nanoindentation test is very sensitive to the surroundings. When the width of the individual phase is small, the maximum load should be selected carefully to make sure that the plastic zone is smaller than the individual phase. In the present test, both the sizes of the eutectic structure and primary FCC (PFCC) phase in CoCrFeNiNb0.3 and CoCrFeNiNb0.45 are much bigger than 20 μm from the SEM images in Figs. 3 and 4, which are enough to assure that the deformation is limited to the phase under the maximum load of 5000 μN. And a maximum load of 4000 μN is performed on the CoCrFeNiNb0.15 alloy. And the second one to be noticed is the influence of varying the orientations of the indented phases on the nanoindentation tests should be considered. The measurement results of the CoCrFeNiNbχ system show that different orientations influence the nanoindentation results to a much lesser degree than the different crystal structure. And each data was obtained by the average of more than 20 measurements.
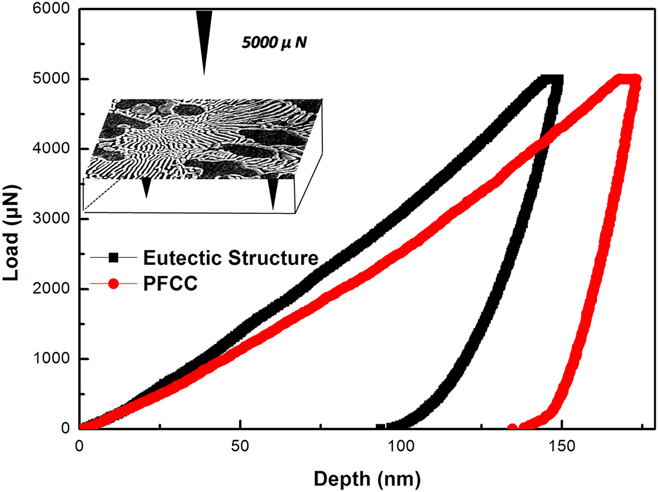
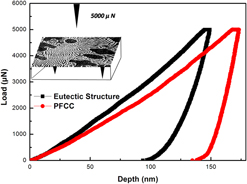
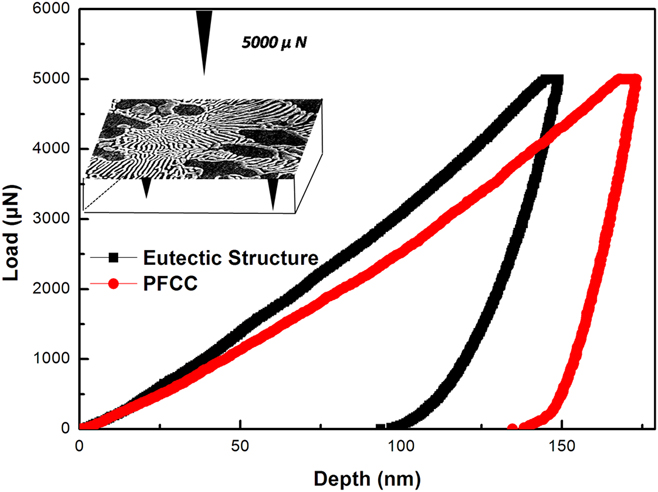
The typical P–h curves corresponding to the indentations into the PFCC phase and eutectic structure of CoCrFeNiNb0.3 alloys are shown in Fig. 5. It can be seen that the maximum penetration depth in the eutectic structure is 140 nm, which is much shallower than that in the PFCC phase. The results showed that the Laves phase is harder than the FCC phase. The inset of Fig. 5 is the schematic diagram of the performance of eutectic structure and PFCC phase under the nanoindenter.
Typical load–displacement (P–h) curves for nanoindentation within the PFCC phase and eutectic structure of CoCrFeNiNb0.3 HEA. Inset is the schematic diagram of the performance of the eutectic structure and PFCC phase under the nanoindenter.
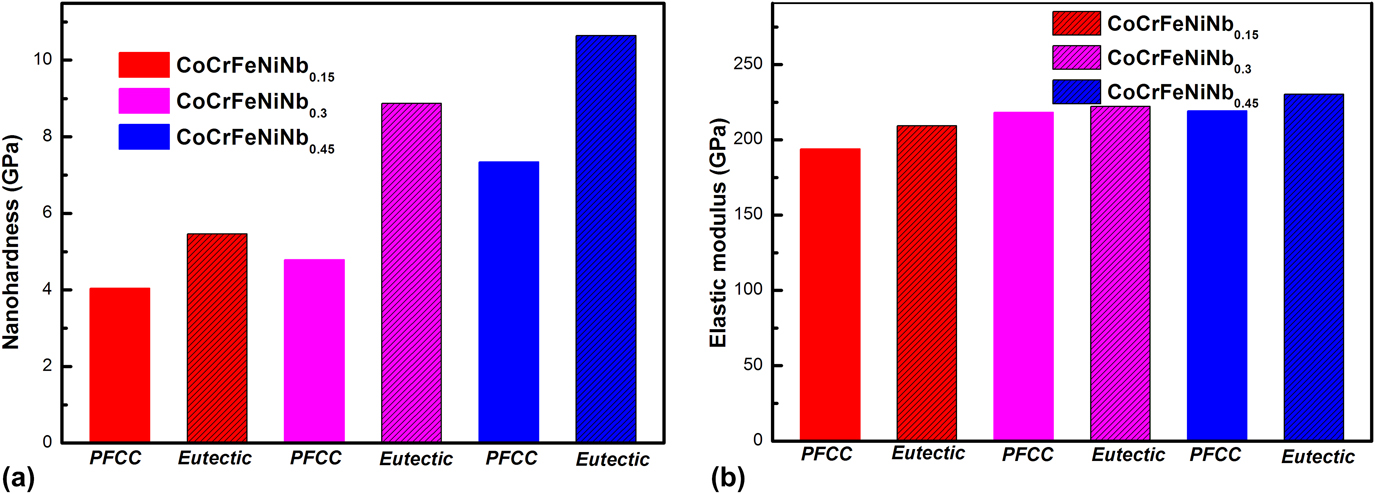
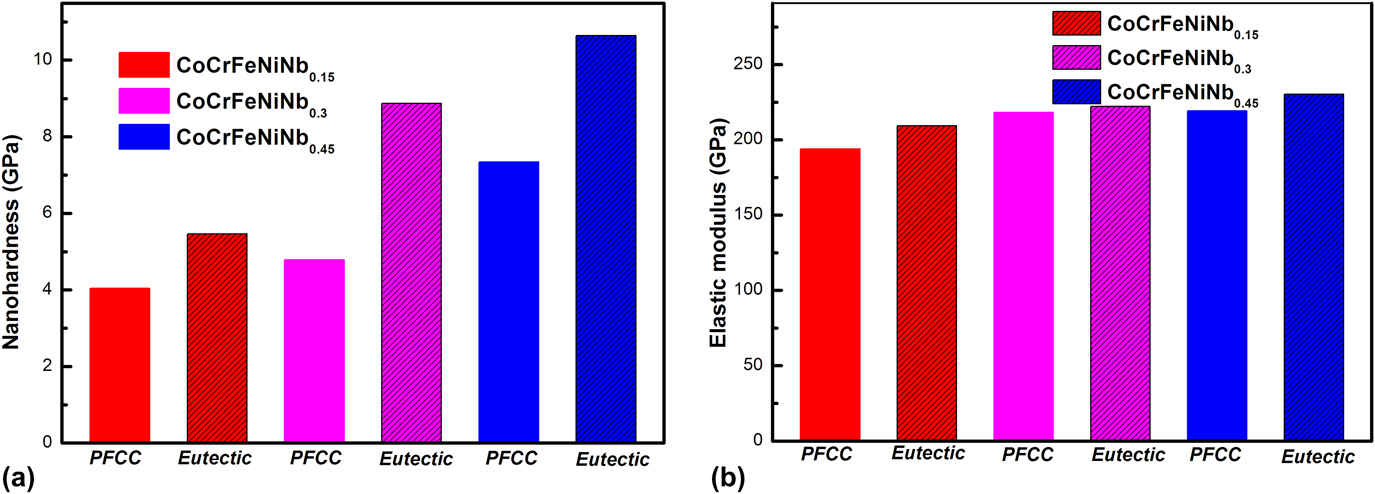
Both the nanohardness and elastic modulus of the PFCC phase and the eutectic structure of the CoCrFeNiNbχ HEAs are obtained according to the Oliver-Pharr method.Reference Oliver and Pharr30 The results of Fig. 6(a) showed that the nanohardness values of both the PFCC phase and eutectic structure are increased with increasing of Nb contents. However, compared with the PFCC phase, the nanohardness values in the eutectic structure is much bigger. The nanohardness values of PFCC phase and eutectic structure of CoCrFeNiNb0.45 are 10.4 GPa, and 7.2 GPa, respectively. The eutectic structure is 1.5 times harder than the PFCC phase. However, the fluctuation of elastic-modulus value between the PFCC phase and the eutectic structure is not obvious. The elastic-modulus values of the CoCrFeNiNbχ HEAs are shown in Fig. 6(b).
(a) Average nanohardness on different phases of CoCrFeNiNbχ HEAs. (b) Average elastic-modulus on different phases of CoCrFeNiNbχ HEAs.
C. Corrosion behaviors of CoCrFeNiNbχ HEHEAs
1. Potentiodynamic polarization results
For a variety of corrosion evaluation techniques, the electrochemical measurements are especially suitable for characterizing the corrosion property of many materials. The potentiodynamic polarization test is a very useful electrochemical technique.Reference Wang, Nie, Wang, Wang and Gao23,Reference Qvarfort31–Reference Shi, Yang, Xie, Brechtl, Dahmen and Liaw35 Corrosion potential (E corr) and the corrosion current density (i corr) were obtained by Tafel analysis. The E corr represents the potential of a material in the open circuit situation, and the i corr represents the corrosion rate of the material. A low i corr value means that corrosion occurred with a slow rate. Meanwhile, from the Tafel analysis, cathodic (βc) and anodic (βa) slopes could be calculated by deriving the fitting lines of the cathodic and anodic branches, respectively. Moreover, the passivation film is also a significant constant to measure the resistance of localized corrosion.Reference Qvarfort31
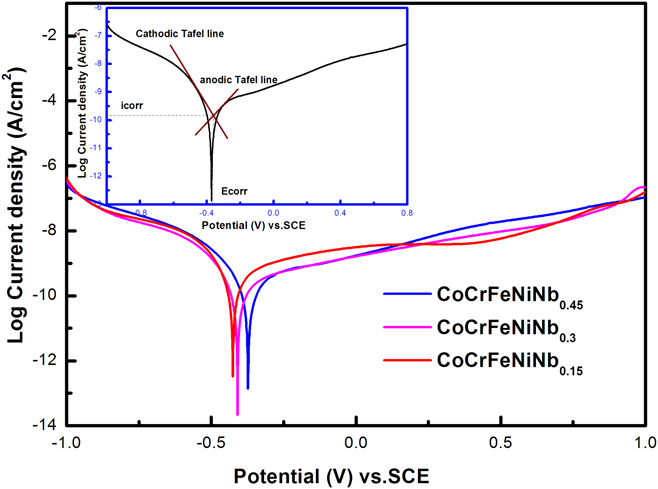
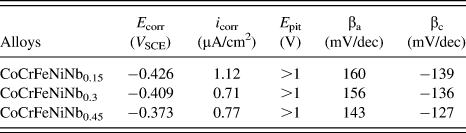
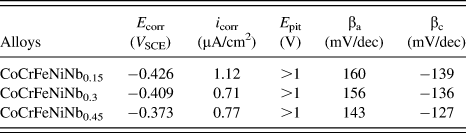
The polarization curves of the as-cast CoCrFeNiNbχ alloys with the scan rate of 5 mV/s in the 3.5 wt% NaCl solution are shown in Fig. 7. The inset is the calculation pattern of i corr, E corr, βa, and βc. The electrochemical parameters of CoCrFeNiNbχ are shown in Table II. From the polarization curves, it can be seen that the E corr increased while the i corr decreased with the increasing Nb content, indicating that the general corrosion resistance in the solution was enhanced. The CoCrFeNiNbχ alloys exhibited good general corrosion resistance due to the less phase interface in the hypoeutectic structure.Reference He, Wang, Shang, Leng, Li and Wang19,Reference He, Wang, Cheng, Wang, Li, Dang, Wang and Liu20 In addition, pitting occurred at a relatively high potential with the increasing of Nb content, which also indicated a good resistance to localized corrosion.Reference Wang, Nie, Wang, Wang and Gao23,Reference Xu, Lu, Yang, Yan and Li26–Reference Lethabane, Olubambi and Chikwanda28
Potentiodynamic polarization curves of CoCrFeNiNbχ in the 3.5 wt% NaCl solution at RT. Inset is the Tafel extrapolation method which defined the Tafel slopes and the corrosion parameters.

Electrochemical parameters of CoCrFeNiNbχ.
2. EIS study
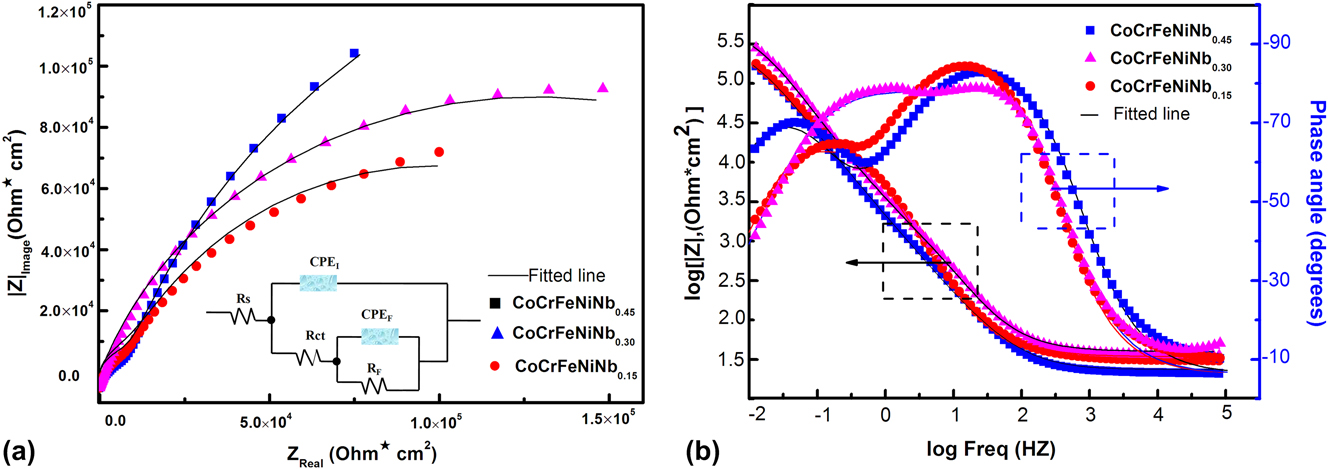
Electrochemical impedance is a powerful tool in studying corrosion behaviors, which provides some information about the electrochemical process that occurred on the surface.Reference Qvarfort31 The effect of Nb content on the Nyquist and Bode plots of CoCrFeNiNbχ alloys in 3.5 wt% NaCl solution at OCP is shown in Fig. 8. It can be seen that all semicircle arcs with centers depressed below x axis, and the diameter of the semicircle arcs depressed with the increasing of Nb content, as illustrated in Fig. 8(a). This type of diagram is usually thought as a mechanism of charge transfer on an inhomogeneous surface.Reference Muñoz, Antón, Guiñón and Herranz33,Reference Shi, Yang, Xie, Brechtl, Dahmen and Liaw35
(a) Nyquist and (b) Bode plots of CoCrFeNiNbχ alloys at OCP with the potential amplitude of 10 mV, in a range of 100 KHz to 10 mHz, in 3.5 wt% NaCl solution at RT, inset of (a) is the equivalent electrical circuit representative of the electrode interface of the CoCrFeNiNbχ alloy in the 3.5 wt% NaCl solution.
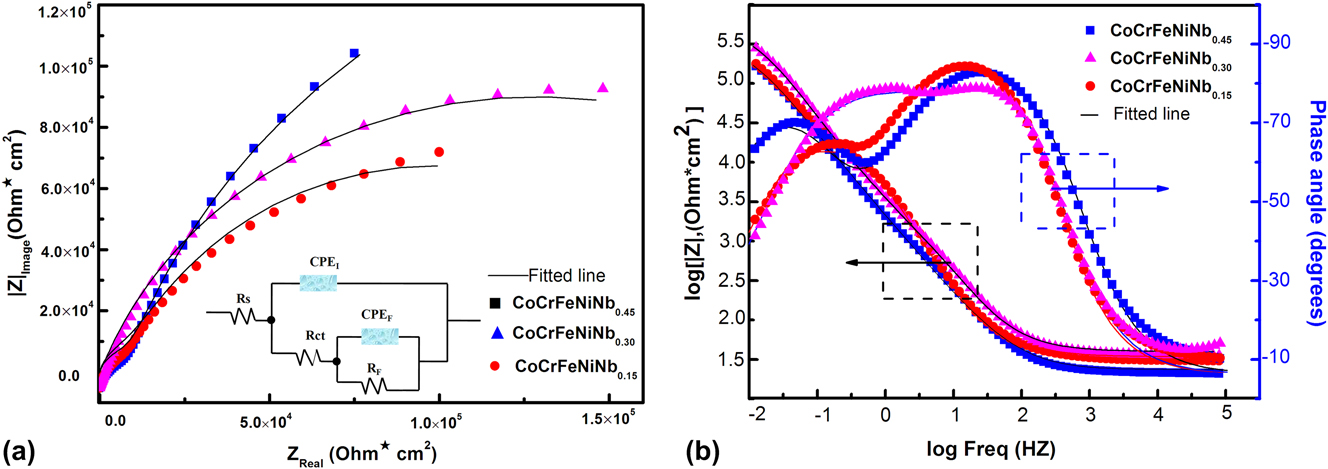
Two time constants are detected from the Bode plots, as shown in Fig. 8(b). One of the constants was in the low frequency range, and the other was in the medium-frequency range. The heterogeneous surface caused by defects and/or segregation of elements leads to two time constants.Reference Shi, Yang, Xie, Brechtl, Dahmen and Liaw35
An equivalent electrical circuit was designed to model the impedance spectra and is displayed in the inset of Fig. 8(a). The circuit was composed of resistance of the solution (R s), charge transfer resistance (R ct), the passive resistance (R F), capacitance of the passive layer (C F), and a double layer capacitance (C I) which characterized the charge separation between the metal and electrolyte interface. Considering the no-ideal behavior, a constant phase element (CPE) was introduced.Reference Ebenso34,Reference Shi, Yang, Xie, Brechtl, Dahmen and Liaw35 The CPE is defined in impedance and is given byReference Shi, Yang, Xie, Brechtl, Dahmen and Liaw35
 $${Z_{{\rm{CPE}}}} = X_0^{ - 1}{\left( {2\pi } \right)^{ - n}}{\left( {{\rm{i}}f} \right)^{ - n}}\quad ,$$
where X 0 is the proportional factor, i is the imaginary unit (i2 = −1), f is the frequency, and n is the CPE exponent. It will be different for varied n value. For n = 0, CPE represents resistance (R), whose value is  $X_0^{ - 1}$; for n = 0.5, CPE represents Warburg impedance (W); for n =1, CPE represents capacitance (C); and for n = −1, CPE represents inductance (L).Reference Shi, Yang, Xie, Brechtl, Dahmen and Liaw35
The simulated Nyquist plots of CoCrFeNiNbχ alloys in Fig. 8(a) fitted well with the experiment, which indicated that the suggested model is suitable for explaining the corrosion behavior of the alloys in 3.5 wt% NaCl solution at RT.
IV. DISCUSSION
A. Phase formation and stability
There are many formation rules and structural stability criteria for HEAs, which do not apply to all HEAs. ΔH mix (mixing enthalpy) and δ (atomic size difference) were proposed by Zhang et al.Reference Yang and Zhang36,Reference Zhang, Zhou, Lin, Chen and Liaw37
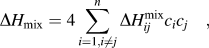 $$\Delta {H_{{\rm{mix}}}} = 4\sum\limits_{i = 1,i \ne j}^n {\Delta H_{ij}^{{\rm{mix}}}} {c_i}{c_j}\quad ,$$
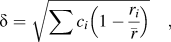 $$\delta = \sqrt {\sum {{c_i}\left( {1 - {{{r_i}} \over {\bar{r}}}} \right)} } \quad ,$$
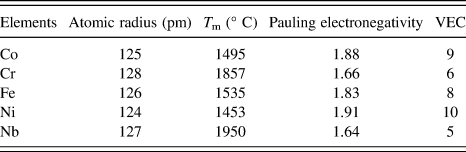
where c i or c j is the at.% of the ith or jth component;  $\Delta H_{ij}^{{\rm{mix}}}$ is the mixing enthalpy of the ith and jth components, r i is the atomic radius of the ith component, and
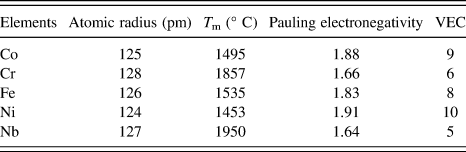
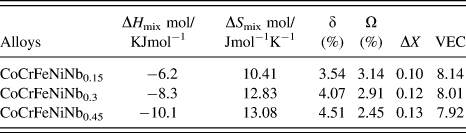
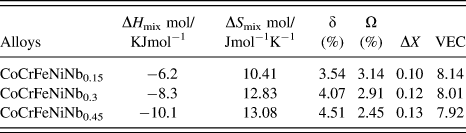
 $\bar{r}$ is the average atomic radius (in Table III). The values of ΔH mix and δ are listed in Table IV. From the results, it can be seen that the ΔH mix − δ criterion is suitable for the current CoCrFeNiNbχ. Furthermore, Yang and ZhangReference Yang and Zhang36 introduced a thermodynamic parameter Ω, and it is expressed as follows:
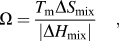 $$\Omega = {{{T_{\rm{m}}}\Delta {S_{{\rm{mix}}}}} \over {\left| {\Delta {H_{{\rm{mix}}}}} \right|}}\quad ,$$
where T m is the average melting temperature of the ith constituent element; ΔS mix is the mixing entropy of the constituent element. And they summarized a phase-formation rule using the Ω–δ criterion. When in the range of 1.1< Ω < 10, and δ > 3.8%, many HEAs may consist of solid solution and intermetallic phase or intermetallic phases only.Reference Yang and Zhang36,Reference Takeuchi and Inoue38–Reference Troparevsky, Morris, Daene, Wang, Lupini and Stocks40 The ΔS mix and Ω were calculated and are shown in Table IV. The results showed that the Ω–δ criterion did not fit with the CoCrFeNiNbχ alloys.
Atomic radius, melting temperature, and electronegativity of the constituent elements.Reference Shi, Yang, Xie, Brechtl, Dahmen and Liaw35,Reference Yang and Zhang36
ΔH mix, ΔS mix, δ, Ω, ΔX, and VEC of the CoCrFeNiNbχ.
Moreover, Dong et al.Reference Dong, Lu, Jiang, Wang and Li41 proposed ΔX (= 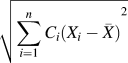 $\sqrt {{{\sum\limits_{i = 1}^n {{C_i}\left( {{X_i} - \bar{X}} \right)} }^2}}$, where X i is the Pauling electronegativity and
 $\bar{X}$ is the average Pauling electronegativity; see Table III) to predict the tendency for forming all types of TCP phases, including the Laves phase, δ phase, R phase, and μ phase and found that the TCP phases can form when the ΔX value reaches 0.133 and are stable at ΔX > 0.133. The ΔX of the CoCrFeNiNbχ system is listed in Table IV. The results show that the ΔX criterion also could not predict the formation of the Laves phase in the current CoCrFeNiNbχ alloys.
The valence electron concentration (VEC) is proposed by Guo et al. and Tsai et al.,Reference Troparevsky, Morris, Daene, Wang, Lupini and Stocks40,Reference Guo, Ng, Lu and Liu42 and they concluded that VEC > 8, FCC; VEC < 6.87, BCC; and 6.88 < VEC < 7.84, σ phase.Reference Tsai, Tsai, Tsai, Lee, Juan and Yeh43 The VEC is expressed as the following equation:
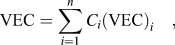 $${\rm{VEC}} = \sum\limits_{i = 1}^n {{C_i}{{\left( {{\rm{VEC}}} \right)}_i}} \quad ,$$
where VECi is the VEC of the ith constituent element (see Table III). The results (in Table IV) showed that the VEC rule failed to predict the formation of the Laves phase in the CoCrFeNiNbχ.
B. Incipient plasticity of the PFCC phase and eutectic structure
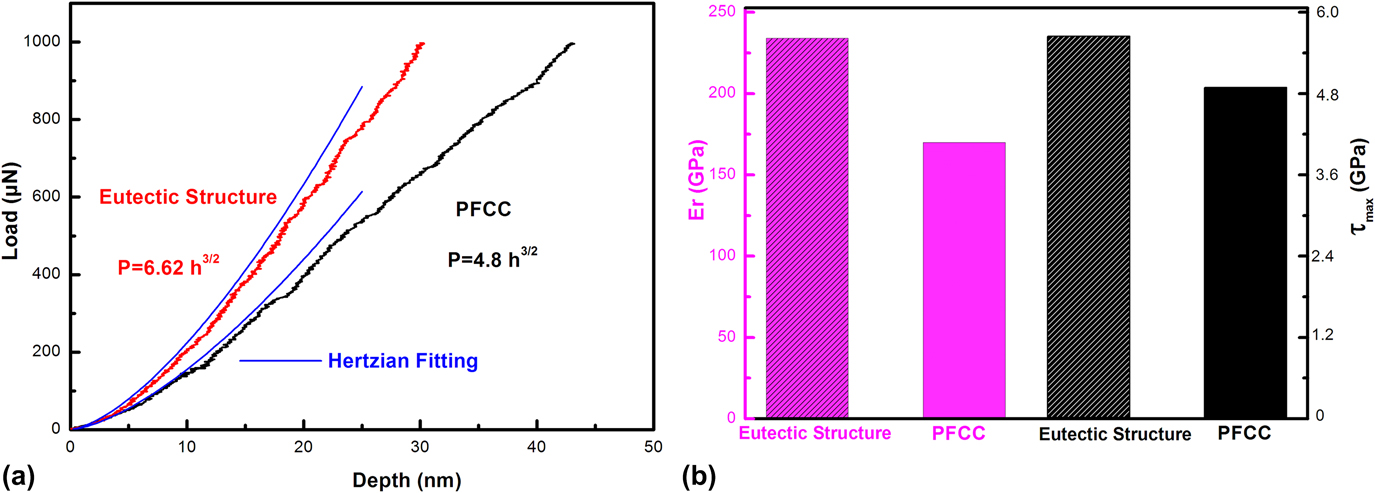
The first pop-in behavior represents the plastic yielding, which is controlled by the dislocation nucleation when the shear-stresses approach theoretical limits (G/30–G/5, where G is the shear modulus) under the indenter.Reference Zhang, Yu, Zhang, Liu, Ma, Liaw, Li and Liu29 To further investigate the effects of the crystal structure on the dislocation nucleation, the first pop-in (nanoindentation experiment) was performed on the PFCC phase and the eutectic structure of the CoCrFeNiNb0.3 alloy. The first pop-in, which could be a symbol to represent the elastic-to-plastic transition,Reference Zhang, Yu, Zhang, Liu, Ma, Liaw, Li and Liu29,Reference Catoor, Gao, Geng, Prasad, Herbert, Kumar, Pharr and George44 was the displacement burst in the P–h curves, as shown in Fig. 9(a).
(a) Typical first pop-in at the beginning of the P–h curves of the PFCC phase and eutectic structure of CoCrFeNiNb0.3 HEA obtained by nanoindentation. (b) Averaged reduced modulus and the maximum shear stress on the PFCC phase and eutectic structure of CoCrFeNiNb0.3 HEA.
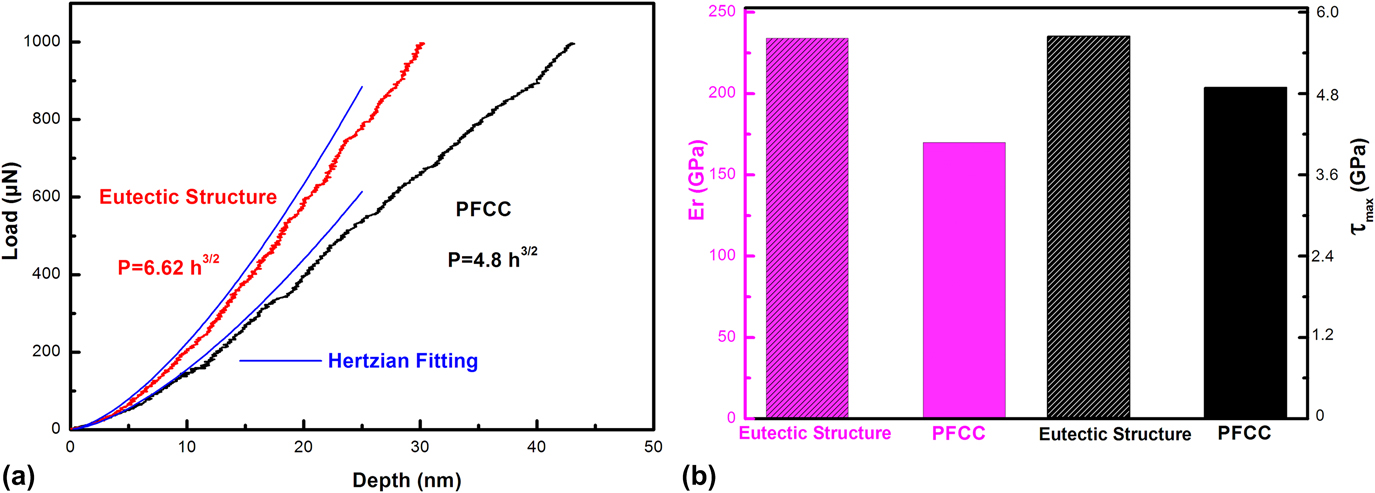
When the deformation occurred prior to the first pop-in, it is a purely elastic deformation. This elastic behavior could be described by the Hertzian constant theoryReference Zhang, Yu, Zhang, Liu, Ma, Liaw, Li and Liu29
 $$P = {4 / 3}{E_{\rm{r}}}{R^{{1 \over 2}}}{h^{{3 \over 2}}}\quad ,$$
where P is the indentation load, h is the indentation depth, R is the tip radius, and E r is the reduced modulus given by  ${E_{\rm{i}}} = {\left[ {{{\left( {1 - \nu _{\rm{i}}^2} \right)} / {{E_{\rm{i}}}}} + {{\left( {1 - \nu _{\rm{s}}^2} \right)} / {{E_{\rm{s}}}}}} \right]^{ - 1}}$, where νi, E i, νs, and E s are the Poisson’s ratio and Young’s modulus of the indenter, and Poisson’s ratio and Young’s modulus of the samples, respectively. The values of νi and E i are 0.07 and 1141 GPa, respectively. As shown in Fig. 9(a), the elastic segment of the first pop-in in the P–h curves of the PFCC phase and eutectic structure was fitted by using Eq. (6). The average values of the reduced modulus are shown in Fig. 9(b)
According to the Hertzian contact theory, the maximum shear stress, τmax, represents the critical shear yield strength for the origin of the plasticity. The τmax is demonstrated as followsReference Zhang, Yu, Zhang, Liu, Ma, Liaw, Li and Liu29:
 $${\tau _{\max }} = 0.31{P_0} = 0.31\left( {{3 \over 2}{P_{\rm{m}}}} \right) = 0.31{\left[ {\left( {{{6E_{\rm{r}}^2} / {{\pi ^3}{R^2}}}} \right)P} \right]^{{1 \over 3}}}\quad ,$$
where P 0 and P m are the maximum and mean contact pressure, respectively. The τmax on the PFCC phase and eutectic structure is calculated by Eq. (7), as shown in Fig. 9(b). The calculated τmax on the PFCC phase and eutectic structure was 4.76 GPa (corresponding to 1/15.9 G PFCC, where G PFCC is the shear modulus of the PFCC phase and could be estimated from Young’s modulus and Poisson’s ratio of the sample, and the value of G PFCC is 76.15 GPa) and 5.5 GPa (corresponding to 1/15.9 G ES, where G ES is the shear modulus of the eutectic structure, and the value of G ES is 80.38 GPa), respectively. The result of the first pop-in in CoCrFeNiNb0.3 alloys is close to that of the Gd0.2CoCrFeCuNi alloy.Reference Zhang, Yu, Zhang, Liu, Ma, Liaw, Li and Liu29 In this study, we found that when the applied stress exceeds τmax, dislocation nucleation can occur. So the dislocation nucleation for the PFCC phase occurs with a lower τmax than the eutectic structure, which can attribute to the lower activation energy for partial dislocations.Reference Wang, Bei, Li, Gao, George and Nieh45,Reference Ye, Lu and Nieh46 In comparison with the PFCC phase and eutectic structure in the CoCrFeNiNb0.3 alloy and HS phase in Gd0.2CoCrFeCuNi alloy, we could know that the activation energy of dislocation nucleation in the eutectic structure is the highest, followed by the HS phase and the PFCC phase. The reasons may not be single, such as the large atomic size difference, the phase difference, and so on.Reference Zhang, Yu, Zhang, Liu, Ma, Liaw, Li and Liu29,Reference Catoor, Gao, Geng, Prasad, Herbert, Kumar, Pharr and George44–Reference Ye, Lu and Nieh46
C. Effect of the Laves phase on mechanical properties of CoCrFeNiNbχ HEHEAs
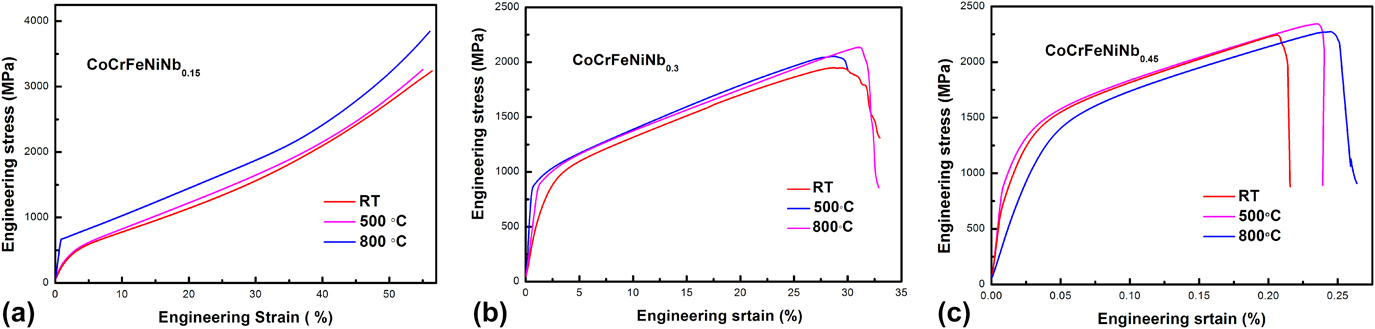
With the volume fraction of the Laves phase increased from ∼25% (CoCrFeNiNb0.15) to ∼68% (CoCrFeNiNb0.45), and the hardness value increased from 297 HV to 500 HV, respectively. Meanwhile the yield strength of the CoCrFeNiNb0.15, CoCrFeNiNb0.3, and CoCrFeNiNb0.45 is 300 MPa, 747 MPa, and 1115 MPa, respectively. Therefore, it can be expected that the Laves phase is a beneficial factor in increasing the yield strength (hardness). Strong strengthening by the Laves phase has been reported in the Cr–Nb–Ti–V–Zr system and AlCrxNbTiV system.Reference Senkov, Senkova, Miracle and Woodward47,Reference Stepanov, Yurchenko, Skibin, Tikhonovsky and Salishchev48 Due to the large scale and large volume fraction of the Laves phase, the CoCrFeNiNb0.15, CoCrFeNiNb0.3, and CoCrFeNiNb0.45 alloys could be treated as natural composites. In this case, the rule of mixture could be used to predict the whole strength of the alloy. The rule of mixture is written as followsReference Stepanov, Yurchenko, Skibin, Tikhonovsky and Salishchev48:
 $${\sigma _{{\rm{alloy}}}} = {\sigma _{{\rm{FCC}}}}{V_{{\rm{BCC}}}} + {\sigma _{{\rm{Laves}}}}{V_{{\rm{Laves}}}}\quad .$$
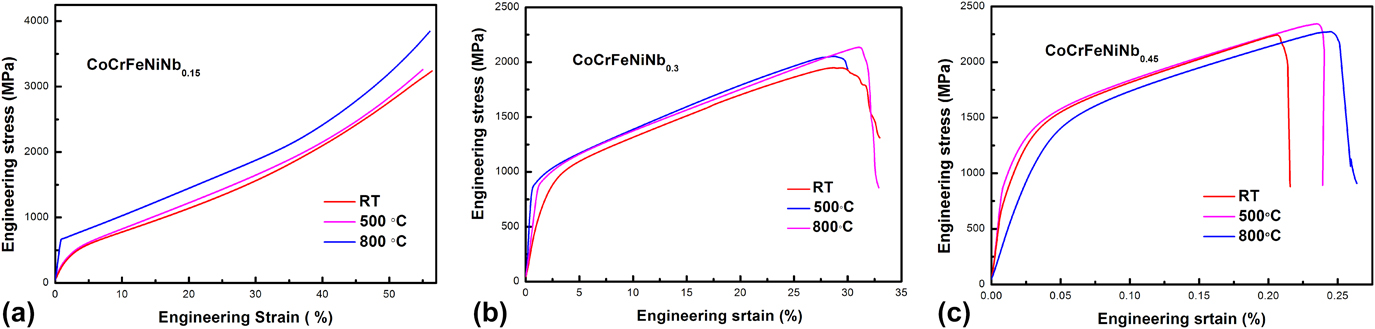
Using Eq. (8), the strength of the alloys with varied volume fraction of constitutive phases could be predicted. However, to obtain the strength of constitutive phases, the strength of each phase is required. The yield strength of the FCC phase, σFCC, could be referred in the previous study, and the yield strength of CoCrFeNi (∼136 MPa) could be used.Reference Shun, Chang and Shiu49 However, the yield strength of the Laves phase in CoCrFeNiNbχ alloys could not been found in the previous study. Stepanov et al.Reference Stepanov, Yurchenko, Skibin, Tikhonovsky and Salishchev48 proposed a method using the yield strength of AlCrxNbTiV alloys at various temperatures, which can roughly estimate the yield strength of the Laves phase. The compressive stress–stain curves of different temperatures are shown in Fig. 10. The volume fraction of different phases could be roughly calculated by software ImageJ. After calculation, the values of σLaves at RT, 500 °C, and 800 °C are 1833 MPa, 1641 MPa, and 1606 MPa, respectively. This result showed that the high yield strength of the Laves phase could be maintained at 800 °C, which is beneficial for the high elevated temperature strength of CoCrFeNiNbχ alloys. Furthermore, we can use Eq. (3) and the obtained σLaves to predict the strength of various Laves-contained alloys at different temperatures.
Compressive stress–stain curves of CoCrFeNiNbχ. (a) CoCrFeNiNb0.15, (b) CoCrFeNiNb0.3, and (c) CoCrFeNiNb0.45.
V. CONCLUSIONS
In this study, the microstructure, mechanical, and corrosion behaviors of CoCrFeNiNbχ (χ = 0.15, 0.3, and 0.45) HEHEAs were characterized. The formation and stability of the Laves phase and the effect of the Laves phase on mechanical properties were discussed. Based on the obtained results and analyses, tentative conclusions were as follows:
(1) The addition of Nb element into the CoCrFeNi HEA changed the original phase constitution and led to the formation of the Laves phase. The criteria (ΔH mix − δ, Ω–δ, and VEC) cannot effectively predict the formation of the CoCrFeNiNbχ. However, when 1% < δ < 6%, and ΔX < 0.133, the Laves phase formed. Furthermore, the Laves phase keeps instability when the temperature is higher than 800 °C.
(2) Nanoindentation measurements were carried out on the PFCC phase and eutectic structure. The nanohardness of the eutectic structure is 10.4 GPa, which is almost three times that of the PFCC phase. The first pop-in behaviors of the incipient plasticity on the eutectic structure and the PFCC phase demonstrated that the dislocation nucleation of the eutectic structure with the higher maximum shear stress of 5.5 GPa, which is harder than that of the PFCC phase with a lower maximum shear stress of 4.76 GPa.
(3) The minor Nb addition significantly improved the mechanical properties of the CoCrFeNiNbχ HEAs. The hardness increased from 297 to 500 HV with the increase of Nb content. At the same time, the yield strength increased from 300 to 1115 MPa.
(4) The potentiodynamic curves revealed that the lower Laves phase-contained alloy exhibited inferior corrosion behavior. The corrosion resistance increased with the increasing of Nb content. Meanwhile, the pitting corrosion resistance could be improved by a higher Nb content.
ACKNOWLEDGMENTS
G. Li acknowledges the Basic Research Project in the Hebei Province (Grant No. A2016203382) and the National Science Foundation of China (Grant No. 11674274).