


1. Introduction
Snow accumulates at the surface of most of the Antarctic ice sheet, at a mean rate of ∼15cma−lw.e. The net surface accumulation is the sum of several processes: solid precipitation, surface sublimation, melt followed by runoff, erosion by divergence of drifting snow transport and snowdrift sublimation. Some of these terms may make a negative contribution to the surface mass balance. Consequently, the net annual mean surface mass balance is negative over a small fraction of the Antarctic surface (Reference Van den Broeke, van de Berg, van Meijgaard and Reijmer.Van den Broeke and others, 2006) even though, because of compensating ice flow, the mean surface elevation does not change correspondingly. In such areas, ice is exposed at the surface for at least part of the year. Because this ice is very clean and has generally been submitted to significant compression it has a blueish hue. Thus, ice surface areas resulting from net mean ablation are often called blue-ice areas (BIAs). A review of Antarctic BIAs is provided by Reference BintanjaBintanja (1999). BIAs can be found at relatively high elevation (up to 2500 m) on the Antarctic ice sheet as a result of orographic features that favor warm, dry and windy conditions (katabatic flow, föhn effect). Such BIAs have been the subject of several studies (Reference JonssohnJonssohn, 1990;Reference Takahashi, Endoh, Azuma and Meshida.Takahashi and others, 1992;Reference Bintanja and ReijmerBintanja and Reijmer, 2001;Reference Sinisalo, Moore, van de Wal, Bintanja and Jonsson.Sinisalo and others, 2003) to analyze the meteorological components responsible for net ablation. BIAs also occur near the coast at sea level. The meteorological processes responsible for coastal BIAs may be significantly different from those for higher-elevation BIAs (e.g. because of a warmer environment and proximity to the sea). In particular, the relative contributions of melt vs sublimation are likely to be different even for BIAs where morphological evidence of runoff is minimal. Reference BintanjaBintanja (1999) suggests that BIAs are characterized by negligible melt and runoff, but whether this also applies to coastal BIAs remains to be confirmed, since coastal BIAs have not yet been as extensively studied as their interior counterparts (Reference BintanjaBintanja, 1999).
Although BIAs cover only a tiny fraction of the Antarctic surface (∼1%;Reference BintanjaBintanja, 1999), they are important for various reasons. Impurities accumulate because of ice ablation, and BIAs are known as meteorite material reservoirs (e.g. Reference MauretteMaurette and others, 1991). Ice may have been flowing for a long distance before outcropping at a BIA. Old ice can thus be recovered from the surface, although dating is generally a limitation to exploitation for paleoclimate studies (Reference Grinsted, Moore, Spikes and Sinisalo.Grinsted and others, 2003). From the point of view of Antarctic meteorology fundamentals, it is important to understand why BIAs occur while there is net accumulation elsewhere (including, in some cases, in the immediate vicinity). The surface mass balance of BIAs reflects meteorological parameters that are significantly different from those in accumulating areas. In the context of climate change, monitoring BIAs may yield information that is complementary to monitoring accumulation regions.
Here we present the monitoring and modeling of 2 years of snow/ice accumulation and ablation at a small coastal BIA near Cap Prudhomme in Terre Adélie (Fig. 1). The monitoring is carried out as a contribution to the GLACIOCLIM-SAMBA (GLACIOCLIM SurfAce Mass Balance of Antarctica). Antarctic surface mass-balance observatory (http://www-lgge.obs.ujf-grenoble.fr/∼christo/glacioclim/samba/). The net balance is the relative snow/ice surface elevation change as measured by stake emergence, accounting for snow density changes but not for ice flow. Here, accumulation and ablation have positive and negative contributions, respectively. To further evaluate the ablation processes, local meteorological observations are combined with meteorological analyses and short-term forecasts to feed a snow/ice energy- and mass-balance model that includes a wind erosion formulation. The various components of accumulation and ablation estimated from the model are presented, compared and discussed.
Satellite image (© SpotImage, with sea ¡ce partially covering the ocean) and map (courtesy Ph¡latél¡eTAAF) showing the Astrolabe region and glacier, Dumont d’Urville and Cap Prudhomme.

2. Accumulation/Ablation and Meteorology of the Cap Prudhomme Bia
2.1. The Glacioclim-Samba observatory at Cap Prudhomme
The main French coastal Antarctic station, Dumont d’Urville, is located on Petrels Island ∼5 km north of the edge of the ice sheet. Facing Dumont d’Urville, Cap Prudhomme (66°41’ S, 139°55’ E) is a small round cape, part of the ice sheet proper (Fig. 1). Cap Prudhomme hosts a small FrenchItalian summer station that is mainly used as a logistic facility for surface travel on the ice sheet to supply the French-Italian Concordia station ∼1100km inland at Dome C. A major ice-dynamic feature near Cap Prudhomme is Astrolabe Glacier which extends more than 5 km out to sea (Fig. 1). Surface elevation rises from ∼3Oma.s.l. near the coast to ∼250 m a.s.l. at a distance of 5 km inland (site D10; e.g. Reference Pettré, Pinglot, Pourchet and ReynaudPettré and others, 1986). The steepest slope reaches ∼10%, within 1 km of the coast (Fig. 2). This area is generally characterized by blue ice at the surface for at least part of the summer, and often also in winter, showing that the annual mean surface mass balance is negative. However, positive annual mean accumulation is almost always observed at D10 (Pettre and others, 1986). Between 1 and 5 km from the coast the sign of the mean surface mass balance is variable from one year to the next.
In late January 2004, 47 stakes were inserted in the ice to survey the accumulation and ablation in the steeper slope area (Fig. 2). The stake network covers ∼700m × 800 m. Two lines of stakes extend approximately across the steepest elevation gradients, the extreme stakes of which mark the east (stake 1), south (stake 15), north (stake 16) and west (stake 30) corners of the network. The network is completed by a transverse line of stakes roughly along the 70 m elevation isoline. The stakes are surveyed several times each year, weather and field conditions permitting. From 2 February 2004 to 4 February 2006, the network was fully or partially surveyed 25 times, including 11 times outside the November-February summer season. The stakes are series of wooden sticks buried in the ice using a steam probe. Once buried, vertical movement with respect to the ice is, in principle, prevented, so monitoring the emergence of the stakes with respect to the surface yields the net surface accumulation or ablation. Global positioning system (GPS) surveys indicate that ice flow is very slow (<1 ma−1). Because most accumulation events occur in winter when snow density measurements are impractical due to logistical limitations, here accumulation and ablation are reported as relative surface elevation (in centimeters of snow or ice) instead of water equivalent.
A local automatic weather station (AWS) was set up in January 2005 (Fig. 2) and has run almost continuously since. To insure long-term unattended operation, the station was anchored on a rock outcrop near the lower part of the BIA rather than on the ice. Temperature and relative humidity are reported by a Vaisala HMP45C thermohygrometer. Wind is measured with a Young 05103 aerovane. Both instruments are on top of a 4m mast which itself sits ∼6m above the nearest snow/ice surface. Downwelling solar and thermal radiation are also monitored using a Kipp–Zonen CNR1 radiometer (CM3 pyranometer, CG3 pyrgeometer). Upwelling radiation from the ice surface is not currently monitored continuously. A CNR1 radiometer was occasionally deployed on the ice in summer to evaluate the surface albedo. Because there is no proven way to monitor precipitation in the harsh environment of coastal Terre Ade´lie, no measured precipitation data are available.
A World Meteorological Organization weather station is operated by Météo-France at Dumont d’Urville. The station provides temperature, moisture and wind records, as well as global solar radiation. It provides information on precipitation events but not quantities. Time sampling is standard for operational meteorology (every 3–24 hours) so less frequent than the AWS at Cap Prudhomme (every 30 min). In addition, although Dumont d’Urville is only 5 km away, there are concerns that the differences in the nearby environment (island vs ice-sheet coast) may induce significantly different meteorology, in particular with respect to katabatic winds. Nevertheless, the typical meteorology at Dumont d’Urville (Konig-Langlo and others, 1998), including frequent strong winds and occasional above-freezing temperature in summer, is also characteristic of the coastal ice sheet. This is confirmed by data from the AMRC (Antarctic Meteorological Research Center, http://amrc.ssec.wisc.edu/ aws.html) AWS at D10. Unfortunately, over the time period of interest here, the D10 AWS has produced few or no suitable data.
Elevation (m), stake distribution, location of the AWS and outline of the moraine outcrop (see section 5) on the Cap Prudhomme BIA.

2.2. Observatory data
Although blue ice has long been known to exist near Cap Prudhomme (Reference MauretteMaurette and others, 1991), no accurate evaluation of the rate of ablation is yet available. Figure 3 shows a shift of the relative surface elevation change due to accumulation and ablation, at ten stakes measured during all 25 surveys. Not all stakes can always be monitored due to occasional burial in snow, bad weather, difficult access, etc. Although the temporal structure has strong similarities across all stakes, spatial variability within the network is high. While the ten stakes show net overall cumulated ablation over the full period, the ablation ranges from 7 to 90cm. Standard principal components analysis (PCA) is used to extract the part of the relative surface elevation series which is most common to all 47 stakes and to interpolate missing reports. Figure 4 shows the spatial distribution of weights for the first three components, which together account for 82% of the total temporal variability. The first component (45%) shows a homogeneously ablating pattern (weights only describe spatial patterns and signs do not necessarily reflect the sign of the relative surface elevation change). Accumulation occurs only in the eastern corner of the network, probably due to the proximity of rock outcrops that stop blowing snow. The second component (28%) shows a more spatially contrasted picture, with accumulation not only in the east but also in the south and north. This is confirmed by other field evidence, including whether there is any exposure of ice at the surface in summer. As already reported, there is a fairly narrow transition between ablation near the coast and accumulation further inland in this area, and the tendency towards less ablation southward is not unexpected. Again, topographic features affecting local meteorology are probably responsible for the aspects of the pattern that are less straightforward to interpret. Although the third component (9%) still shows an accumulating contribution in the east of the network, it is less spatially consistent than the two first components, probably reflecting an increasing contribution of random noise (sastrugi, missing data, errors in surveys, etc.). Beyond the third each component accounts for <4% of the total variability and they are thus considered insignificant.
Relative surface height observed at ten stakes in the Cap Prudhomme stake network. Year labels on the x axis (2004, 2005, 2006) mark the beginning (1 January) of each year.

Spatial pattern of the three first components (empirical orthogonal functions (EOFs) from left to right) from PCA of the surface accumulation and ablation in the Cap Prudhomme stake network. The same arbitrary weight unit applies to all three EOFs.

Relative surface elevation change due to accumulation and ablation, from the Cap Prudhomme stake network, obtained by recombining the time series of the three first EOFs shown in Figure 4. The circles show the survey data. Gray horizontal bars highlight the summer period (December to February) of each year.

The mean surface accumulation and ablation over the stake network is reconstructed from the three first components of the PCA. Figure 5 shows the resulting time series, with the actual surveys shown as circles. The cumulated ablation between 26 January 2004 and 4 February 2006 is 35.6cm. Interpolating between the last two surveys to fit with the period covered by the simulation (section 4), the cumulated net ablation is 33 cm on 31 January 2006, or slightly over 15 cm a−1. This is not large, but it is consistent with ablation on BIAs observed at low elevation elsewhere (Reference BintanjaBintanja, 1999). Some of the summer ablation is compensated by winter accumulation. Ablation can reach >40 cm during a single summer. Interestingly, the shift of relative surface elevation change due to accumulation and ablation in 2004 is very different to that in 2005. The net winter balance in 2004 is almost 0 while there is >30 cm accumulation in 2005. Although no measurement of precipitation is available, there is evidence (accumulation measured a few tens of kilometers inland (see GLACIOCLIM-SAMBA internet pages; short-term weather forecasts in section 3.3)) that it exceeds 100 cm of snow each year. Thus, blowing snow makes a very important contribution to the surface mass balance of the Cap Prudhomme BIA, and this contribution appears strongly interannually variable.
All meteorological variables measured by the AWS are sampled every 10 s, then averaged over 30 min (except wind direction, which is simply sampled every 30 min) and stored. Figure 6 shows the resulting meteorological time series from 16 January 2005 to 15 January 2006, after smoothing with a 24 hour (daily) running average filter. Except for a few days in early summer 2006, during which the temperature and moisture reports were clearly erroneous – probably due to liquid water on the sensor (high relative humidity reported at Dumont d’Urville) – and thus removed, there is no indication that the data are flawed. Comparison with data from the Météo-France weather station at Dumont d’Urville confirms that the AWS data are reasonably reliable (Fig. 6). The mean temperature, relative humidity (with respect to liquid water; the standard meteorological definition), wind speed, downwelling solar and thermal radiation are, respectively, −11.2°C (−10.9°C), 57% (59%), 11 m s−1 (8.2 ms−1), 126 Wm−2 (118Wm−2) and 206 Wm−2 (values in parentheses are from the Dumont d’Urville weather station). The differences between the two stations for temperature and moisture are of the order of the instrumental accuracy. The most important difference is for wind speed which is one-third stronger at Cap Prudhomme. Considering that the wind is mostly katabatic, it is not unreasonable that it is stronger at the coast of the ice sheet than further away at sea. Measurement height with respect to the closest snow/ice surface is similar at Dumont d’Urville and Cap Prudhomme, but the overall setting is different (e.g. differences in surface roughness due to surrounding buildings and rock outcrops). It is somewhat more difficult to suggest why there is slightly more incoming solar radiation at Cap Prudhomme than at Dumont d’Urville. It is possible that cloudiness may be slightly more important at sea than on the continent edge. In terms of variability, there is good agreement between the coastal AWS and the station reports at Dumont d’Urville.
3. Accumulation and Ablation Modeling
3.1. Accumulation and ablation model without snow erosion
The Crocus model (Reference Brun, Martin, Simon, Gendre and Coléou.Brun and others, 1989, Reference Brun, David, Sudul and Brunot.1992) was initially developed to simulate alpine seasonal snow and assist in avalanche risk evaluation. Crocus has since been used to model various other situations, in particular to simulate polar snow over ice sheets (Reference Dang, Genthon and Martin.Dang and others, 1997; Reference Genthon, Fily and Martin.Genthon and others, 2001). Crocus is a one-dimensional multilayer physical model of snow cover, which explicitly evaluates, in hourly steps, the surface mass and energy budgets, including turbulent heat and moisture surface exchange with the atmosphere and outgoing radiation, and the internal disposal of mass and energy. There are up to 50 subsurface layers through which mass and energy are exchanged to account for physical processes such as heat diffusion, radiation transfer and ice percolation. Phase changes are taken into account and snow densification and metamorphism are parameterized, affecting mass and energy transfer and changing surface albedo. Although Crocus is initially a snow model, it also accounts for plain ice as a particular kind of snow with density and radiative properties of ice, and liquid-water heat capacity and conductivity. Thus, Crocus can, in principle, be adapted to simulate the accumulation and ablation of Antarctic BIAs.
However, various aspects of Antarctic BIAs significantly differ from those of alpine snow or even ice. The density of fresh surface snow is typically much higher in Antarctica than in the Alps due to colder conditions and/or wind effects (Reference Dang, Genthon and Martin.Dang and others, 1997). An empirical parameterization of fresh snow density is used in Crocus (Reference Brun, Martin, Simon, Gendre and Coléou.Brun and others, 1989). The parameterization reads:
From top to bottom: 24 hour running mean temperature; relative humidity (with respect to liquid water); wind speed; downward solar and thermal radiation, from the Cap Prudhomme automatic weather station (black) and the Dumont d’Urville weather station (red). High relative humidity recorded at Dumont d’Urville at days 332 and 349 coincide with clearly erroneous reports at Cap Prudhomme, which have been removed from the record.


where ρ is the density (kgm−3), T is the surface temperature (°C), Vis the surface wind (m s−1) and ai are parameters. The density, ρ, cannot be less than 30 kgm−3. With the original parameters, even at 0°C and with winds as strong as 40 m s–1, the density hardly reaches above 200 kg m−3. Snow density measurements in the Cap Prudhomme area suggest that it is generally ∼300 kgm−3 or above (Reference Pettré, Pinglot, Pourchet and ReynaudPettré and others, 1986). Changing parameter a4 from the original 0.5 to 0.65, the parameterized fresh snow density reaches 300kgm−3 at 0°C and 22 m s−1 or at –10°C and 32 m s−1. As such pairs of temperature and wind are not exceptional during snowfall, and considering that there is considerable reworking of surface snow after precipitation anyway, these are the values we use in our modeling.
Prescribed surface roughness length, z 0, in the original (alpine) Crocus is 3 mm for snow. Over bare ice, the resulting drag coefficients are multiplied by 2 to account for a rougher surface due to rocks, crevasses, etc., that are otherwise hidden under snow. However, roughness lengths measured over BIAs range from 0.2 mm to 3 x 10⁻³mm (Reference BintanjaBintanja, 1999) and there are reports that the roughness length is smaller over ice in BIAs than over snow (Reference Bintanja and ReijmerBintanja and Reijmer, 2001). There are no measurements of roughness length over the Cap Prudhomme BIA, and here we use an estimate of 0.16 mm (Reference Van den Broeke, van As, Reijmer and van de Wal.Van den Broeke and others, 2005). The albedo of the surface snow is parameterized in the original Crocus and unaltered in the present application, except for a dirt-related albedo decrease with time which does not apply in the clean Antarctic environment. The albedo of bare ice was originally prescribed to be 0.45 or less, depending on spectral bands. Over alpine glaciers, Reference Gerbaux, Genthon, Etchevers, Vincent and Dedieu.Gerbaux and others (2005) found that even such low values are too high, due to detrital material and the presence of crevasses. Albedo measurements on the Cap Prudhomme BIA using a CNR1 radiometer yield a mean ice albedo of 0.67. This is the value we use here, except in the near infrared, a spectral domain in which ice is considered highly absorbing (albedo = 0.1).
3.2. Wind erosion
When run with local meteorological input (section 3.3), Crocus simulates ∼300cm of net snow accumulation in 2 years. Wind erosion is a component of the Antarctic surface mass balance (section 1) but it is not accounted for in Crocus. This is clearly a major deficiency in the application to coastal Antarctica. The contribution of wind erosion to local mass balance is a complex issue which, in principle, cannot be properly treated with a one-dimensional model. This is because snowdrift results from snow uptake from the surface by wind, a process that may be expressed in a one-dimensional vertical model, and from the convergence/divergence of horizontal snowdrift flux, a feature that needs resolving in the horizontal dimensions (Reference BintanjaBintanja, 2001; Reference GalléeGallée and others, 2001). To account for snowdrift convergence/divergence, not only is a two- or three-dimensional model required, but also all the necessary information to drive the model over the region of interest, including local and regional topography and lateral boundary fluxes. Local and regional spatial information on meteorological parameters is also necessary to either drive the multidimensional snow model, or verify a model that would also simulate the meteorology. Although spatial information on accumulation and ablation is available across the stake network, meteorological information is available at one point only, topographic information is not yet available beyond the network and lateral fluxes are not available anywhere. As a consequence, a simplified approach is used here to parameterize net snow erosion in Crocus as a one-dimension vertical model.
The parameterization is based on Reference GalléeGallée and others (2001) assuming that once snow is mobilized from the surface it is entirely exported by horizontal transport from the experimental domain, and that any airborne snow entering the experimental domain from the boundaries is entirely exported. This does not imply that there is no drifting snow deposition within the domain. Rather, if snow deposits it is resuspended and finally exported, and the only local net source of snow is precipitation. The experimental domain here is the domain over which the stake network is assumed to be representative, ∼1 km2. The aim (section 4) is to reproduce the mean relative surface elevation change from accumulation and ablation over the domain (Fig. 5). Thus local deposition/remobilization within the experimental domain is not explicitly accounted for and simply budgeted as a null contribution.
The assumption of complete export of drifting snow is crude but has some empirical support. Katabatic winds, which are the dominant and strongest winds in the region and thus mostly responsible for snow drift and export, blow from south to southeast. Due to the local shape and orientation of the coast and the proximity of Astrolabe Glacier, such winds flow over the sea and/or from the upstream valley of the glacier (Fig. 1) before reaching the experimental domain, thus carrying limited amounts of drifting snow with most of the heavier snow particles settling in the Astrolabe Glacier depression (where visual observations indeed show little blue ice). Net accumulation is observed to begin further than 1 km upslope, suggesting that either the convex shape of the BIA surface, or the stronger slope (or both) contribute to efficient export of drifting snow in the area. However, at this time the only way to support this assumption is to confirm that a snow model using it can reproduce the observations.
Analyzing the Byrd snow project data (Reference Budd, Dingle and Radok.Budd and others, 1966), Reference GalléeGallée and others (2001) suggest that snow uptake by wind from the surface occurs for friction velocity, u*, above ∼0.3 m s−1, in agreement with previous studies. In principle, the threshold friction varies with snow characteristics including snow density and grain size. Here, a threshold friction velocity of u* = 0.3 ms−1 is consistently used, but the erosion flux is modulated by snow density as simulated by Crocus. The parameterization reads:

where E is the net erosion, Ep is the potential erosion (see below), d is the surface snow density and dt is a threshold snow density above which erosion is prevented. Although there is no systematic measurement of snow density at Cap Prudhomme, occasional measurements suggest that longlived snow spots on the ice have density >500 kg m−3. Thus, we set dt to 500 kg m−3. In the case of precipitating snow, there is no modulation by surface snow density and E = max(Ep, P) where P is precipitation.
The potential erosion, E p , is approximated as a simplification of Reference GalléeGallée and others (2001). Assuming that the surface turbulent vertical flux of snow follows a bulk flux formula (Reference StullStull, 1999):

where Cd is a friction coefficient similar to that used for sensible and latent heat fluxes, V is the surface wind at standard level, qs is the snow concentration at the same level and qsalt is the concentration of snow at the surface resulting from saltation processes. According to Gallee and others (2001), qsalt may be approximated by:

where e = 3.25 u* is the saltation efficiency, g is gravity acceleration and hsalt is the height of the saltation layer which may be expressed as:

As Equations (4) and (5) are based on field observations (Reference Budd, Dingle and Radok.Budd and others, 1966), they implicitly and collectively account for the effects of all physical processes that contribute to blowing snow, including the gravitational settling of snow particles. Equation (3) expresses turbulent vertical exchange but not settling. However, the saltation layer contains significant quantities of snow only under strong winds. In that case, turbulence is a large contributor compared to settling which is consequently ignored.
Assuming that any net mobilized snow is quickly removed by horizontal transport, and keeping in mind that there is an assumed balance between deposited and remobilized drifting snow, then qsalt − qs ≈ qsalt . Combining Equations (2–5), acknowledging that V is related to u* (logarithmic profile; Reference StullStull, 1999), and approximating u*1.27 by u *:

This is the formulation we use in Crocus to account for wind erosion. The coefficient C may be evaluated:

where z is the standard height, z 0 the roughness length and k the von Karman constant (0.4).
Using Cd = 10−3, z = 10 m and z0 = 0.16 mm, it is found that C ≈ 0.1. This is clearly a gross evaluation, but it is supported by model results in section 4.
The erosion parameterization proposed above (Equations (6) and (7)) is admittedly very approximate. It ignores the sublimation of snowdrift (Reference BintanjaBintanja, 2001; Galle´e and others, 2001). Because of the assumption of complete export of drifting snow, it does not matter whether the suspended snow is finally in the solid or vapor phase. However, the sublimation of drifting snow may result in saturating the atmosphere and thus reducing the surface sublimation. This is not explicitly taken into account, if only because the surface atmospheric conditions for the snow model are prescribed (section 3.3) rather than calculated. In addition, on blue ice, blowing snow occurs occasionally when snow is present at the surface (after precipitation events; cf. Figs 8 and 9) and has adequate density (Equation (2)). Although surface sublimation may be overestimated by the model during blowing snow events, it occurs mainly in summer (Fig. 11) when blowing snow is less frequent. In any case, despite the possible overestimation, the modeled total sublimation remains much less than total wind erosion (∼1/3 to 1/4, section 4), so the possible relative error on cumulated ablation is limited.
Although other expressions of wind erosion could be devised, it is unlikely that a more constrained parameterization can be developed without additional measurements and/or a multidimensional model. The main point here is that, in order to use an accumulation and ablation model to evaluate the components of the relative surface elevation change at the Cap Prudhomme BIA and understand the reasons for annual and interannual variability, it is necessary to account for wind erosion in a way that removes surface snow at a rate compatible with observations. It is shown in section 4 that this is the case, to a reasonable extent, with the above parameterization.
3.3. Development of a 3 year meteorological dataset
Operational analyses and short-term forecasts from the European Centre for Medium-Range Weather Forecasts (ECMWF) are used to build full, uninterrupted time series of the meteorological variables necessary to run the Crocus model. These are surface atmospheric temperature; wind magnitude; relative humidity; precipitation quantity and phase; downwelling thermal radiation; downwelling direct and diffuse solar radiation; and cloud cover. The impact of cloud cover on thermal and solar radiation is taken into account in the prescribed radiation fluxes. The additional cloud cover information is used by Crocus only to parameterize the spectral distribution of solar radiation, which affects the surface albedo.
Surface temperature, wind, relative humidity and cloud cover are available as analyzed variables in the ECMWF archive. The analysis is probably significantly affected by the operational weather reports from Dumont d’Urville. Precipitation and radiation data are not analyzed. Therefore, they are obtained as short-term (6 and 12 hour) forecasts, which are also constrained by observations through initialization of the forecasts, but obviously less than the analyses. There is currently no re-analysis available from the ECMWF over the period of interest. Thus, the operational product is used, the time consistency of which may be affected by various changes in the meteorological modeling or the observation assimilation schemes. However, there was no major change, such as a change in model resolution, from January 2004 to January 2006. On 1 February 2006, though, the resolution was increased, so the model (section 4) is not run beyond 31 January 2006 in the present study. The nominal horizontal resolution is ∼40 km (T256 spectral truncation).
The characteristics of the gridpoints closest to Cap Prudhomme are given in Table 1. They show a variety of elevation and continentality, and the closest gridpoint is not necessarily the most appropriate to represent the local meteorological conditions. Considering that resolution is coarse, that elevation and/or continentality are not appropriate and that analyses and forecasts are less than perfect, the observed meteorological series are used to select an ECMWF gridbox and adjust empirical regression-based corrections towards a best fit over the meteorological observation period. The corrections are then applied to the unobserved period to produce full series from 1 January 2004 to 31 January 2006. The series is extended to 1 January 2003, in order to run the model for a full year before the period of interest for comparison with accumulation and ablation observations. As there is no observation of precipitation or clouds at Cap Prudhomme, the ECMWF precipitation and clouds are used without correction.
Before corrections, the mean differences between the ECMWF and the AWS data exceed 2°C (temperature), 2 m s−1 (wind), 17% (humidity) and 12Wm−2 (downward thermal radiation). After correction, the mean differences are close to 0 since regressions are used. Observed variability at various timescales (daily, seasonal) is also fairly well reconstructed, although wind and relative humidity, which are essential variables for erosion and sublimation calculations, are affected by significant scatter. Clouds (uncorrected) may be compared with observations at Dumont d’Urville, and they agree well when the sky is mostly clear or mostly overcast, which are the most frequent cases, but not so well in between. (Cloud cover is <0.1 (10%) for 26% of the time. It is >0.9 (90%) for 45% of the time. The overall averaged coverage is 0.6, or 60%.) Although having clouds in the input to Crocus directly affects the spectral distribution of solar radiation and finally the snow albedo only, in the ECMWF model they also affect radiation, and thus, indirectly, the radiation input to Crocus. The fact that cloud cover is either largely covered or largely clear for most of the time contributes to offset the impact of the ECMWF cloud errors on the Crocus simulation. The reconstructed series are shown and compared with the observed data, when available, in Figures 7 and 8.
The four ECMWF gridpoints nearest to Cap Prudhomme, with distance, mean elevation within the corresponding gridbox, and mean continentality (land/sea fraction)

Another option here would have been to use the Dumont d’Urville weather reports as proxy for meteorology at Cap Prudhomme. This would have improved the variability in the meteorological dataset, compared to that obtained from the ECMWF data. Corrections would, nonetheless, have been needed, at least for wind and radiation. In addition, solar radiation is available at Dumont d’Urville as daily average only, and thermal radiation is not available. The weather station reports would thus be insufficient for our purpose and the ECMWF data would be, at least partially, needed. Using a consistent dataset from the ECMWF is preferred and deemed sufficient for this study, but for more detailed applications different sets of meteorological data could be useful to evaluate model result uncertainties related to the input meteorological data.
4. Model Results and Discussion
Using the corrected ECMWF meteorological time series presented in section 3.3, a simulation of accumulation and ablation is carried out from 1 January 2003 to 31 January 2006. The initial snow/ice profile (snow/ice stratigraphy, temperature, etc.) to start the run results from a previous simulation and is representative of mid-summer at Cap Prudhomme. The simulation for 2003 cannot be verified by observations but it provides an outlook on interannual variability extended by 1 year and, we expect, a more realistic initial condition for the main period of interest, early 2004 to end of January 2006. Figure 9 shows the modeled accumulation and ablation over the 3 years and compares it with the 2 years of observed values. Due to field survey inaccuracies, spatial variability, noise within the stake network and PCA filtering (section 2.2), it is conservatively estimated that each single survey is accurate within ±10 cm. With the snow erosion parameterization, the model simulates a cumulated net ablation between 26 January 2004 and 31 January 2006 of 39 cm. This is ∼6cm more ablation than the observation (33 cm ablation; section 2.2), thus within estimated observation uncertainties. It is also consistent with neglecting a possible reduction in surface sublimation due to ignoring the sublimation of snowdrift and consequent saturation of the atmosphere (section 3.2).
Corrected ECMWF meteorology for Cap Prudhomme from 1 January 2003 to 31 January 2006 (black) and observed Cap Prudhomme meteorology (red): From top to bottom: temperature; relative humidity (with respect to liquid water); wind speed; downward solar and thermal radiation. All series smoothed with a 24 hour running filter.

Adjusting blowing snow parameters which are weakly constrained (e.g. C in Equation (6)) makes it possible to exactly reproduce the cumulated accumulation and ablation at the end of the 2 years, but not the details of their evolution throughout the period. The model misses a small amount of accumulation at the end of the 2004 winter and instead simulates some ablation (early October 2004;Fig. 9). This is not inconsistent with the observation at some of the stakes (Fig. 3) but it disagrees with the PCA-filtered mean record. The error is propagated all the way to the end of the simulation. If the model series is shifted to fit with observations at the end of the 2004 winter (Fig. 9; blue curve) the agreement with the observation is good throughout 2005 and early 2006 except after the first strong precipitation event when snow erosion appears too efficient. The error is within estimated observation uncertainty though, and the simulated series is back in agreement with observations after the second strong precipitation event. Summer ablation is consistently well reproduced, even though in the early part of the 2005/06 summer it is largely due to blowing snow while in 2004/05 it is mainly melt and sublimation.
The two years recorded, 2004 and 2005 (plus a month in 2006), are very different. The stake network suggests a very small mass-balance change over the 2004 winter compared to strong accumulation during the 2005 winter. According to the ECMWF, the cumulated precipitation (Fig. 8) between March and October is 69cmw.e. in 2004 and 48cmw.e. in 2005. Mass-balance observations in the accumulation region inland from Cap Prudhomme are consistent with much more precipitation in 2004, enhancing confidence in the ECMWF precipitation data and their use for modeling the mass balance of the region, yet at Cap Prudhomme there is net accumulation in the winter of 2005 but little in 2004. This contrast is well reproduced by the model. The mean wind is slightly stronger in 2004 (12.3 ms−1) than in 2005 (11.7m s−1) but this difference is too weak to explain so much more ablation by erosion in 2005. To account for variability and chronology, modifying the meteorology input to Crocus so that the wind of 2004 is reused in 2005, while keeping all other variables unchanged, marginally affects the accumulation and ablation history in 2005 and finally induces less ablation at the end of the period than in the reference run (Fig. 10, green curve). However, reusing precipitation rather than wind (blue curve) results in a very different accumulation and ablation history, ending with >12 cm more ablation than in the reference run. Finally, replacing both wind and precipitation in 2005 by those of 2004 results in a 2005 year that has strong similarities with 2004 (orange curve). Thus, it is the coincidence between wind and precipitation, rather than the separate mean or chronology of one or the other, that determines the history of accumulation and ablation and whether there is significant winter accumulation or not. The fact that the reference simulation best overall reproduces the observations for 2005 indicates that the ECMWF wind and precipitation data (corrected for wind but not for precipitation; section 3.3) have realistic characteristics in terms of timing, amounts and coincidence.
Uncorrected ECMWF precipitation (upper plot, smoothed with a 24 hour running filter) and cumulated precipitation (lower plot) for Cap Prudhomme, from 1 January 2003 to 31 January 2006.

Simulated relative surface height change from accumulation and ablation (red) from 1 January 2003 to 31 January 2006 using the Crocus model, the snow erosion parameterization described in section 3.2 and the input meteorology described in section 3.3 and Figures 7 and 8. Also shown are the observations (black, repeated from Fig. 5) and the simulation from 1 November 2004 to 31 January 2006, shifted to fit the observation at the end of the 2004 winter (blue).

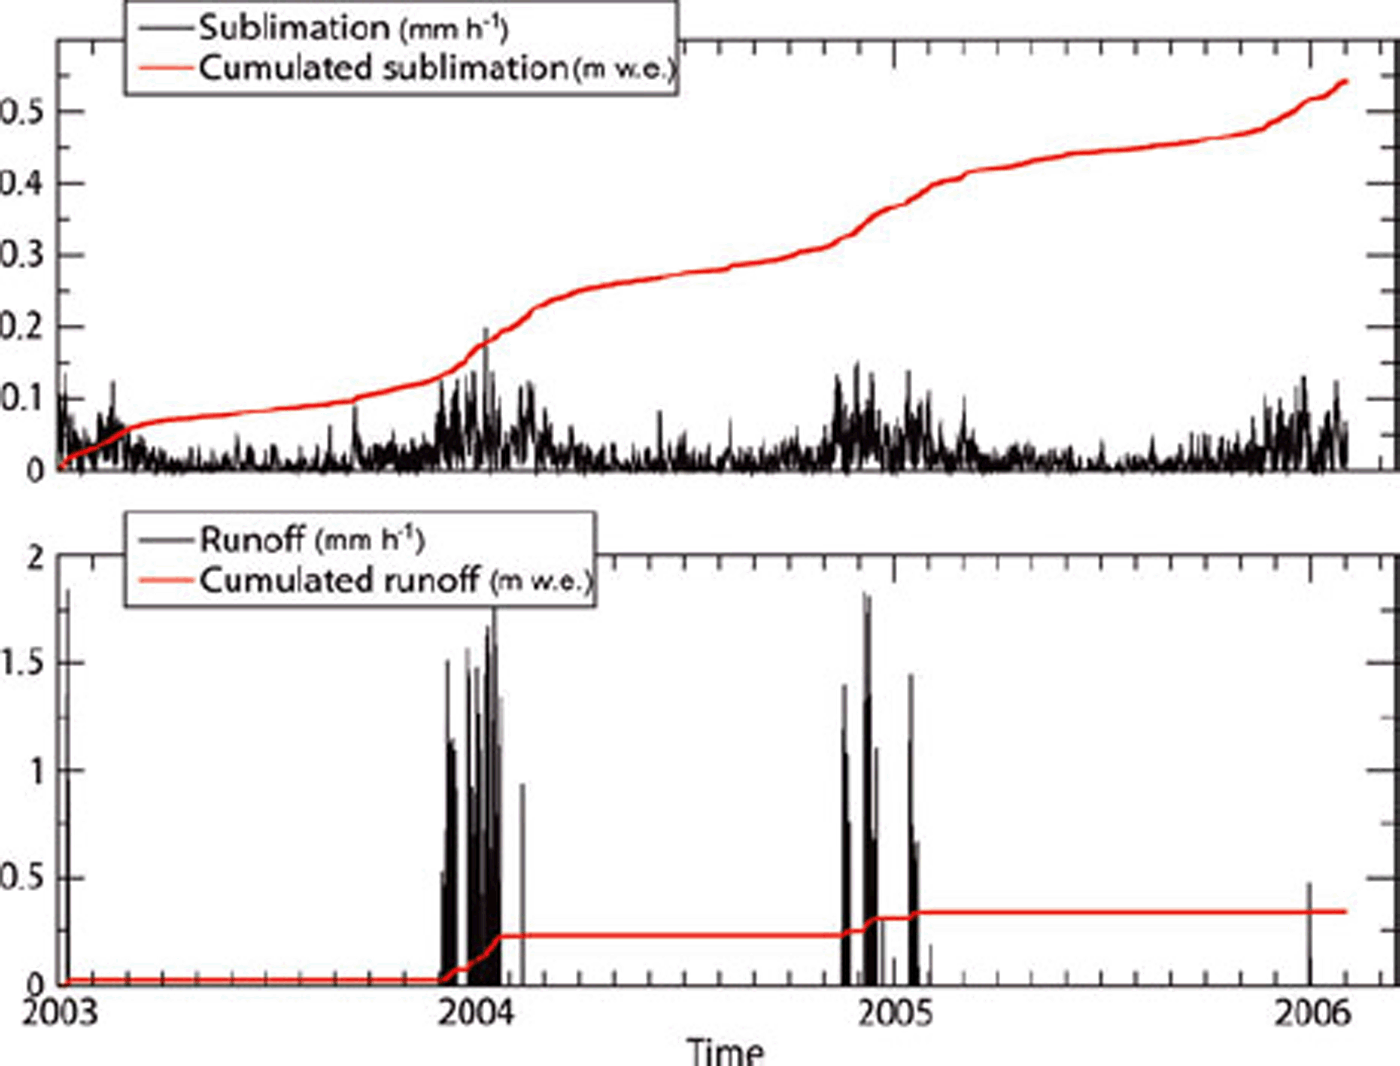
According to the model, in the reference run there is hardly any snow left at the end of the simulation. In the field, there were indeed only snowpatches left except in the northeasternmost corner of the stake network. At the beginning of the 2005/06 summer season there were large quantities of snow, also in agreement with the model. This is contrary to the 2004/05 season for which both model and observation indicate ice at the surface early in the season and even during much of the winter. Although surface snow sublimation and melting also contribute (see below), by far the largest contributor to ablation is wind erosion which removes almost all of the cumulated precipitation over the period 1 January 2004 to 31 January 2006, that is more than 140 cm w.e. Over the same period, sublimation over a snow or ice surface accounts for 38 cm w.e. (∼1/4, possibly overestimated, due to missing sublimation of blown snow and the saturation effect) while melt followed by runoff accounts for 24 cm w.e. In the model, any melted ice runs off while the snowpack can retain and possibly refreeze all or a fraction of the melted snow. Because Crocus is a onedimensional model, runoff water that may refreeze downslope is not taken into account. Thus the runoff estimate above is more likely to be an overestimate than an underestimate. In the field, there is limited visual evidence of extensive presence of liquid water and no clear evidence of runoff to the nearby ocean, but this is not surprising considering the small amounts involved according to the model. Seasonal and interannual variability of runoff is high (Fig. 11). Runoff only occurs in summer and episodically, but when it occurs it may remove >1.5 mm w.e. in 1 hour. According to the model there was almost no runoff in 2005/ 06. This is probably due to the presence of snow at the surface until late in the season. A higher surface albedo results in less solar energy absorption and thus less melt. In addition, meltwater can refreeze in the snow, whereas it runs off ice. According to the model, runoff was particularly high in 2003/04 and weak in early 2003; however, surveys on the site only began in 2004 so there is little field information to confirm these results. Sublimation is also seasonal, with much higher values in summer. However, it is more smoothly distributed in time than runoff, has much lower peak values and is weaker, but not negligible, in winter (Fig. 11).
Sensitivity of relative surface height from surface accumulation and ablation to wind and precipitation in 2005.

Sublimation (upper plot) and runoff (lower plot) at Cap Prudhomme from the Crocus model.
5. Summary and Conclusions
As part of a recently launched Antarctic surface massbalance observatory, the Cap Prudhomme coastal BIA has been monitored since early 2004. A stake network was set up and surveyed 25 times between February 2004 and February 2006, including in winter. An AWS was deployed in early 2005 to monitor the local meteorological parameters which determine the accumulation and ablation. In this study, a snow/ice model, which includes parameterization of snow erosion by wind, is used to tentatively reproduce the observed progress of accumulation and ablation at the Cap Prudhomme BIA and evaluate their components. The model is driven by a meteorological series from the ECMWF that has been corrected using the AWS data. A number of previous studies have evaluated the components of the surface mass balance of Antarctic BIAs inland. To our knowledge, this is the first time a BIA on the coast is studied to such extent.
Despite a simplified parameterization for blowing snow effects, which cannot be more explicit in a one-dimensional vertical model with prescribed surface meteorology, and despite uncertainties on various local parameters such as the roughness length of the surface (taken from the literature rather than measured locally), the model is quite successful at reproducing the observed surface accumulation and ablation. In particular, the two years on record are very different, the first showing an almost null net winter surface mass balance while large accumulation occurred during the second winter. This is well reproduced by the model, despite the fact that mean precipitation from the ECMWF is 50% larger during the first winter. Summer ablation is also reproduced by the model. Therefore, we have some confidence that the model can provide insights into the main processes affecting the surface mass balance of the Cap Prudhomme BIA.
There is no doubt that the largest term by far is erosion by wind. Without the parameterization of wind erosion, the model would simulate ∼300cm of snow accumulation over 2 years. Sublimation and melt/runoff are secondary terms but they are not negligible. These are the main components of summer ablation once all precipitated snow has been removed by wind. This is essentially the case in the summer of 2004/05. The large ablation in 2005/06 is, to a significant extent, due to the wind erosion of snow accumulated during the preceding winter. On average between early 2004 and 2006, according to the model, sublimation and melt/runoff account for 38 and 24cmw.e., respectively. Although these model-based estimates are subject to uncertainties, it is not likely that melt is a very large term in the mass balance of the Cap Prudhomme BIA since evidence of liquid water in the field, and more particularly of liquid water that runs off to the ocean, is weak.
According to Reference BintanjaBintanja (1999), BIAs are characterized by little accumulation of snow due to divergence of snowdrift plus snow/ice sublimation, with negligible contribution from melt. This characterization of BIAs essentially results from observations of BIAs remote from the coast and/or at relatively high elevation. It is intended to distinguish true BIAs from low-elevation flowing glaciers, where ablation is large and dominated by melt and runoff such as mountain glaciers in the northern part of the peninsula or at lower latitudes. As a consequence of this definition, Reference BintanjaBintanja (1999) suggests that BIAs occur over the entire surface of the continent, except very near the coast. Although located at the coast, the characteristics of the Cap Prudhomme BIA fit more with Reference BintanjaBintanja’s (1999) definition than with that of glaciers dominated by melt. Because melt is small but not negligible, coastal BIAs are of complementary interest in the general study of Antarctic BIAs. Satellite images suggest that similar coastal BIAs are not infrequent, at least in the Terre Adelie region.
Although there are only 2 years of data, the record of accumulation and ablation at the Cap Prudhomme BIA suggests large interannual variability. Previous reports of the accumulation in the Terre Adélie region (Reference Pettré, Pinglot, Pourchet and ReynaudPettré and others, 1986) also show large interannual variability. There is also visual evidence that the surface mass balance at Cap Prudhomme is highly variable. In early 2004, a large moraine outcrop was clearly visible in the lowest-elevation part of the BIA (Fig. 2). It was less visible in 2005 and barely in 2006. The moraine is represented on maps of the early 1970s. However, in summer 1986/87 it was buried below several meters of snow. Such high variability suggests high sensitivity to meteorological parameters. Understanding how coastal BIAs respond to meteorology and climate could make it possible, through satellite monitoring of the extent and surface characteristics (snow/ice) of other coastal BIAs, to more comprehensively monitor variability and changes along the coast of Antarctica.
Although most Antarctic stations are located at or near the coast, the distance between any two stations is typically several thousands of kilometers; this leaves large chunks of the coastal ice sheet unmonitored. Yet, in absolute terms, changes in accumulation with climate change are expected to be largest near the coast, rather than on the plateau, because this is where the mean accumulation is largest. It is thus important to monitor coastal climate and related massbalance terms as extensively as possible. The Cap Prudhomme BIA stake network and AWS system is part of a larger initiative, GLACIOCLIM-SAMBA that takes logistical advantage of the Dumont d’Urville, Cap Prudhomme and Concordia stations in Terre Adélie and Wilkes Land to monitor the mass balance of this region and to understand its relationship to the climate. It is expected that the initiative will last at least 10 years and hopefully longer. Data from the GLACIOCLIM-SAMBA observatory are being progressively made available to the international community through the internet (http://www-lgge.obs.ujf-grenoble.fr/∼christo/ glacioclim/samba/).
Acknowledgements
Field activities for the GLACIOCLIM-SAMBA observatory are supported by the French (IPEV) and Italian (PNRA) Polar Institutes. Research was supported by Institut National des Sciences de l’Univers, France, and the French Ministry of Research through the ACI-C3 project. E. Le Meur and P. Wagnon made decisive contributions to devising and setting up the stake network and AWS at Cap Prudhomme. Topographic data reported in Figure 2 are from a GPS survey by P. Wagnon. Many others at Laboratoire de Glaciologie et Geophysique de l’Environnement and IPEV helped make the field program successful. Winter data of accumulation and ablation would not have been available without the courage and endurance of the winter-over people at Dumont d’Urville.



