1. Introduction
As the largest exchangeable carbon pool in aquatic systems, the dissolved organic carbon (DOC) inventory in the ocean (∼ 662 ± 32 Pg; 1 Pg = 1015 g) is approximately equal to that of atmospheric CO2 and exceeds the reservoir of oceanic particulate OC (POC) by 200-fold (Carlson and Hansell Reference Carlson, Hansell, Hansell and Carlson2015; Hedges Reference Hedges1992). Any perturbations in the process of oceanic DOC production and removal would affect not only ocean-atmosphere CO2 balance, but also OC export and its storage in the ocean interior (Carlson and Hansell Reference Carlson, Hansell, Hansell and Carlson2015; Hansell and Carlson Reference Hansell and Carlson1998; Hansell et al. Reference Hansell, Carlson, Repeta and Schlitzer2009). The sources of DOC in the ocean include intra-/extra-cellular soluble substances produced by phytoplankton and from feeding by zooplankton, the dissolution of fecal material, as well as atmospheric depositions and riverine inputs (Druffel et al. Reference Druffel, Williams, Robertson, Griffin, Jull, Donahue, Toolin and Linick1989). Global rivers delivered approximately 200 Tg/yr (1 Tg = 1012 g) of terrestrial DOC to oceans, and this major flux is sufficient to account for the radiocarbon (14C) based oceanic residence time of DOC (Beaupré et al. Reference Beaupré, Druffel and Griffin2007; Meybeck Reference Meybeck1982; Meyers-Schulte and Hedges Reference Meyers-Schulte and Hedges1986; Opsahl and Benner Reference Opsahl and Benner1997). DOC removal processes included biotic consumption by prokaryotes and eukaryotes and abiotic removal by photo-transformation, particle sorption, marine microgel condensation and hydrothermal circulation (Carlson and Hansell Reference Carlson, Hansell, Hansell and Carlson2015). Consequently, DOC plays significant roles in the global carbon cycle, as well as in other processes such as the cycling of many elements and microbial activities (Carlson and Hansell Reference Carlson, Hansell, Hansell and Carlson2015; Hedges Reference Hedges1992; Jiao et al. Reference Jiao, Herndl, Hansell, Benner, Kattner, Wilhelm, Kirchman, Weinbauer, Luo, Chen and Azam2010).
DOC is a complex matrix that contains thousands of poorly characterized organic compounds (Carlson and Hansell Reference Carlson, Hansell, Hansell and Carlson2015). Many analytical techniques have been used to identify the compositional, spatial and temporal variability of DOC in aquatic systems, but the characterized DOC still can only represent a small portion of bulk DOC (Dittmar and Koch Reference Dittmar and Koch2006; Hertkorn et al. Reference Hertkorn, Benner, Frommberger, Schmitt-Kopplin, Witt, Kaiser, Kettrup and Hedges2006, Reference Hertkorn, Harir, Koch, Michalke, Grill and Schmitt-Kopplin2012; Kujawinski Reference Kujawinski2011; Repeta Reference Repeta, Hansell and Carlson2015). Using the solid phase extraction approach or ultra-filtration techniques, for example, compound specific classes can be further procedurally defined and characterized (Loh et al. Reference Loh, Bauer and Druffel2004; Repeta Reference Repeta, Hansell and Carlson2015), some carbohydrate functional groups can be qualitatively characterized by the proton nuclear magnetic resonance (1H NMR) spectra (Hertkorn et al. Reference Hertkorn, Harir, Koch, Michalke, Grill and Schmitt-Kopplin2012), and thousands of compounds can be identified by Fourier transform ion cyclotron resonance mass spectrometry (FTICR-MS) (Dittmar and Koch Reference Dittmar and Koch2006; Dittmar et al. Reference Dittmar, Koch, Hertkorn and Kattner2008). Alternatively, several studies have demonstrated that the abundance of natural 14C can constrain the provenance and fate of bulk DOC (Druffel et al. Reference Druffel, Griffin, Lewis, Rudresh, Garcia, Key, McNichol, Hauksson and Walker2021, Reference Druffel, Lewis, Griffin, Flaherty, Rudresh, Hauksson, Key, McNichol, Hwang and Walker2023; Xu et al. Reference Xu, Roberts, Elder, Kurz, McNichol, Reddy, Ward and Hanke2021), because the 14C of bulk-DOC is considered as the weighted average of 14C signatures of all molecules in DOC with specific sources and biological reactivities (Druffel et al. Reference Druffel, Williams, Bauer and Ertel1992; Loh et al. Reference Loh, Bauer and Druffel2004). In the last few decades, research results have revealed that the majority of ocean DOC is recently-produced in the euphotic zone (Beaupré Reference Beaupré, Hansell and Carlson2015; Beaupré et al. Reference Beaupré, Druffel and Griffin2007), but the 14C ages of riverine DOC varied widely (from modern to thousands of years), influenced by human activities, vegetation coverage, as well as basin precipitation (Marwick et al. Reference Marwick, Tamooh, Teodoru, Borges, Darchambeau and Bouillon2015). The 14C ages of deep DOC were about 4000 – 6000 years old, since the formation ages of deep water were hundreds of years and the cycle time of DOC in deep water was indeed very long (Druffel and Bauer Reference Druffel and Bauer2000; Druffel et al. Reference Druffel, Griffin, Lewis, Rudresh, Garcia, Key, McNichol, Hauksson and Walker2021, Reference Druffel, Lewis, Griffin, Flaherty, Rudresh, Hauksson, Key, McNichol, Hwang and Walker2023; Williams and Druffel Reference Williams and Druffel1987).
DOC in the open ocean is characterized by low concentrations (∼40 μM) and high salt concentration (Hansell et al. Reference Hansell, Carlson, Repeta and Schlitzer2009). Thus, the key procedure of ocean DOC radiocarbon measurements is to generate sufficient purified gaseous CO2 by complete oxidation (Beaupré et al. Reference Beaupré, Druffel and Griffin2007; Druffel et al. Reference Druffel, Williams, Robertson, Griffin, Jull, Donahue, Toolin and Linick1989), and ultraviolet light irradiation (UV-oxidation) has been shown to be an effective approach to oxidize DOC to CO2 for such measurements (Beaupré et al. Reference Beaupré, Druffel and Griffin2007; Druffel et al. Reference Druffel, Williams, Robertson, Griffin, Jull, Donahue, Toolin and Linick1989; Xue et al. Reference Xue, Ge and Wang2015, Reference Xu, Roberts, Elder, Kurz, McNichol, Reddy, Ward and Hanke2021). A UV-oxidation system was established in the Ocean University of China (OUC), with high oxidation efficiency (94 – 98%), low procedure blank (< 3 μgC, by direct measurement), as well as high work efficiency (simultaneous multiple sample processing) (Xue et al. Reference Xue, Ge and Wang2015). This system had processed many natural DOC samples, for example, rain and snow samples, riverine, coastal and oceanic water, as well as marine sediment porewater. The amounts of generated CO2 from these samples were ranging from small size (100 – 1000 μgC) to regular size (> 1000 μgC), and the graphite from these samples further satisfied the requirements for radiocarbon measurement by AMS (National Electrostatics Corporation). The mini carbon dating system (MICADAS) at OUC-CAMS can measure the radiocarbon content for small/ultra-small (2 – 100 μgC) DOC samples with minimum carbon mass of 15 μgC, with the generated CO2 gas introduced to the ion source directly without graphitization by a gas interface system (GIS) with high analytical precision of 8‰ (Wang et al. Reference Wang, Zhang, Ning, Xu and Zhao2023). Thus, the goal of this study is to evaluate the performance of MICADAS for small/ultra-small DOC samples by CO2 gas injection, based on the pretreatment protocol reported by Xue et al (Reference Xue, Ge and Wang2015). In addition, the CO2 purification and collection approach was modified to minimize the influence of potassium iodide (KI) trap on fresh DOC processing. We measured the radiocarbon content for two secondary standard materials in solution (glycine-dead, oxalic acid II, OXII-modern) and a series of field DOC samples from the Pearl River-Estuary-northern South China Sea continuum, in the small/ultra-small size range (30 – 236 µgC). The carbon masses and F14C values of the two secondary standards were used to assess the procedure blank, and the data correction was conducted based on the corresponding procedure blank for the field DOC samples. Our results demonstrated that the radiocarbon measurement of CO2 gas by MICADAS is particularly suitable for small/ultra-small size natural DOC samples.
2. Materials and methods
2.1. UV-oxidation system and modified vacuum line
We used the UV-oxidation system and generated CO2 purification and collection vacuum line to process our DOC samples, reported in Xue et al. (Reference Xue, Ge and Wang2015). However, in this study, we modified the generated CO2 purification and collection approach when processing freshwater DOC samples. The KI solution trap in the vacuum line was designed to remove chlorine and bromine that accompanies the UV-generated CO2 from seawater DOC (Beaupré et al. Reference Beaupré, Druffel and Griffin2007; Xue et al. Reference Xue, Ge and Wang2015, Xu et al. Reference Xu, Roberts, Elder, Kurz, McNichol, Reddy, Ward and Hanke2021). But chlorine and bromine are not present in freshwater DOC samples, therefore the KI trap was dismantled to reduce the size of the procedure blank. Consequently, there were two approaches to purify and collect the gaseous CO2 derived from UV-oxidation, using the KI trap when processing the marine DOC samples and dismantling the KI trap when processing the freshwater DOC samples.
2.2. Procedure blank assessments
Comprehensive characterization and quantification of extraneous carbon in small/ultra-small scale radiocarbon analyses play critical roles on the accurate determination of radiocarbon content and robust interpretation of the data (Hanke et al. Reference Hanke, Wacker, Haghipour, Schmidt, Eglinton and McIntyre2017). Procedure blank was mostly introduced by UV-oxidation and the following steps of gaseous CO2 purification and collection, instead of other effects such as incomplete oxidation or fractionation (Xu et al. Reference Xu, Roberts, Elder, Kurz, McNichol, Reddy, Ward and Hanke2021). Both direct and indirect approaches have been used before to assess the whole procedure blank. Briefly, the direct approach processed the OC free Milli-Q water following the same protocol and measured the blank on the vacuum line (Xu et al. Reference Xu, Roberts, Elder, Kurz, McNichol, Reddy, Ward and Hanke2021). In the indirect approach, magnitude and isotopic composition of the procedure blank could be calculated accurately by a mass balance model based on the radiocarbon contents of two secondary standard materials (dead vs. modern) with varying carbon masses. We chose the indirect approach in this study to assess the carbon mass and carbon isotopic composition of the procedure blank, and to evaluate whether the obtained procedure blank is consistent with that by the direct approach.
2.3. Secondary standards and field samples
Glycine is chosen as the 14C free secondary standard material, attained from Sigma-Aldrich (Shanghai) Trading Co. Ltd. (purity: ≥ 99.9%, Lot # SLBZ0596). The measured F14C values of this glycine standard by MICADAS at OUC-CAMS were 0.0011 ± 0.0008 (n = 4, graphite as target) and 0.0023 ± 0.0024 (n = 7, CO2 as target). The graphite is prepared by an automatic graphitization equipment (AGE3) coupled to an elemental analyzer (EA), and the gaseous CO2 is introduced to MICADAS by an EA-GIS (Wang et al. Reference Wang, Zhang, Ning, Xu and Zhao2023). The standard reference material (SRM) 4990C, oxalic acid II (OXII), is chosen as the modern standard with a given F14C value of 1.3407, which is obtained from the National Institute of Standards and Technology (NIST; Gaithersburg, MA, USA). Before UV-oxidation, both glycine and OXII solid were dissolved in UV-oxidized Milli-Q water (OC-free) to acquire standard stock solutions with a concentration of 100 μgC/L and stored at 4 °C. The Milli-Q water was pre-irradiated with UV exposure for 1 h to minimize the potential impact of the Milli-Q water-derived extraneous carbon (Griffin et al. Reference Griffin, Beaupré and Druffel2010; Xu et al. Reference Xu, Roberts, Elder, Kurz, McNichol, Reddy, Ward and Hanke2021).
Fifteen field DOC samples were collected from the Pear River-Estuary-northern South China Sea continuum with different seasons, salinities and water depths (Table S1). The samples were then filtered by 0.7 μm GF/F filters (550 °C pre-baked for 4 h) and kept frozen in 500 mL plastic bottles (polypropylene, Fisher Scientific) immediately until further processing. The plastic bottles were soaked in 10% HCl overnight, rinsed by MQ water three times, and flushed with filtered DOC samples three times before use.
2.4. UV-oxidation and radiocarbon measurements
UV-oxidation was carried out at a ratio of two secondary standard material solutions (dead and modern) per six natural samples. We obtained varying amounts of CO2 ranging from ultra-small to small size from the UV-oxidation of secondary standard material solutions, to assess the carbon mass and carbon isotopic composition of the procedure blank accurately. Before the UV-oxidation of secondary standard material solutions, approximately 100 mL Milli-Q water was pre-oxidized in the custom-made quartz reaction tube for 1 h first to minimize the potential impact of the Milli-Q water-derived extraneous carbon (Griffin et al. Reference Griffin, Beaupré and Druffel2010; Xu et al. Reference Xu, Roberts, Elder, Kurz, McNichol, Reddy, Ward and Hanke2021). After cooling, a few milliliters (depending on the intended mass of CO2) of standard stock solutions were added into the pre-cleaned Milli-Q water, and using 85% phosphoric acid (H3PO4, Aladdin) to acidify the samples to pH 2 and the joints were sealed. Afterward, the acidified standard samples were then purged with ultra-high purity helium gas for 20 min to ensure that the DIC in the samples was completely purged away (Fu et al. Reference Fu, Xu, Druffel, Wang, Sun, Luo, Zhang and Fan2022; Qi et al. Reference Qi, F, Tia, Luo, Shan, Sun, Ren, Zhang, Liu, Zhang and Wang2020; Xue et al. Reference Xue, Ge and Wang2015). Following 5 h of UV-oxidation, the generated CO2 gas was purged with ultra-high purity helium gas through the vacuum purification and extraction line, and was collected cryogenically and flame-sealed inside 4 mm OD Pyrex break-seal tubes for radiocarbon analysis. Field DOC samples were processed following the same protocol, and the suitable approach was chosen to purify and collect the generated CO2 based on salinity (Table S1).
The 14C measurement of secondary standards and field samples was carried out using the MICADAS (Ionplus AG) via GIS at the Ocean University of China Radiocarbon Accelerator Mass Spectrometer Center (OUC-CAMS), with errors in the Δ14C (1σ) of ± 8‰ (Wang et al. Reference Wang, Zhang, Ning, Xu and Zhao2023). In this study, all 14C measurements are expressed as Fraction Modern (F14C) (Stenström et al. Reference Stenström, Skog, Georgiadou, Genberg and Johansson2011):
 $\matrix{{{{\rm{F}}^{14}}{\rm{C}} = \left[ {{{\left( {^{14}{\rm{C}}{/^{12}}{\rm{C}}} \right)}_{\rm sample, - 25}} /0.95*{{\left( {^{14}{\rm{C}}{/^{12}}{\rm{C}}} \right)}_{\rm OXI, - 19}}} \right]} \cr \quad\quad\quad\; { = \left[ {{{\left( {^{14}{\rm{C}}{/^{12}}{\rm{C}}} \right)}_{\rm sample, - 25}} /0.7459*{{\left( {^{14}{\rm{C}}{/^{12}}{\rm{C}}} \right)}_{\rm OXII, - 25}}} \right]} \cr }$
2.5. Statistical evaluation of radiocarbon data
The indirect approach was applied to assess the procedure blank for pretreatment of DOC radiocarbon measurement when the carbon masses of generated CO2 gas is in small/ultra-small size range. Statistical evaluation was conducted by mass balance model, and the equations are as follow (Haghipour et al. Reference Haghipour, Ausin, Usman, Ishikawa, Wacker, Welte, Ueda and Eglinton2018; Hanke et al. Reference Hanke, Wacker, Haghipour, Schmidt, Eglinton and McIntyre2017; Xu et al. Reference Xu, Roberts, Elder, Kurz, McNichol, Reddy, Ward and Hanke2021):
 ${{\rm{F}}^{14}}{{\rm{C}}_{\rm{S}}} = {\rm{ }}{{{{\rm{F}}^{14}}{{\rm{C}}_{{\rm{M}}\;}}{\rm{*}}\;{{\rm{m}}_{\rm{M}}}\; - {{\rm{F}}^{14}}{{\rm{C}}_{\rm{C}}}\;{\rm{*}}\;{{\rm{m}}_{\rm{C}}}} \over {{{\rm{m}}_{\rm{M}}}\;{\rm{ - }}\;{{\rm{m}}_{\rm{C}}}}}$
where F14CS is the corrected F14C value of samples, F14CM is the measured raw data from MICADAS, and F14CC is the F14C of the contaminant; the sum carbon mass of samples (mS) and the contaminants (mC) is the carbon mass of MICADAS measured (mM). The corresponding uncertainty of F14CS (for the sample) is derived from error propagation:
 ${\sigma ^2}_{{{\rm{F}}^{14}}{{\rm{C}}_{\rm{S}}}} = {\left[ {{\sigma _{{{\rm{m}}_{\rm{C}}}}}\left( {{{{{\rm{F}}^{14}}{{\rm{C}}_{\rm{M}}}\;*\;{{\rm{m}}_{\rm{M}}}\; - \;{{\rm{F}}^{14}}{{\rm{C}}_{\rm{C}}}\;*{{\rm{m}}_{\rm{C}}}} \over {{{\left( {{{\rm{m}}_{\rm{M}}} - {{\rm{m}}_{\rm{C}}}} \right)}^2}}}} \right) - \;{{{{\rm{F}}^{14}}{{\rm{C}}_{\rm{C}}}} \over {\left( {{{\rm{m}}_{\rm{M}}} - {{\rm{m}}_{\rm{C}}}} \right)}}} \right]^2}$
 $ \quad\quad\quad\quad\quad+ {\left[ {{\sigma _{{{\rm{m}}_{\rm{M}}}}}\left( {{{{{\rm{F}}^{14}}{{\rm{C}}_{\rm{M}}}} \over {\left( {{{\rm{m}}_{\rm{M}}} - {{\rm{m}}_{\rm{C}}}} \right)}}\;-\;{{ \;{{\rm{F}}^{14}}{{\rm{C}}_{\rm{M}}}\;*\;{{\rm{m}}_{\rm{M}}}\; - \;{{\rm{F}}^{14}}{{\rm{C}}_{\rm{C}}}\;*\;{{\rm{m}}_{\rm{C}}}} \over {{{\left( {{{\rm{m}}_{\rm{M}}} - {{\rm{m}}_{\rm{C}}}} \right)}^2}}}} \right)} \right]^2}$
 $ \!\!\!\!\!\!\!\!\!\quad\quad+ \;{\left[ {{\sigma _{{{\rm{F}}^{14}}{{\rm{C}}_{\rm{M}}}}}\;{{{{\rm{m}}_{\rm{M}}}} \over {{{\rm{m}}_{\rm{M}}} - {{\rm{m}}_{\rm{C}}}}}} \right]^2}\; + \;{\left[ {{\sigma _{{{\rm{F}}^{14}}{{\rm{C}}_{\rm{C}}}}}\;{{ - {{\rm{m}}_{\rm{C}}}} \over {{{\rm{m}}_{\rm{M}}} - {{\rm{m}}_{\rm{C}}}}}} \right]^2}$
A total chi-squared statistic was then defined as follow:
 ${\chi ^2} = \;{1 \over N}\;\sum\limits_{j = 1}^N \; \left[ {\;{1 \over n}\;\sum\limits_{i = 1}^n {{{{{\left( {{{\rm{F}}^{14}}{{\rm{C}}_{{\rm{Mji}}}} - \;{{\rm{F}}^{14}}{{\rm{C}}_{{\rm{consensusj}}}}} \right)}^2}} \over {{\sigma _{{{\rm{C}}_{{\rm{Mji}}}}^2}}}}} } \right]$
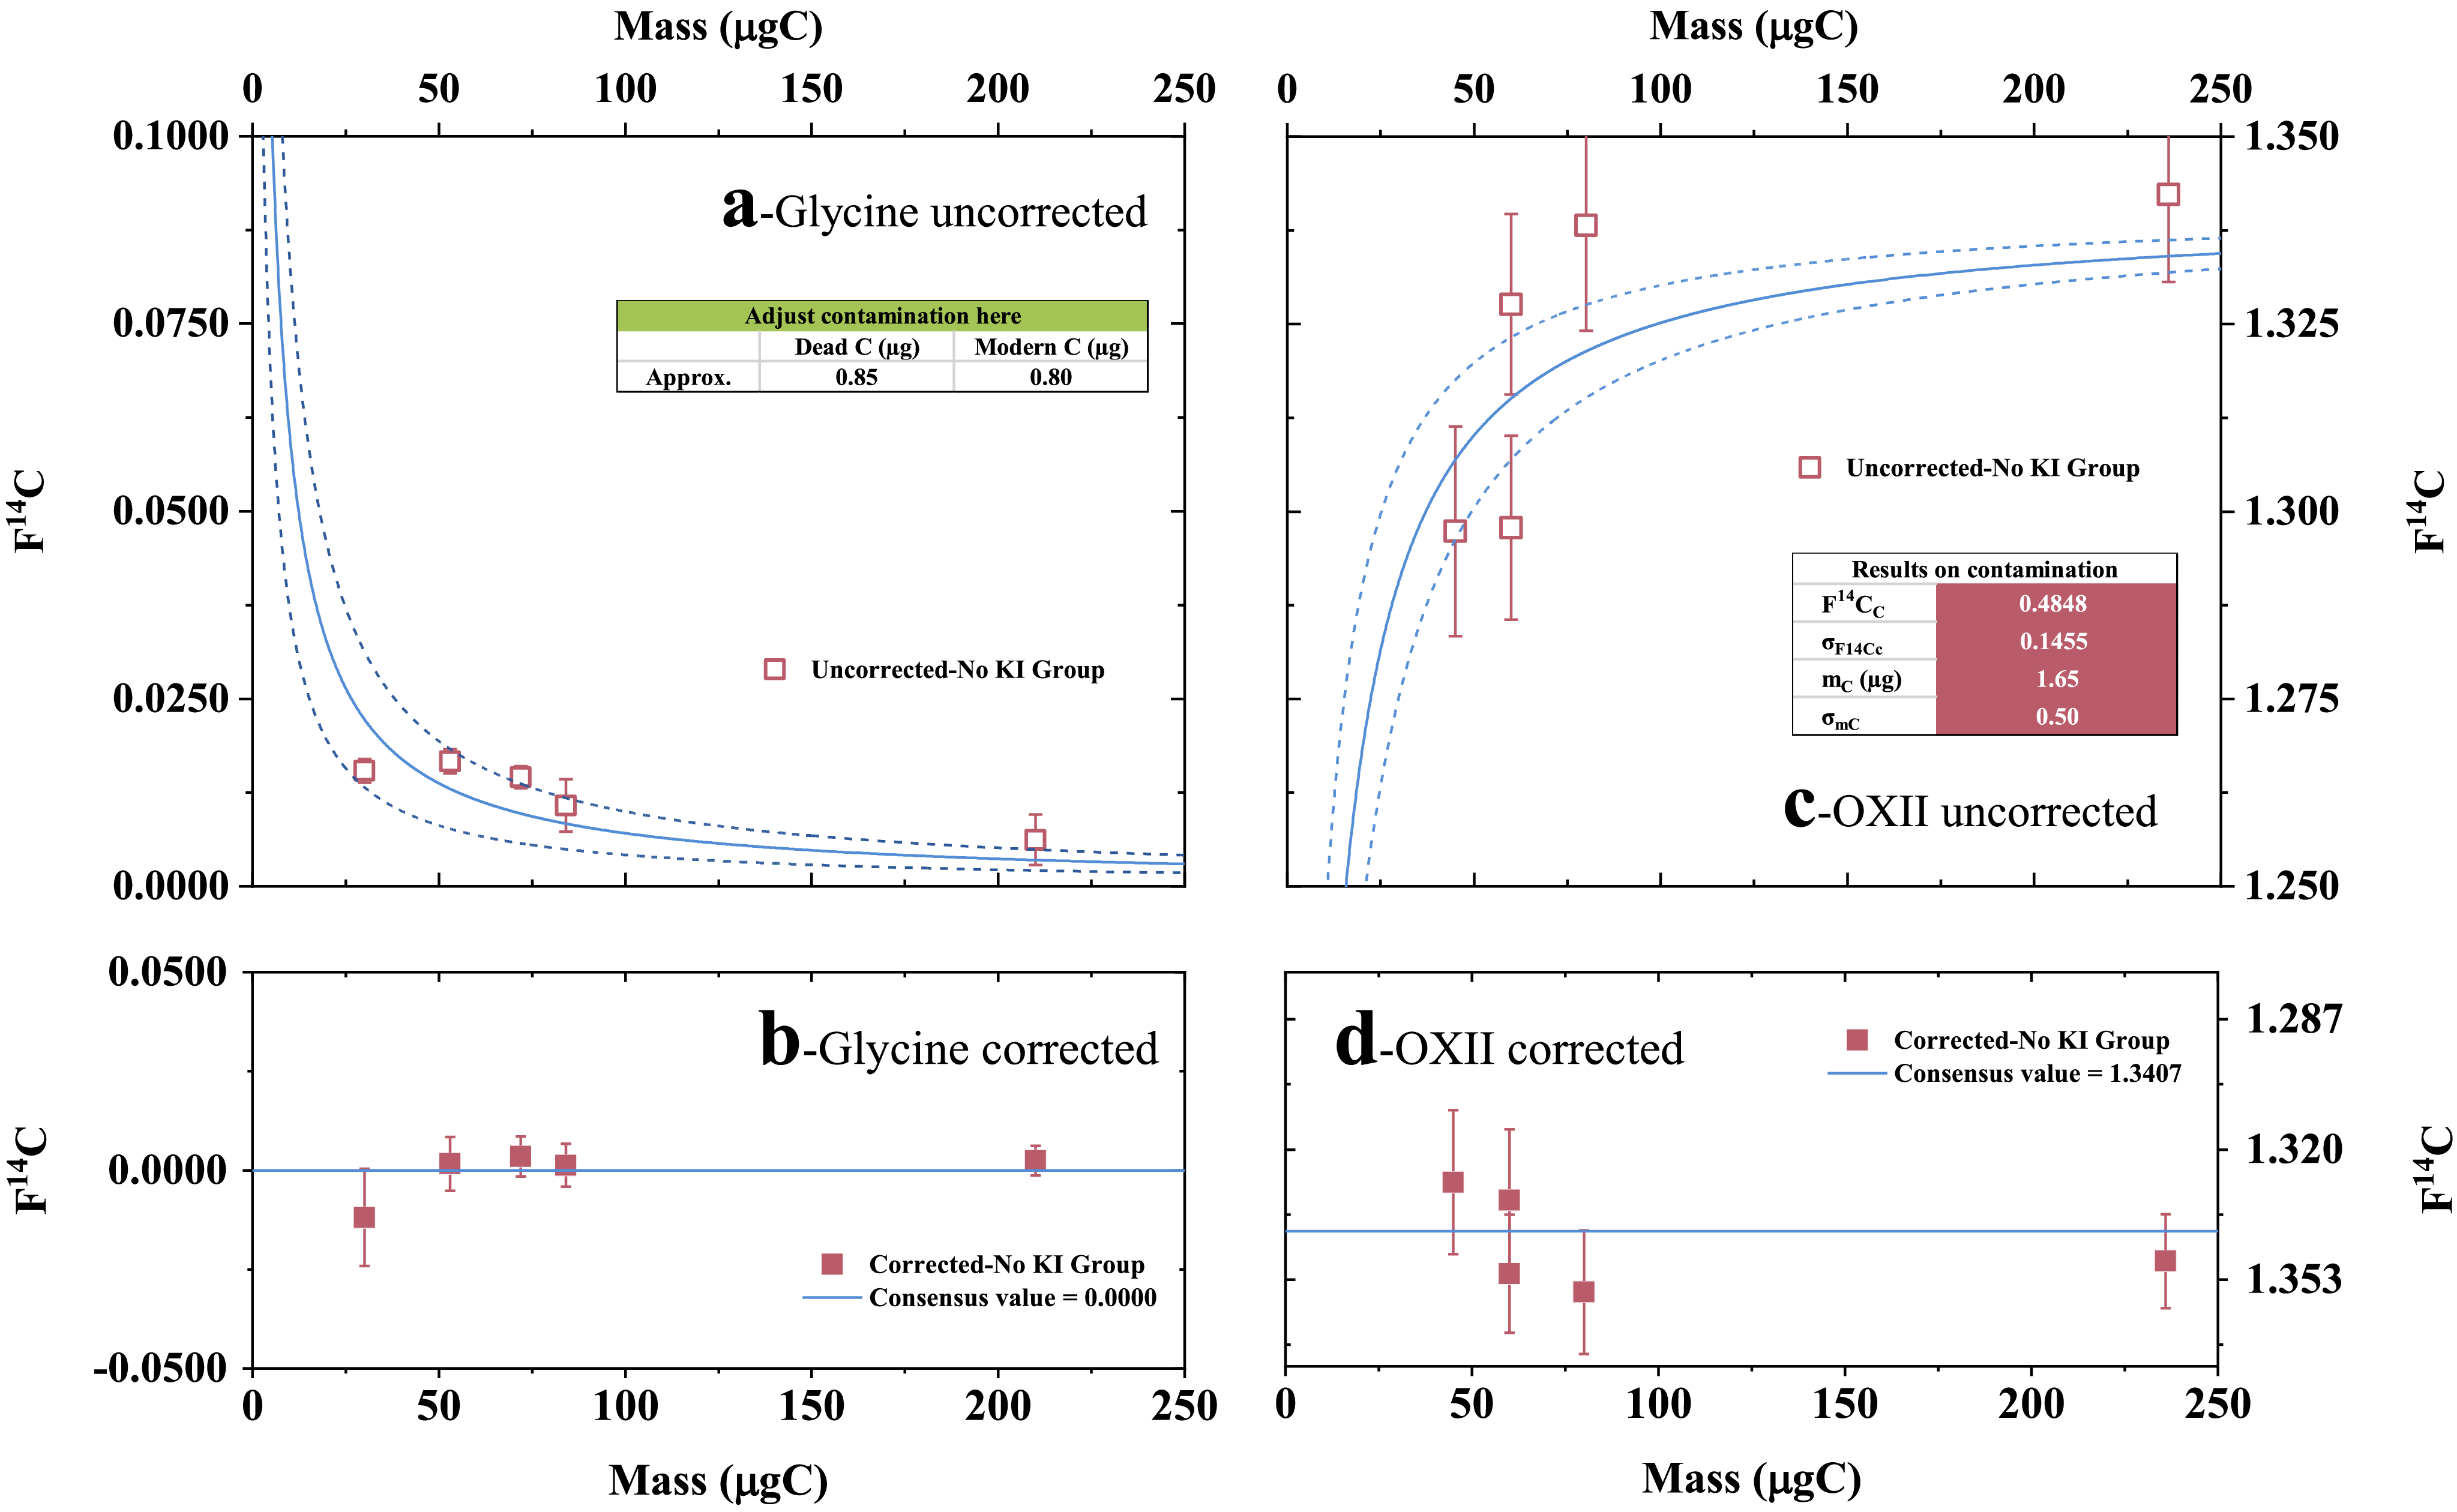
where F14Cconsensus is 1.3407 and 0.0000 respectively for OXII and glycine, n is the number of individual measurements, and N is the number of unique sample types (in this case, N = 2). The aim of the chi-squared statistic is to optimize curve fitting for data correction (Figure 1 and Figure 2), thereby constraining the masses of introduced modern and dead carbon contaminations and their corresponding F14C values (Xu et al. Reference Xu, Roberts, Elder, Kurz, McNichol, Reddy, Ward and Hanke2021).
Plots of F14C values versus mass for the two secondary standards by No KI approach, glycine (left, a and b) and OXII (right, c and d). The raw (uncorrected) data were plotted in the two upper panels, the corrected data in the two lower panels. The curves represent the estimated impact of a blank of 1.65 ± 0.50 μgC with F14C = 0.4848 ± 0.1455.

Figure 1 Long description
Panel A: Scatter plot of F14C values versus mass for glycine uncorrected. The x-axis represents mass in micrograms of carbon (μgC) ranging from 0 to 250. The y-axis represents F14C values ranging from 0 to 0.1. The plot includes red squares representing uncorrected data points and a blue line with dashed lines indicating the estimated impact of a blank. Panel B: Scatter plot of F14C values versus mass for glycine corrected. The x-axis represents mass in micrograms of carbon (μgC) ranging from 0 to 250. The y-axis represents F14C values ranging from -0.05 to 0.05. The plot includes red squares representing corrected data points and a blue line indicating the consensus value. Panel C: Scatter plot of F14C values versus mass for OXII uncorrected. The x-axis represents mass in micrograms of carbon (μgC) ranging from 0 to 250. The y-axis represents F14C values ranging from 1.25 to 1.35. The plot includes red squares representing uncorrected data points and a blue line with dashed lines indicating the estimated impact of a blank. Panel D: Scatter plot of F14C values versus mass for OXII corrected. The x-axis represents mass in micrograms of carbon (μgC) ranging from 0 to 250. The y-axis represents F14C values ranging from 1.275 to 1.35. The plot includes red squares representing corrected data points and a blue line indicating the consensus value.
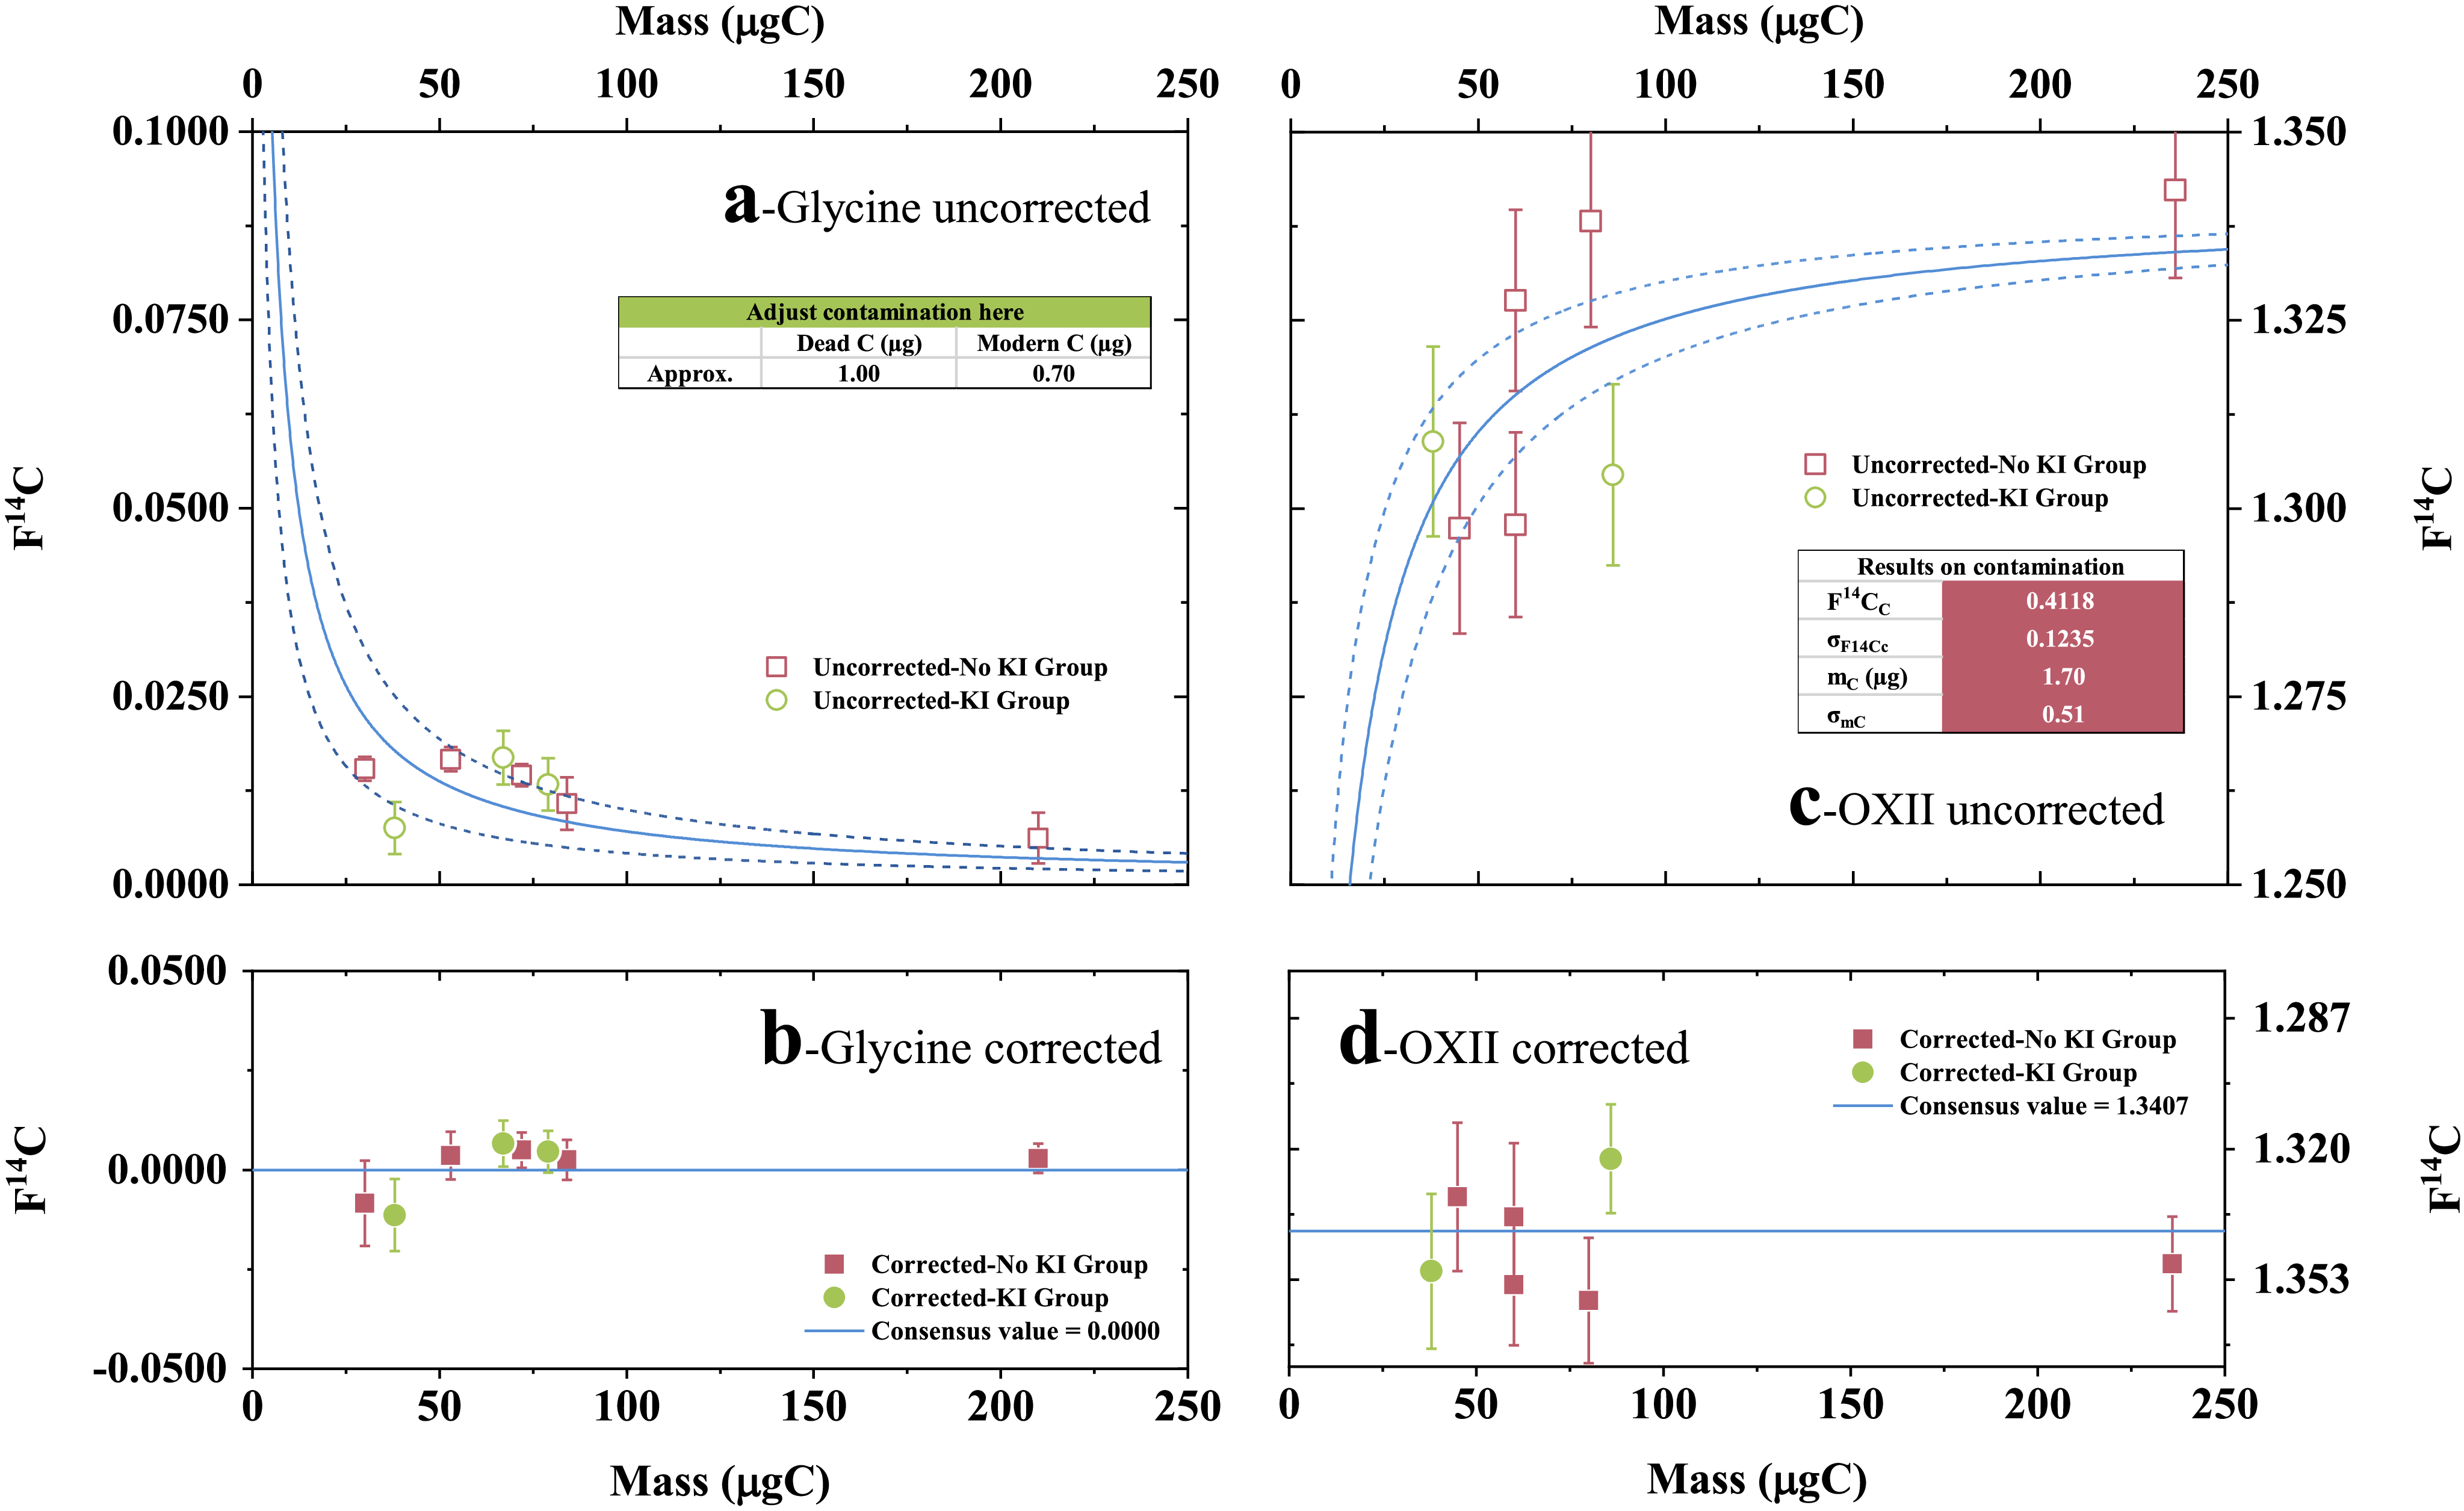
Plots of F14C values versus mass for the two secondary standards by No KI and KI approaches, glycine (left) and OXII (right). The raw (uncorrected) data were plotted in the two upper panels, the corrected data showed in the two lower panels. The curves represent the estimated impact of a blank of 1.70 ± 0.51 μgC with F14C = 0.4118 ± 0.1235.

3. Results and discussion
3.1. Procedure blank by the indirect approach
Following the modified approach for the purification and collection of UV-derived CO2 gas in freshwater DOC processing (No KI Group), the measured F14C values of secondary standard material solutions using the MICADAS showed very good reproducibility. The F14C values of glycine fall within the range of 0.0062 ± 0.0034 (210 μgC) to 0.0167 ± 0.0016 (53 μgC) with an average value of 0.0127 ± 0.0039 (n = 5, Figure 1a). The F14C values of OXII ranged from 1.2974 ± 0.0140 (45 μgC) to 1.3423 ± 0.0117 (236 μgC) with an average value of 1.3189 ± 0.0184 (n = 5, Figure 1c). Based on the mass balance model, the best fit to the results represented the procedure blank of 1.65 ± 0.50 µgC with F14C value of 0.4848 ± 0.1455 (Figure 1a, c). The uncertainty of both carbon mass and F14C value was assumed as ± 30% conservatively to have all F14C results fall within ± 2σ of the expected values (Figure 1), because the corresponding values of the generated small/ultra-small size CO2 target cannot be determined independently (Xu et al. Reference Xu, Roberts, Elder, Kurz, McNichol, Reddy, Ward and Hanke2021). After deducting the effects of carbon mass and carbon isotope compositions of procedure blank, the corrected F14C values of glycine ranged from –0.0120 ± 0.122 (30 µgC) to 0.0035 ± 0.0050 (70 µgC) with an average value of –0.0006 ± 0.0064 (Figure 1b), and the corrected F14C values of OXII were from 1.3283 ± 0.0183 (45 µgC) to 1.3515 ± 0.0150 (60 µgC) with an average of 1.3434 ± 0.0122, (Figure 1d), The differences between the corrected data and the accepted values were –0.0006 for glycine and 0.0027 for OXII, respectively. Thus, our results demonstrated that this modified CO2 purification and collection approach is applicable for radiocarbon measurements of small/ultra-small freshwater DOC samples because the introduced extraneous contamination is low (< 2 μgC).
We only obtained two F14C values for OXII, and three F14C values for glycine, respectively, for the data correction for the limited number of marine DOC samples (KI Group). The carbon masses of each standard material did not vary significantly, ranging from 38 μgC to 86 μgC, and the F14C data also showed very good reproducibility. The measured uncorrected F14C values by MICADAS ranged from 0.0075 ± 0.0035 (38 μgC) to 0.0169 ± 0.0036 (67 μgC) for glycine, and 1.3045 ± 0.0121 (38 μgC) to 1.3089 ± 0.0126 (86 μgC) for OXII, respectively. We still make the data correction to for the limited number of measurements to force the raw radiocarbon data close to the accepted values (Figure 2). The results showed that the carbon mass of procedure blank of salty water treatment was slightly higher than that of freshwater processing, and the best fit represented the procedure blank of 1.70 ± 0.51 µgC with the corresponding F14C value of 0.4118 ± 0.1235, and the uncertainty of carbon mass and isotopic signature was also assumed as ± 30% to make all F14C results fall within ± 2σ of the expected values (Figure 2a, 2c). After the data correction, the F14C values of glycine ranged from –0.0114 ± 0.0091 (38 μgC) to 0.0066 ± 0.0059 with an average value of –0.0002 ± 0.0098 (n = 3), and the F14C values of OXII were from 1.3225 ± 0.0137 to 1.3509 ± 0.0196 with an average of 1.3367 ± 0.0201, respectively (Figure 2b, 2d). And the offset between the corrected data and the accepted values were –0.0002 for glycine and –0.0040 for OXII, respectively. The published work typically quotes ∼10% as high precision for EA-GIS-AMS measurements (small CO2 gas, Wang et al. Reference Wang, Zhang, Ning, Xu and Zhao2023), however, the measurement uncertainties in our study ranged from 4‰ to 11‰ for glycine and over 10‰ for OXII, respectively. The relatively large uncertainties for sample results are due to counting statistics (small sample sizes and ages), as indicated from that the F14C coefficients of variations (standard deviation/sample mass) increased with deceasing carbon masses of samples for both glycine and OXII, and glycine tended to have smaller F14C coefficients of variation (Figure S1).
The clustered scatter distributions were very close when plotting the raw and corrected radiocarbon data of the No KI Group (pink symbols) and the KI Group (green symbols) (Figure 2). However, detailed comparison revealed an addition of 0.15 μgC of dead carbon and a reduction of 0.10 μgC of modern carbon with the processing the marine DOC samples. Thus, the extraneous carbon introduced by KI trap was very low with carbon mass of 0.05 μgC and F14C value of 1.0005 (Figure 1a, c; Figure 2a, c). Indeed, the carbon masses of procedure blank of the modified approaches were consistent with previous reported data measured directly on the vacuum line (< 3 μgC, Xue et al. Reference Xue, Ge and Wang2015), and comparable to or lower than the procedure blank by similar processing in other institutes (≤ 2 μgC, Beaupré et al. Reference Beaupré, Druffel and Griffin2007; 2.6 ± 0.6 μgC, Xu et al. Reference Xu, Roberts, Elder, Hansman, Gagnon and Kurz2022). Although the procedure blanks from both methods exhibited statistically identical carbon masses and F14C values, we still recommend using different CO2 purification and collection methods when processing samples with different salinities for the following reasons. The processing without the KI trap is relatively simple, but remains restricted to freshwater DOC. While the whole system equipped KI trap could process both salty and freshwater samples, this configuration introduces risks of KI solution eruption into the post-trap vacuum line due to pressure differences. Meanwhile, to minimize the impact of UV-generated chlorine and bromine on the following measurement, the KI trap must be equipped when sample salinity is greater than zero. Therefore, our approaches are robust for radiocarbon measurements of small/ultra-small DOC samples with different salinities.
3.2. The performance of MICADAS for field DOC samples
The field DOC samples were divided into No KI Group (freshwater) and KI Group (marine water) based on the salinities, and the detailed methods of vacuum purification and collection of generated CO2 were listed in Table S1. The carbon mass of UV-irradiation derived CO2 ranged from 86 μgC to 126 μgC for freshwater samples and from 30 μgC to 88 μgC for marine water samples, respectively. The standard masses were not chosen to match the sample masses, although the carbon masses of field DOC samples fall within the range of carbon masses of standards. Because the carbon masses of field DOC samples were dependent on the DOC concentrations, processed sample volume during UV-oxidation, as well as oxidation efficiency (exceeding 95% on average as validated in our methodology, Xue et al. Reference Xue, Ge and Wang2015). And a series of carbon masses in small/ultra-small size range of standards were used to estimate the procedure blank accurately.
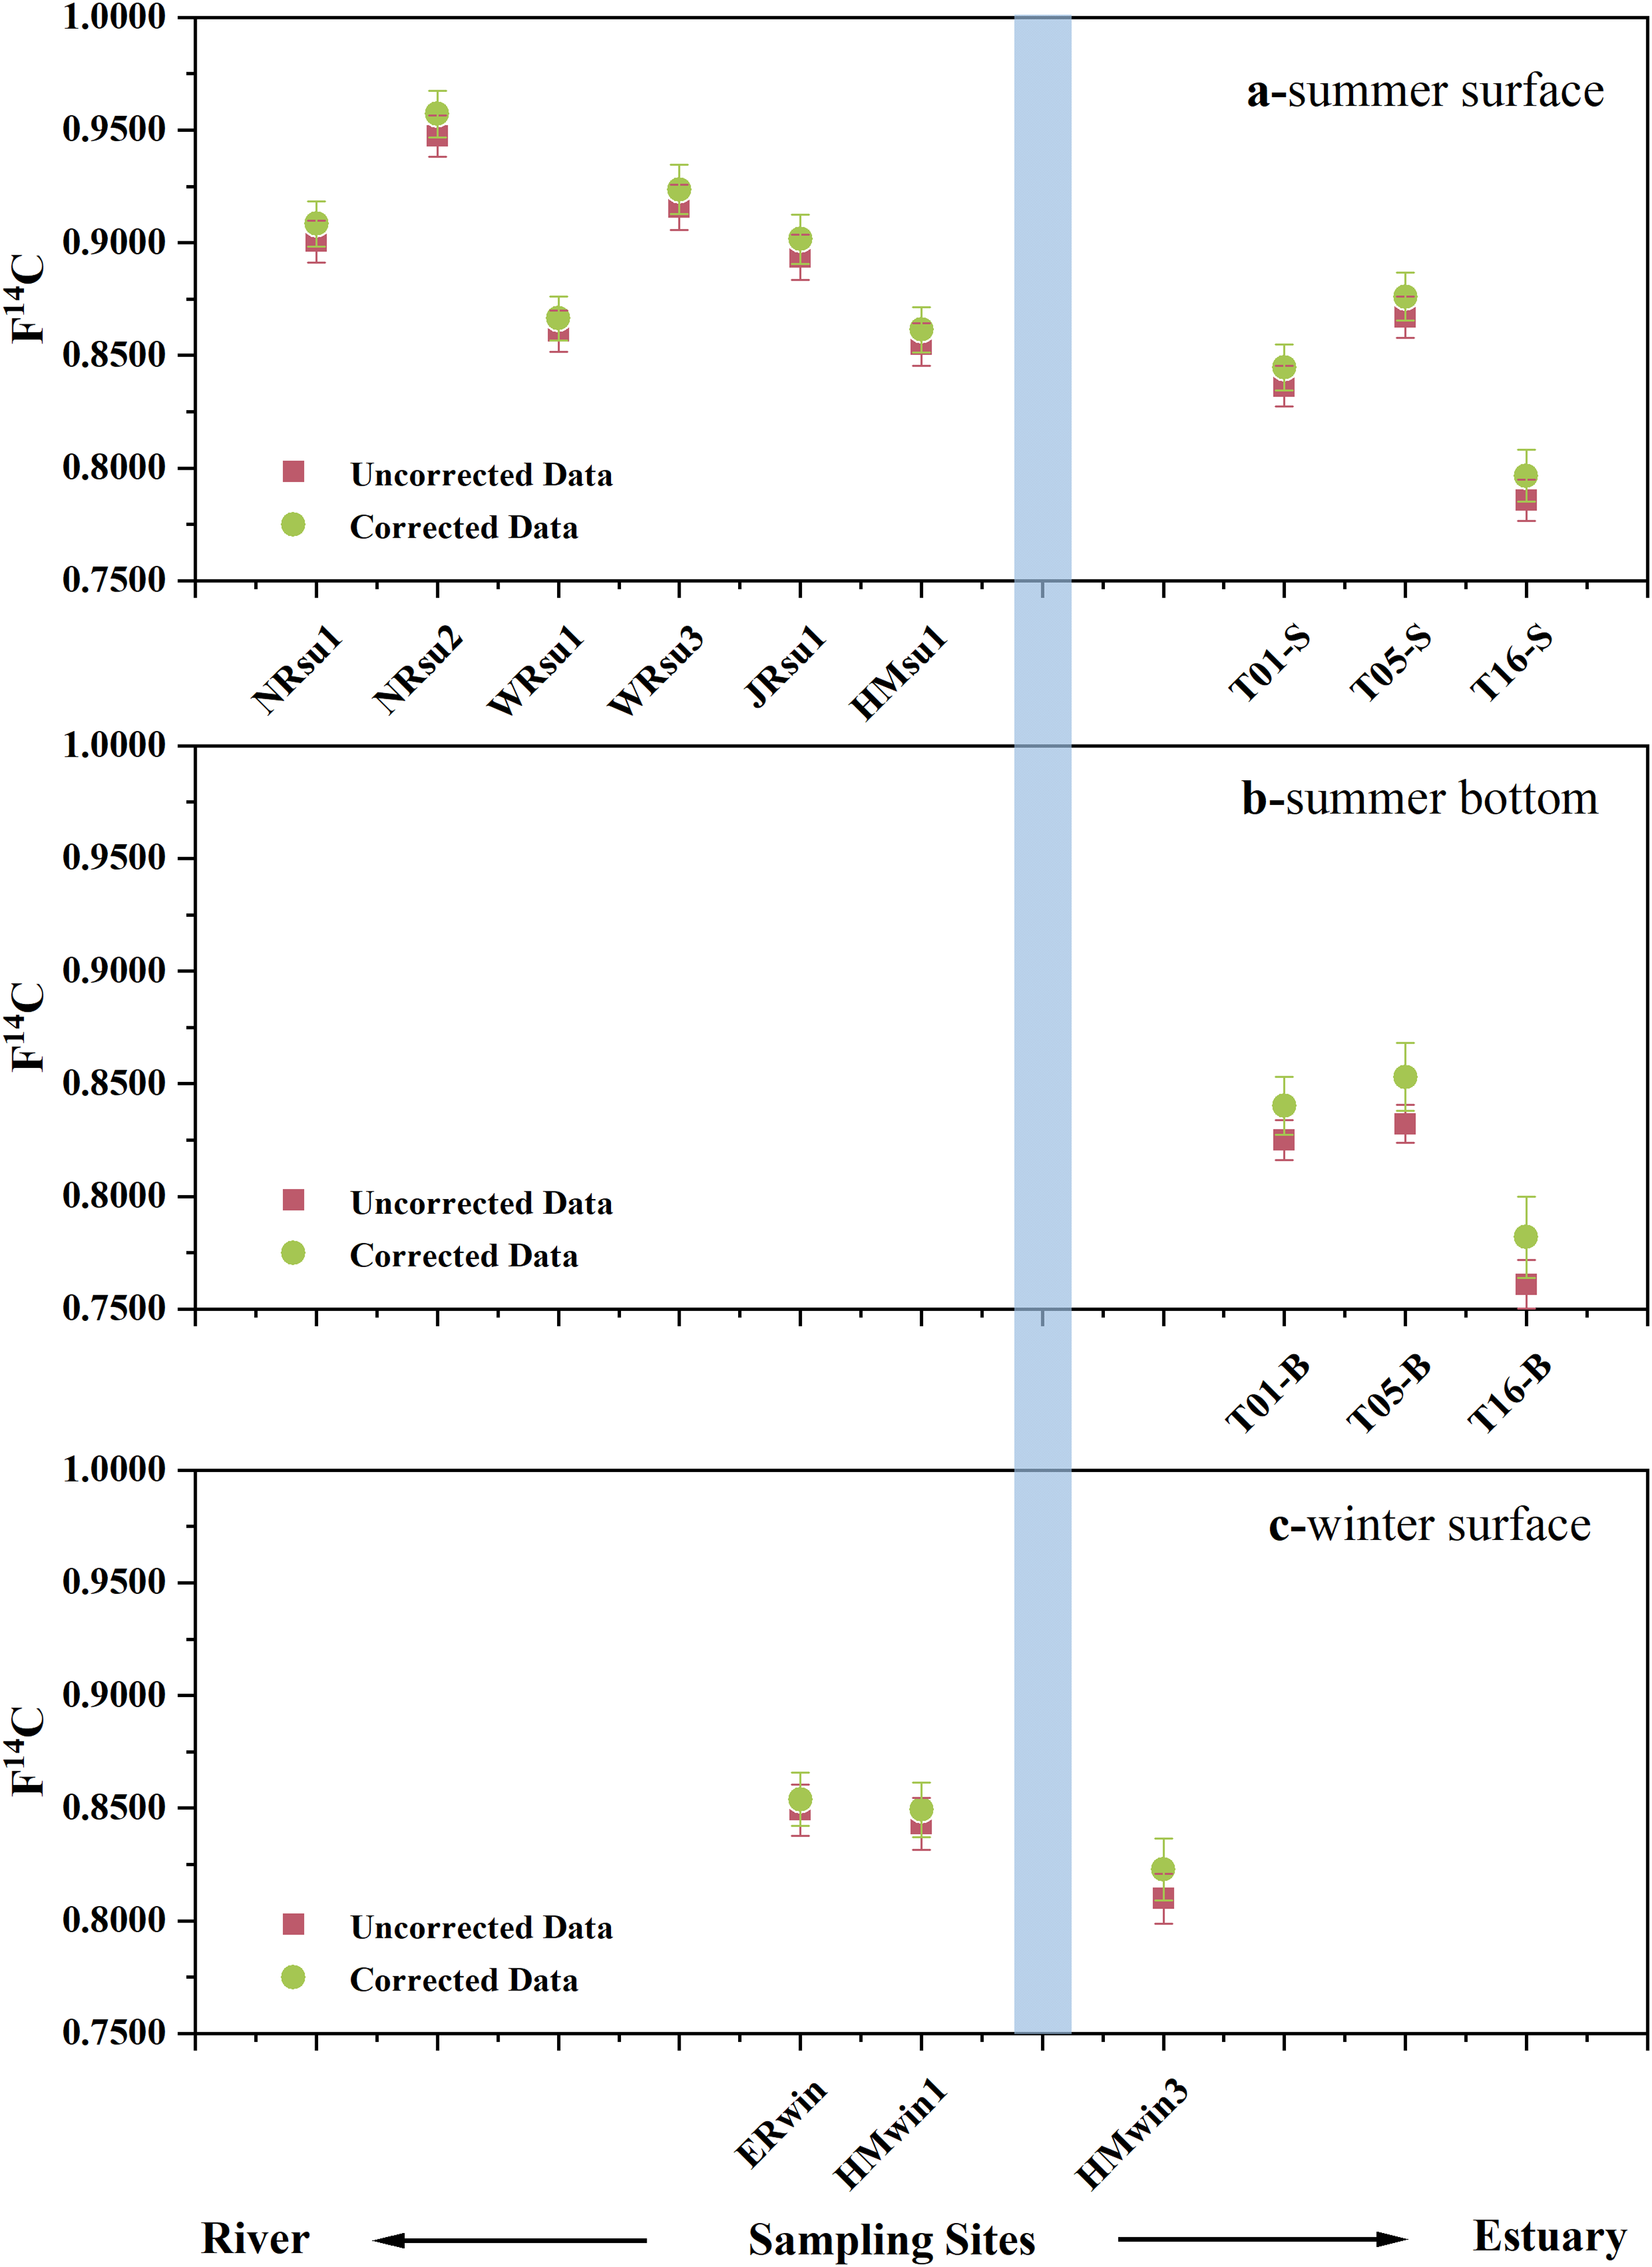
The data correction for each field sample followed corresponding blanks, and the differences were small between corrected data (pink) and raw data (green) (Figure 3). Our results were the first reported DOC radiocarbon data of field DOC samples for small/ultra-small size measured by MICADAS at OUC-CAMS with gaseous CO2 as the measurement target. The corrected F14C values ranged from 0.8492 ± 0.0121 (98 μgC) to 0.9571 ± 0.0103 (79 μgC) for freshwater DOC samples in the Pearl River (S = 0, Table S1), which were consistent with reported DOC F14C values in the West River (an average of 0.8765, Qi et al. Reference Qi, F, Tia, Luo, Shan, Sun, Ren, Zhang, Liu, Zhang and Wang2020). The corrected F14C values ranged from 0.7819 ± 0.0181 (30 μgC) to 0.8760 ± 0.0102 (87 μgC) for the marine DOC samples in the Pearl River Estuary-northern South China Sea (S > 0). As plotted in Figure 3, the F14C values of DOC decreased with increasing salinity and water depth, which were comparable to the spatial distribution of DOC F14C values in other Chinese river-estuary-coastal ocean continuum (Raymond and Bauer Reference Raymond and Bauer2001; Xue et al. Reference Xue, Zou, Ge and Wang2017; Qi et al. Reference Qi, F, Tia, Luo, Shan, Sun, Ren, Zhang, Liu, Zhang and Wang2020). Therefore, we demonstrated that the performance of radiocarbon measurement of gaseous CO2 in small/ultra-small size by MICADAS could meet the radiocarbon measurement requirements for DOC samples in the river-estuary-coastal ocean continuum.
The raw/uncorrected (pink square) and corrected (green circle) F14C values of field DOC samples with different salinities from the earl river-estuary-northern South China Sea continuum in 2021–2022. The blue rectangular in the three panels separates the freshwater and marine water samples.

Spatial distribution patterns of DOC F14C reflect the sources and reveal the transportation and sequestration mechanism of terrestrial DOC in the river-estuary-coastal ocean continuum (Raymond and Bauer Reference Raymond and Bauer2001; Trumbore and Druffel Reference Trumbore, Druffel, Zepp and Sonntag1995; Xue et al. Reference Xue, Zou, Ge and Wang2017). Overall, the younger OC from fresh terrestrial biomass in the rivers and recently-fixed marine biomass in the estuary-coast regime dominated the DOC in the Pearl River-Estuary-northern China Sea continuum, resulting in the relatively young DOCs in this region (with average F14C values of 0.8624 ± 0.0139) (Chen et al. Reference Chen, Yi, Fu, Liang, Li, Wang, Zhang, Dong, Li, Xu and He2024; Xue et al. Reference Xue, Zou, Ge and Wang2017; Yi et al. Reference Yi, Li, Zhong, Wang, Merder, Bao, Qi, He, Xu, Dittmar and Liu2024). Specifically, different vegetation coverages and sampling seasons are also the control factors for the measured F14C values of DOC in the Pearl River basin (Marwick et al. Reference Marwick, Tamooh, Teodoru, Borges, Darchambeau and Bouillon2015). The vegetation coverage in the western area was higher than that in the eastern region (Wang et al. Reference Wang, Chen and Y2006), and the input of the recently fixed OC was much reduced in the winter. Consequently, the DOC samples collected from the North River (NRsu1, NRsu2), the West River (WRsu1, WRsu2) and the confluence of these two rivers Sixianjiao waterway (JRsu1) in the summer of 2021 had relatively young 14C ages comparing to the DOC sample collected from the East River in the winter of 2022 (Figure 3a, c). And the apparent F14C values of DOC in the mouth of the North River in winter (HMwin1) were lower (0.8449 ± 0.0121) comparing with that in summer (HMsu1, 0.8614 ± 0.0101) to some extent (Figure 3a, c). Apart from that, along the transect from Humen to the north of the South China Sea, the DOC was getting older with the weakening of the Pearl River plumes (Figure 3a). Because the young labile DOC fractions were consumed rapidly by photodegradation and biotic degradation, and the contributions of the older DOCs derived from the open ocean were increasing (Bianchi, Reference Bianchi2011; Canuel and Hardison Reference Canuel and Hardison2016). And in the stratified water column, the young DOC delivered by the Pearl River plumes had stronger effects on surface water and the recently-fixed DOC was produced in the euphotic zone (Carlson and Hansell Reference Carlson, Hansell, Hansell and Carlson2015; Meng et al. Reference Meng, Dai, Cao, Wu, Zhao, Li, Chen and Gan2017), resulting in the F14C values of DOC in the surface water being slightly higher than those in the bottom water (Figure 3a, b).
4. Conclusions and implications
Modified approaches were used to process small/ultra-small DOC samples with different salinities, and the generated CO2 was further measured by MICADAS directly. The procedure blanks were estimated by the indirect approach, which revealed similar results. For freshwater DOC processing, 1.65 ± 0.50 µgC contamination was introduced with F14C value of 0.4848 ± 0.1455; and for marine DOC sample processing, the blank was slightly higher with 1.70 ± 0.51 µgC and F14C values of 0.4118 ± 0.1235. Thus, the carbon masses of the two procedure blank were both low (< 2 μgC) and met the requirements of the small/ultra-small CO2 gas measurement by MICADAS with high analytical precision. Our modified methods provided an efficient way to obtain radiocarbon data for small/ultra-small natural DOC samples with high throughput, and the data could help to achieve high spatial resolution DOC cycle studies in terms of sources, transformation and fates.
Supplementary material
To view supplementary material for this article, please visit https://doi.org/10.1017/RDC.2026.10216.
Acknowledgments
We thank Peng Peng, Chuanli Zhang, Xiaohan Bao, Jiaxuan Cui, Tiehan Huang for their help with sampling and in situ processing, Chunle Luo and Hongmei Zhang for their help with laboratory assistance. We thank the staff at the OUC-CAMS for the carbon isotope analyses of the samples. We thank Dr. Xiaomei Xu (the University of California, Irvine, Department of Earth System Science) for her comments and suggestions for the manuscript revision. We also thank the editors and two anonymous reviewers for their professional comments, which have improved the quality of the manuscript significantly. Financial support for this work was provided by the National Natural Science Foundation of China (grants no. 42230412 and 42306048).
Declaration of competing interest
The authors declare that they have no conflict of interest.