


1. Introduction
Ideally, temperature measurements should not be influenced by radiation. This is achievable using very small sensors protected from radiation by a shield enabling airflow around the sensor. Airflow is modified in a shield, so the shield must be equipped with artificial ventilation (aspiration) to provide airflow around the sensor when wind speed is low. These requirements are well known but can only be fulfilled when sufficient power is provided for the aspirator (e.g. by batteries, solar panels or a power generator). However, it is not always possible to install and maintain the constant power supply required for long-term, high-frequency temperature measurements, particularly at remote field sites in arctic or alpine regions.
If aspiration is not available, interpretation of temperature measurements becomes more problematic. For instance, Reference Schieldge, Halberstam, Colbeck and RaySchieldge and Halberstam (1979) reported lapse conditions above 0.25 m over a melting snow cover at noon. In a more detailed study (Reference Halberstam and SchieldgeHalberstam and Schieldge, 1981), they explained an observed warm air layer over snow with radiant flux divergence. Reference Male and GrangerMale and Granger (1981) also mentioned the existence of a warm air layer adjacent to the snow surface caused by radiative heating of the air. In none of these studies were the temperature sensors aspirated (at least aspiration is not mentioned). Reference Marks, Dozier and DavisMarks and others (1992) recognized the problem of radiation errors with shielded, naturally ventilated temperature sensors. After carefully evaluating wind speed and air temperature, they noted those times when radiation errors may have occurred, but they could not determine the magnitude of the measurement error since no other independent temperature measurement was made at the time.
To determine sensible-heat flux over snow, accurate air-temperature data are required if the flux is not directly measured by an eddy-covariance system. Field investigations carried out in Spitsbergen, Svalbard (Reference SchererScherer, 1994), and Swedish Lapland (e.g. Reference Gude and SchererGude and Scherer, 1995, Reference Gude and Scherer1999; Reference Scherer, Gude, Gempeler and ParlowScherer and others, 1998) showed that sensible-heat flux significantly contributes to and thus intensifies snowmelt, especially in weather conditions where there is positive net radiation and advection of warm air. In such periods of intensified snowmelt, slushflows, which can reach catastrophic magnitudes and form a major natural hazard, are often released in some areas, particularly at high latitudes. Thus, it is more than merely a scientific task to utilize temperature measurements over snow, which are often made using naturally ventilated instruments to determine sensible-heat flux and snowmelt rates.
2. Research Area, Instrumentation and Measurements
Measurements were carried out during the snowmelt season in May and June in the Kärkevagge, Abisko Mountains, Swedish Lapland. The Kärkevagge is 5 km long and is orientated in a north-northwest–south-southeast direction (Fig. 1). A meteorological mast was installed in the snow-covered valley bottom (Valley Station, 720 m a.s.l.). Air temperature and relative humidity were measured at five levels (Fig. 2) by shielded, naturally ventilated Vaisala HMP35A instruments, which contain a capacitance relative-humidity sensor and a precision thermistor. A membrane filter protects both sensors. The upper half of the HMP35A is screwed inside a white, cylindrical radiation shield from R. M. Young. The shield consists of a series of sloped lamellas (Fig. 3a), allowing natural ventilation and protecting the sensor from downwelling radiation. Unfortunately, some upwelling shortwave radiation reaches the sensor, and influenees the measurements, especially over snow-covered surfaces with their high albedo.
Image of investigation area. (Source: National Land Survey, Sweden.)

The instrument set-up at the Valley Station during the field campaign in 1998.

(a) Vaisala HMP35A relative humidity and temperature probe installed within a radiation shield. Temperature and humidity sensor are installed near the top of the shield and protected by a membrane filter. The radiation shield consists of a series of sloped lamellas allowing natural ventilation and protecting the sensor from downwelling radiation but enables some upwelling shortwave radiation to reach the sensor. (b) The psychrometer used in this study. PT100 sensors are installed inside the cylindrical, nickel-plated tubes. Air is aspirated by a fan through the openings, which almost completely prevent shortwave radiation from reaching the sensors.

Psychrometers were installed at the lowest, middle and highest levels to acquire accurate, concurrent air-temperature data (Fig. 2). The psychrometers consist of two platinum PT100 sensors surrounded by double-wall, cylindrical, nickel-plated tubes for radiation protection. A fan aspirates air through these tubes to ventilate the sensors (Fig. 3b). These temperature measurements were used together with 1 min data of wind speed and upwelling shortwave radiation to analyze radiation errors in air-temperature data measured by the naturally ventilated Vaisala instruments (called Vaisala for short in the following). Wind speed was measured with cup anemometers (Vaisala anemometer WAA15A) at five levels, while wind direction (Schiltknecht wind vane), global radiation, upwelling shortwave radiation (both Kipp & Zonen GM11-Pyranometers) and net radiation (Schenk 8111-Pyrradiometer) were measured at one level (Fig. 2). All data were measured every 30 s, and 1 min averages were recorded.
3. Data Pre-Processing and Error Analysis
Differences between naturally ventilated and aspirated air temperatures were analyzed using 1 min data at levels 1 and 5, measured during the period 28 May–6 June 1998. The psychrometer data at level 3 were not used in this study, since an analysis revealed measurement problems reducing the reliability of this temperature time series.
3.1. Data pre-processing
The first investigation concerns the response times of the two air-temperature measurement systems, which for the Vaisala depend on natural ventilation inside the radiation shield, in contrast to the fan-driven constant airflow around the PT100 sensors of the psychrometers. Psychrometer data, showing larger fluctuations than the Vaisala data due to shorter response times, were convolved with a Gaussian kernel using filter lengths of 1–30 min and were then correlated with Vaisala data. The following convolution formula was used:

where Fi are filtered data, Oi are original data, N is filter length, Kt is kernel, given by Kt = e[t ln 0.1/(N−1)], and S is total of kernel.
A comparison of convolved psychrometer and Vaisala data from the highest level is presented in Figure 4. The best agreement, i.e. the minimum of the standard deviation (SD) and the maximum of the coefficient of determination (r2 ), respectively, is achieved using an 8 min filter length. A 12 min filter length was determined for the psychrometer data at level 1. Low-pass filtered psychrometer data were used throughout in the following.
Comparison of convolved psychrometer temperatures using different filter lengths with Vaisala data measured at level 5. The best agreement, i.e. the minimum of the SD (solid line) and the maximum of the coefficient of determination (r 2, dotted line) is achieved using a filter length of 8 min.

The next step of data pre-processing was to determine offsets between the Vaisala and psychrometer temperatures, some of which resulted from the vertical displacement of 24 cm between the two sensors. Another source of offset could have been an electronic effect in the wires or connections. Periods were determined in which shortwave radiation was small, i.e. upwelling shortwave radiation was ≤10 W m−2, and the Vaisala was well ventilated, i.e. wind speed was >10 m s−1. Mean differences during these periods were calculated for levels 1 and 5. The offset between the Vaisala and psychrometer temperatures was 0.84 K at level 1 and 0.17 K at level 5. The corresponding offsets were removed from the temperature data.
3.2. Error analysis
A comparison reveals that psychrometer and Vaisala temperatures agree better at level 5 (r 2 = 0.92) than at level 1 (r 2 = 0. 84), which may be due to higher wind speed (level 5: 6.1 m s−1; level 1: 4.7 m s−1) and thus better ventilation of the Vaisala at level 5. Because airflow at level 1 could also have been disturbed by the datalogger box installed nearby, the following investigation concentrates on the results from level 5.
Figure 5 shows air-temperature data averaged over 30 min measured by the Vaisala and the psychrometer at level 5 from 28 May until 6 June. During the nights, both temperature series coincide quite well, but during the daytime the Vaisala temperature is higher than the psychrometer temperature and shows strong variability. On 29 May and 4 and 5 June, differences are <1.3 K; but on 30 May and 1 and 3 June, differences are larger, with a peak of 3.8 K on 30 May. For this day (marked by vertical lines in Fig. 5), 1 min differences of Vaisala and psychrometer temperatures are displayed in Figure 6a together with the influencing variables in detail (Fig. 6b and c).
Air temperatures (30 min means) measured by a Vaisala (dotted line) and a psychrometer (solid line) at level 5.

(a) Differences between Vaisala and psychrometer temperatures, (b) wind speed, (c) upwelling shortwave radiation. These are 1 min values measured on 30 May.

As long as upwelling shortwave radiation is small, i.e. in the early and late hours of the day, temperatures are almost identical, independent of wind speed. During the day, large temperature differences are always connected with low wind speed. Highest temperature differences were observed during the time interval 1000–1100 h, when wind speed varied around 1 m s−1 and upwelling shortwave radiation was about 400 W m−2. When wind speed increased at 1100 h, the temperature difference dropped below 2 K, although upwelling shortwave radiation remained large.
4. The Correction Method
4.1. Error modelling
A conceptual scheme of a temperature sensor is illustrated in Figure 7. Ideally, ambient (true) air temperature, temperature at the sensor surface and measured temperature are identical. If radiation heats the sensor, then surface temperature rises, and two heat fluxes are established. One (sensible-heat flux) exchanges heat between the sensor surface and the ambient air, while the other (storage-heat flux) conducts heat between the surface and the interior of the sensor. For a certain time interval ti , the difference between measured and ambient air temperatures can be written as

where ΔTM −S is the difference between measured and sensor-surface temperature (K), and ΔTS −A is the difference between sensor-surface and ambient air temperature (K).
Temperature sensor scheme and relevant heat fluxes. Ideally, there is no difference between the ambient air, the sensor surface, and the measurement point inside the sensor. If radiation heats the sensor surface, heat is exchanged between the sensor surface and the ambient air, as well as between the surface and the interior of the sensor, setting up a new temperature balance.

The first difference can be replaced by the storage-heat flux, which is negative if T S > T M and is defined by

where p S is the percentage of sensor surface that is influenced by storage-heat flux, λ is the thermal conductivity (W m−1 K−1), and r S is the sensor radius (m).
Additionally, S S(ti ) can be expressed by the energy-balance equation assuming that evaporation is negligible:

where
 is net radiation at the sensor, and H
S is sensible-heat flux at the sensor.
With Equations (3) and (4), Equation (2) can be written as

As reported by Reference SchererScherer (1994), radiation errors are not driven by downwelling but by upwelling shortwave radiation and thus cease to be significant after snowmelt ends. Furthermore, it is assumed that net longwave radiation does not contribute significantly to the radiation error, which results in the following equation for net radiation at the sensor:

where α is albedo of the sensor,
 is upwelling shortwave radiation, and p
R is percentage of the sensor surface influenced by radiation.
Sensible-heat flux at the sensor can be written as

where p H is percentage of the sensor surface influenced by sensible-heat flux, ρ A is air density (kg m−3), c p is specific heat capacity of air (J kg−1 K−1), k H(ti ) is heat-transfer coefficient, which is a function of u(ti ), ΔTS −A (ti ) is the difference between the sensor-surface and the ambient air temperature (K), and Δz is the scaling length.
Because the sensor is mounted in a radiation shield, wind speed inside the shield, which is not the same as the ambient wind speed, must be used to parameterize k h(ti ). Reference Richardson, Brock, Semmer and JirakRichardson and others (1999) did detailed investigations on the modification of the airflow inside radiation shields. They describe the ratio of flow speed through the centre of the shield (averaged over the height of the shield) to the wind speed outside the shield by the so-called flow efficiency. Flow efficiency of a flat-plate shield is fairly constant when wind speed is > 1 m s−1, but falls off rapidly as wind speed decreases below 1 m s−1 (Reference Richardson, Brock, Semmer and JirakRichardson and others, 1999). With respect to flow efficiency, the heat-transfer coefficient is calculated by the following function:

where k u is the coefficient for wind speed (s, or m1.5 s−0.5), F(u out(ti )) is the flow efficiency function, which describes wind speed inside the shield, u in(ti ) is the wind speed inside the shield (m s−1), u out(ti ) is the ambient wind speed outside the shield (m s−1), and u ref is the scaling parameter for flow efficiency.
Using Equations (6–8), Equation (5) can be written as

where

and

If
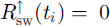 , then differences between measured and ambient air temperature result only from already existing temperature differences between sensor surface and ambient air caused by previous radiation errors that are not yet compensated by the heat fluxes.
Because the temperature difference between the sensor surface and the ambient air at time ti is unknown, it is assumed to be equal to the difference between measured and ambient air temperature at time interval ti −i, i.e.

ΔTS −A (ti −1) is calculated with Equation (10) again, using wind speed and upwelling shortwave radiation at time interval ti −2. This approximation is continued up to time ti −N−1. At that time, it is assumed that ΔTS −A (ti −N ) = 0, i. e. the temperature difference between the sensor surface and the ambient air at time ti −N should make no significant contribution to the temperature difference between measured and ambient air at time ti .
The parameters N, f u, f R and u ref are varied until a minimum is obtained in the SD between the modelled temperature difference and the temperature difference between Vaisala sensor and ambient air. The search for this minimum, and thus for the optimal set of parameters, is carried out automatically using the Powell method (Reference Press, Teukolsky, Vetterling and FlanneryPress and others, 1992).
4.2. Automatic error detection
Data on temperature differences between the Vaisala sensor and the ambient air are required to determine the parameters N, f u, f R and u ref in Equation (9). These data are provided by a method that automatically detects errors in the temperature measurements for those times clearly influenced by radiation. In a first step, all times are determined in which upwelling shortwave radiation is >20 W m−2 and wind speed is < 8 m s−1. In a second step, air temperature is interpolated between the last undisturbed air-temperature measurement before and the first undisturbed air-temperature measurement after each period of measurements influenced by radiation. There are three further criteria. First, before and after each detected period, there must be a period of 10 min of undisturbed air-temperature measurements to ensure that there is no radiation error on the first and last points of the interpolation. Second, in each detected period, the maximum difference between the measured and interpolated air temperatures must be >1 K, since only periods with such significant radiation errors are used. Finally, each detected period must not exceed 5 h, in order to avoid errors due to trends in ambient air temperature.
4.3. Error correction
Summarizing the above-mentioned procedures, the error correction works as follows:
1. Automatic detection of errors in the temperature measurements for those times clearly influenced by radiation.
2. Optimization of the parameters N, f R, f u and u ref using the temperature errors that have been automatically detected.
3. Numerical modelling of the temperature errors of the whole time series using Equation (9).
4. Removal of modelled errors from uncorrected temperature time series.
5. Results
In this study, we have temperature data from psychrometers with forced ventilation. Using these data as a reference makes it possible to study the accuracy of the automatic error-correction method. Figure 8 presents a comparison of differences in 1 min temperatures measured by the Vaisala and the psychrometer at level 5 and determined with the automatic detection method. The SD between the two temperature differences is 0.25 K, whereas 0.20 and 0.60 K, respectively, were calculated for mean absolute (MeanAD) and maximum absolute deviations (MaxAD). A total of 588 values (n_val) were taken into account, and r 2 was 0.88. The values of the deviations and of r 2 indicate that temperature differences, which are automatically detected for measurements clearly influenced by radiation, are very similar to the concurrently measured temperature differences.
Comparison of 1 min temperature differences (i.e. measured between Vaisala and psychrometer at level 5 and determined with the automatic detection method). The dotted lines mark the deviations of ±0.5 K from perfect correlation.

Parameters N, f R, f u and u ref were optimized using the automatically determined temperature differences. The optimal values of N, f R, f u and u ref are 20, 0.00053 K W−1 m−2, 0. 123 K m−1 s and 1.0 m s−1, respectively, at level 5, and 13, 0.00075 K W−1 m2, 0.130 K m−1 s and 0.9 m s−1, respectively, at level 1. The differences in optimized parameter values between the two levels reveal that the parameters must be calculated for each Vaisala individually.
Temperature errors were modelled for the whole time series by Equation (9) using the optimal set of parameters. Differences in 1 min temperatures measured by the Vaisala and the psychrometer at level 5 are shown in Figure 9, together with the modelled temperature errors. The SD between the two datasets is 0.21 K, whereas 0.12 K and 2.35 K, respectively, were calculated for MeanAD and MaxAD. The n_val total was 10 655, and r 2 was 0.87. The high correlation between the two temperature differences confirms the high quality of the correction method.
Comparison of 1 min measured and modelled temperature differences between Vaisala and psychrometer at level 5 for the whole time series.

Figure 10 presents histograms of 1 min differences between Vaisala and psychrometer temperatures at level 5 before and after correction. Temperature differences were divided into 13 intervals between −1.0 and 5.5 K. Before correction, errors between −0.5 and 5.5 K were measured. After correction, errors vary between −1.0 and 3.0 K. Whereas 74% of all errors fall between −0.5 and 0.5 K before correction, this percentage increases to 95% afterwards.
Histograms of l min temperature differences between the Vaisala and psychrometer at level 5 before solid line) and after correction (dotted line).

The automatic correction method was developed for 1 min data. However, many investigations do not require this high temporal resolution; moreover, aggregated data are often required (e.g. for energy-balance computations). The higher accuracy of corrected 1 min air temperatures should also propagate in aggregated temperature data. Therefore r 2, SD, MeanAD and MaxAD between psychrometer and uncorrected, as well as corrected, Vaisala temperatures at level 5 are calculated for different data-averaging periods and are summarized in Table 1. For the 1 min data as well as for all averaging periods, r 2 increased and all deviations decreased after correction. Longer averaging periods reduce the errors but also improve the correction. Using an averaging period of 30 min, which is a typical aggregation interval for calculating sensible-heat flux, MaxAD is 1.1 K after correction, while it was 3.6 K before correction.
Coefficient of determination (r 2) standard (SD), mean absolute (MeanAD) and maximum absolute deviation (MaxAD) between psychrometer and uncorrected (uncorr), as well as corrected (corr) Vaisala temperatures at level 5 for four different data-averaging periods

6. Conclusions
It is possible to correct air-temperature data, which are measured with naturally ventilated sensors, by the newly developed, physically based method. Corrected air-temperature data can be applied to calculate sensible-heat flux of a melting snow surface. The bulk-transfer and bulk-aerodynamic methods are often used for this purpose (e.g. Reference MunroMunro, 1989). Measurements are required at one level only, since the melting snow cover provides a second, well-defined value for temperature. Using corrected air temperatures improves the results for bulk approaches. For example, at 1030 h on 30 May, the 30 min average of air temperature measured by the Vaisala was 1.8°C, whereas the corrected Vaisala temperature was −2.0°C (for comparison: psychrometer temperature was −1.8°C). Using the uncorrected temperature results in a wrong direction for the sensible-heat flux even if the snow is melting and air temperature is negative. The bulk-transfer or bulk-aerodynamic method works very well given the prerequisite of a melting snow- or ice-covered surface.
The correction method is still insufficiently accurate for profile-based methods that rely on vertical gradients of air temperature approximated from accurate measurements at two levels. In addition, radiation errors persist during periods of low wind. However, this problem does not cause significant errors for sensible-heat-flux calculations, because sensible-heat flux is generally weak when wind speed is low.
Acknowledgements
We would like to thank all those who helped us with this campaign. Many thanks are due to E. Parlow from the University of Basel, S. Dietrich and M. Gude from the University of jena, and M. Lundkvist and U. Clevfors from the University of Uppsala, who worked with us in the field. We would like to express our gratitude to all members of the Abisko Scientific Research Station for their support, and to the Karlsruhe Research Center GmbH, which provided logistic back-up for our campaign. The field campaign was funded by the Swiss National Science Foundation. Finally, we want to thank the reviewers for their helpful comments and suggestions.



