I. INTRODUCTION
In recent years, diamond has become a widely investigated material.Reference Tsugawa, Ishihara, Kim, Hasegawa and Koga1 Ultrananocrystalline diamond (UNCD) and nanocrystalline diamond (NCD) films have attracted increasing interest due to their unique electrical, optical, and mechanical properties,Reference Butler and Sumant2 which make them widely suitable for different applications, such as MEMS devices, lateral field emission diodes, biosensors, thermoelectrics, etc. Additionally, nanodiamond offers properties such as biocompatibility and nontoxicity.
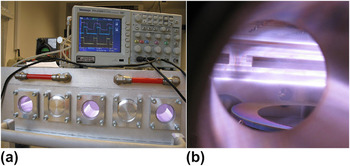
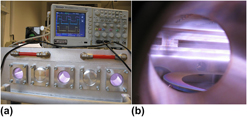
Many of these applications of NCD films require special preparation parameters, such as large area growth or low-temperature deposition. For the growth of NCD, many constructions of microwave (MW) cavities chambers exist, such as classical ellipsoidal systems,Reference Füner, Wild and Koidl3 circumferential antenna plasma systems,Reference Pleuler, Wild, Füner and Koidl4 or linear antenna systems.Reference Fendrych, Taylor, Peksa, Kratochvílová, Vlček, Řezáčová, Petrák, Kluiber, Fekete, Liehr and Nesládek5, Reference Taylor, Fendrych, Fekete, Vlček, Řezáčová, Petrák, Krucký, Nesládek and Liehr6 One system capable of meeting the requirements of large area and low-temperature growth is the plasma-enhanced linear antennas microwave chemical vapor deposition (PELAMWCVD).Reference Tsugawa, Ishihara, Kim, Hasegawa and Koga1 This special reactor type (see Fig. 1) works with different conditions compared to classical MW chemical vapor deposition (CVD) systems used for the growth of NCD films. By the use of a pulsed MW power supply, this type of system has been further improved.Reference Fendrych, Taylor, Peksa, Kratochvílová, Vlček, Řezáčová, Petrák, Kluiber, Fekete, Liehr and Nesládek5, Reference Taylor, Fendrych, Fekete, Vlček, Řezáčová, Petrák, Krucký, Nesládek and Liehr6 Typical condition for MW plasma-assisted growth is a mixture of hydrocarbon and hydrogen with a very low proportion of hydrocarbon. To improve plasma conditions by chemistry during deposition, it is suitable to add carbon dioxide to the gas mixture.Reference Taylor, Fendrych, Fekete, Vlček, Řezáčová, Petrák, Krucký, Nesládek and Liehr6, Reference Elliott, May, Petherbridge, Leeds, Ashfold and Wang7 Plasma emission spectroscopic studies of plasma deposition systems for NCD growth have been published, mainly for either simple cavity MW systemsReference Vandevelde, Wu, Quaeyhaegens, Vlekken, D’Olieslaeger and Stals8 or hot filament systems.Reference Larijani, Le Normand and Cregut9 Also, plasma studies using time-resolved spectroscopic diagnostics of a classical CVD system with pulsed plasmas for NCD growth, were published.Reference Bénédic, Duten, Syll, Lombardi, Hassouni and Gicquel10 MW systems typically work with continuous MW mode. Improvements can be made by the use of pulsed MW fields with kilohertz frequencies producing high plasma densities above 1011 cm−3 and lower sp2 content in films (<5% sp2 for 50 nm of thickness).Reference Vlček, Fendrych, Taylor, Kratochvílová, Fekete, Nesládek, Liehr, Bergonzo, Butler, Jackman, Loh and Nesladek11
(a) Photo of pulsed plasma-enhanced linear antennas microwave chemical vapor deposition (PELAMWCVD) apparatus setup with oscilloscope indication of microwave (MW) pulse measured from output of MW magnetron and plasma discharge photoemission from fast Hamamatsu photodiode. (b) View into the PELAMWCVD chamber during nanocrystalline diamond film deposition on 6-inch Si wafer showing plasma emission. Also visible are the antennas inside quartz envelopes and a 6-inch Si wafer mounted on a substrate table.

The main method of plasma diagnostics in these complicated systems is optical emission spectroscopy (OES). The aim of this work is to carry out basic plasma OES diagnostics for pulsed plasma systems in the new PELAMWCVD type reactor for large area deposition.
II. EXPERIMENT
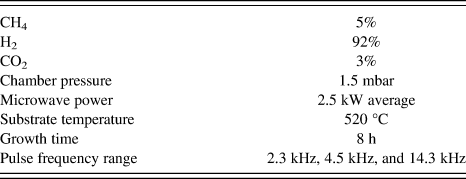
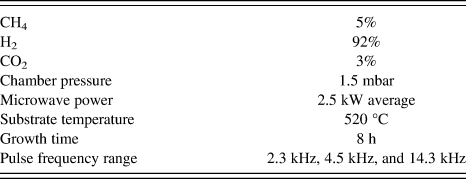
All measurements were carried out on the PELAMWCVD apparatus with two magnetrons delivering 2 × 2.5 kW of average power (2.45 GHz MW). Studied pulse widths were between 20 and 130 μs, which correspond to MW pulse frequencies of 3.8 to 25 kHz with 50% duty cycle. The duty cycle was kept constant for all experiments. Since the duty cycle was 50%, the pulse peak was twice the value of the continuous wave (CW) level. We studied the effect of pressure across the range of 0.38–2.0 mbar and the effect of total gas flow for the range of 125–1000 sccm. The typical growth conditions used in investigated NCD depositions are written in Table I. Electrochemically polished Si(100) (square cuts of dimensions of 2 × 2 cm2) were used as substrates for growth experiments. Before growth, the substrates were seeded by spin coating a deposition of water colloidal dispersion containing NanoAmandoB diamond nanoparticle seeds with an average size of 15 nm.
Range of growth conditions used for diamond layer deposition.
OES was measured using a HORIBA Jobin Yvon spectrometer (HORIBA Jobin Yvon, Edison, NJ) with a cryogenic high-resolution charge-coupled device Symphony detector, which was connected to the chamber by fiber optics. The fiber optics focus was set to the central plasma zone between the substrate and antenna system. The possible measuring wavelength range was 350–900 nm. The intensities of Balmer atomic hydrogen emission lines were studied for different conditions. Gas composition for the diamond growth experiments was about 5% of CH4 in H2 and 3% of CO2.
Grown films were investigated with the following techniques. Secondary electron microscopy (SEM) images were produced of grown films using a FEI Quanta 3D FEG (FEI, Hillsboro, OR) which combines high-resolution scanning electron microscope with focused ion beam (DualBeam, FEI, Hillsboro, OR). Raman spectroscopy was carried out at room temperature using a Renishaw inVia Raman microscope with the following conditions: wavelength = 488 nm (25 mW), x50 Olympus objective, 65 μm slits, approximately 2 μm spot diameter, and grating = 2400 L/mm.
III. RESULTS AND DISCUSSION
A. Plasma analysis
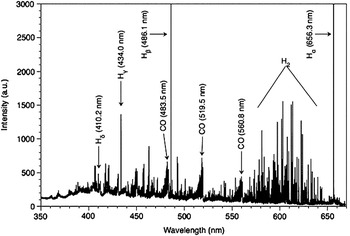
The spectrum of the plasma in the visible wavelength range contains the Hα (656.3 nm), Hβ (486.1 nm), Hγ (434.0 nm), Hδ (410.2 nm) lines, the molecular bands of CO (band heads on 483.5, 519.5, and 560.8 nm), and the molecular band of H2 (520–690 nm). A typical spectrum obtained from our PELAMWCVD with pulsed plasmas is shown in Fig. 2. CW plasma spectra show the same signals from spectral lines and bands as the pulsed but with difference in overall intensities.
Optical emission spectrum (OES) of pulsed plasma (16.7 kHz) with important lines and bands indicated.

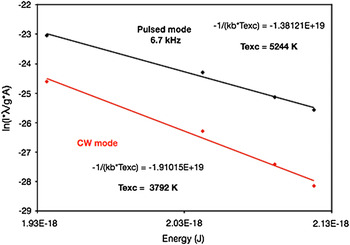
To calculate the excitation temperatures, a Boltzmann plot for the Balmer series of atomic hydrogen was used. The excitation temperature, T exc, is derived from the slope of a graph of ln(Iλ/gA) versus energy where I is taken as the integrated spectral line intensity, λ is the transition line wavelength, g is degeneracy of the energy level, and A is the transition probability. The slope is equal to −1/(k bT exc), where k b is Boltzmann constant. The excitation temperature during pulsed MW plasma discharge was found to be substantially different when compared to the CW mode plasmas. An excitation temperature of 3792 K was calculated for plasmas produced in CW mode and 5244 K for plasmas produced in pulsed (6.7 kHz) mode (see Fig. 3). At low pulse frequencies (∼2.5 kHz), the plasma electron temperature and density reach higher values during the pulse-on-time compared to CW since the peak power input is much higher. During the pulse-off-time, the temperature rapidly decreases. With increasing pulse frequency, the plasma electron temperature and density steadily remain at higher values since during the shrinking pulse-off-time electrons are less likely to cool down. Eventually, the plasma electron temperature approaches a value similar to that of CW power at pulse peak levels <5 kHz.
Boltzmann plot calculation of excitation temperatures, comparing CW and pulsed (6.7 kHz) plasma modes.

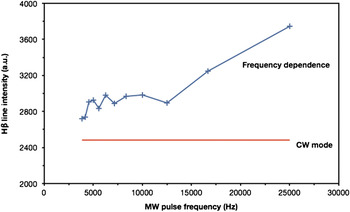
The frequency dependence of atomic hydrogen intensity (Hβ line) for frequencies 3.8–25 kHz for a process pressure of 1.5 mbar was measured (Fig. 4). It can be seen that above 12.5 kHz the hydrogen intensity increases steeper than for frequencies below 12 kHz. Since all measured Balmer lines show a similar behavior to the Hβ line, this effect can again be attributed to the assumption that both electron temperature and density are rising with growing pulse frequencies.
Hβ line intensity (486.1 nm) with respect to MW pulse frequency.

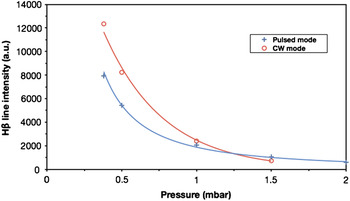
The pressure dependence of the intensity of the Hβ line (486.1 nm) compared for pulsed (3.1 kHz) and CW MW plasmas in range up to 2 mbar is shown in Fig. 5. The hydrogen intensity increases with decreasing pressure rapidly below 1 mbar for both CW and pulsed modes. However, below 1.0 mbar the hydrogen intensity is lower for pulsed mode plasma.
Pressure dependence of Hβ line intensity (486.1 nm) for CW and 3.1 kHz pulsed plasma.

Higher pressure at a constant MW power input lets the plasma ignition volume shrink. The plasma retracts around the antenna tubes and makes it difficult for MWs to penetrate. The plasma light from the antenna area cannot be detected by the spectrometer. Rectangular power pulses (at 3.1 kHz) do not face a dense plasma during their rise time. Hence, the waves can propagate a lot further and pick up electrons on their way to create a very high initial electron temperature. Light from H atoms that have been excited on that path can be detected by the spectrometer. Only after a short time a full plasma is ignited and sustained around the antennas. In this state, the electron temperature is much lower but the electron density is much higher.
Lower gas pressure means that the probability of hot electrons hitting a hydrogen atom or molecule is decreasing. Since electrons are only accelerated during the pulse-on-time, ionization and excitation are limited to that period. Hence, the light intensity from a CW-driven plasma is higher compared to the equivalent pulsed power at lower gas pressures.
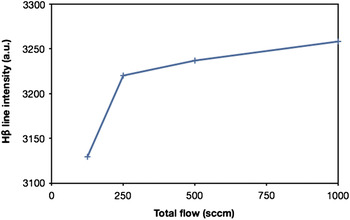
The influence of the total gas flow on the Hβ line intensity was studied as well (Fig. 6). The intensity of atomic hydrogen shows a strong increase around 200 sccm, and it slightly increases further at higher gas flow rates.
Hβ line intensity (486.1 nm) as a function of total flow of process gas.

The optical spectrometer was focused on a limited area between the MW antenna structures and the substrate stage. Ions and excited atoms/molecules produced in the vicinity of the MW antennas, i.e., the plasma source with the highest plasma densities, decayed without being spotted by the spectrometer. Increasing the process gas flow from the plasma source toward the substrate stage resulted in higher downstream velocities of excited particles and therefore in a higher measurable fraction of excited particles decaying within the detection range of the spectrometer. However, higher process gas flow reduces the dwell time of gas atoms and molecules in the plasma source resulting in lower probabilities of excitation or ionization by plasma electron impact. This appears to be the reason for the less pronounced inclination of the line intensity toward higher process gas flow rates.
B. Analysis of NCD layers
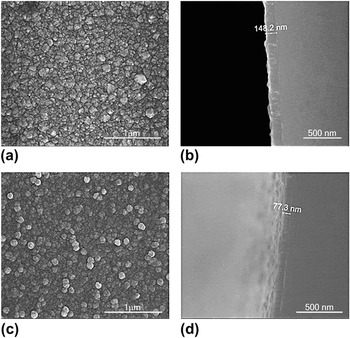
Raman spectroscopy and SEM were used to ascertain the quality of layers grown using different pulse frequencies. SEM shows an improvement in the crystalline structure with increasing pulse frequency (see Fig. 7) and also an increase in growth rate by a factor of 2. (Note: Deposition duration was the same for all layers.) This improvement in NCD layer quality and growth rate with increasing pulse frequency can be attributed to the presence of higher concentrations of atomic H due to the reduction in the H recombination rate at higher frequencies or more specifically when the pulse-off-time is reduced. The effect of better crystalline quality and higher growth rates due to enhanced atomic H concentration is well known and has been investigated in previous work.Reference Gicquel, Hassouni, Silva and Achard12
Secondary electron microscopy images of nanocrystalline diamond (NCD) layers grown using (a, b) 14.3 kHz showing crystalline structure and complete coverage, (c, d) 2.7 kHz showing a less-facetted surface crystallinity; (a, c) plan view, (b, d) cross-section view.

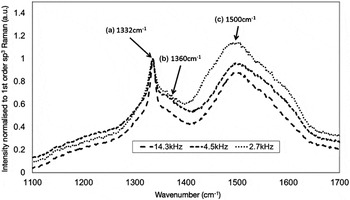
Raman spectroscopy (see Fig. 8) showed a sharp peak relating to sp3 diamond growth (1332 cm−1) and broad features relating to sp2 amorphous carbon D and G peaks (1360 and 1500 cm−1) in all layers investigated. It was found that an increase in the pulse frequency significantly reduced the level of sp2 in the grown layers. Amorphous carbon has a Raman scattering efficiency greater than that of diamond. This means that for an identical number of atoms sampled, amorphous carbon would give a much larger Raman signal than diamond. Therefore, by using the method described in Ref. Reference Fortunato, Chiquito, Galzerani and Moro15, which attempts to correct for the Raman scattering efficiency differences, it is possible to estimate the percentage of sp3. For the described films, this percentage was calculated to increase from 85 to 95% with increasing pulse frequency. This trend matches that of the improvement in crystal quality and growth rate previously described and can be explained similarly, i.e., at higher H concentrations, sp2 is preferentially etched.
488 nm Raman spectra taken from the NCD layers as a function of the pulse frequency. The spectra show three components: (a) A sharp peak at 1332 cm−1, which is attributed to the first-order sp3 diamond Raman line. b) A broad feature at 1360 cm−1, which is attributed to the D peak of sp2 amorphous carbon. (c) A broad feature peaking at 1500 cm−1, which is attributed to the G peak of sp2 amorphous carbon.Reference Prawer and Nemanich13, Reference Ferrari and Robertson14 It is clear that the sp2 content of the NCD layers is reduced with increasing MW pulse frequency, i.e., the “quality” of the layer improves.

IV. CONCLUSION
A unique plasma system for NCD growth was investigated by OES to optimize growth parameters to low sp2 content, higher growth rates, and high quality of crystalline surface morphology. Material properties of prepared NCD films and growth rates were improved by use of higher frequency MW plasmas, lower pressures, and higher total gas flows. This improvement correlates with increased atomic hydrogen concentration in the plasma.
ACKNOWLEDGMENTS
Financial support from the Academy of Sciences of the Czech Republic (Grants KAN200100801, KAN400480701, KAN300100801, and KAN301370701) and the European R&D projects FP7 ITN Grant No. 238201 (MATCON) and the COST MP0901-NanoTP (MSMT CR Reg. No. LD11076) is gratefully acknowledged.