Introduction
In most marine species with wide geographic distributions, reproductive, ecological, and even morphometric aspects can be directly influenced by environmental conditions, such as precipitation, temperature, season duration, and salinity (Blanckenhorn and Demont, Reference Blanckenhorn and Demont2004; Blanckenhorn et al., Reference Blanckenhorn, Stillwell, Young, Fox and Ashton2006; Rahi et al., Reference Rahi, Ferdusy, Wali Ahmed, Khan, Aziz and Salin2020). These abiotic factors are directly linked to latitudinal differences, which can also affect the availability of resources, such as shelter and food (Mantelatto and Garcia, Reference Mantelatto and Garcia1999; Mantelatto et al., Reference Mantelatto, Alarcon and Garcia2002). Environments with food scarcity can restrict individual growth, producing animals with smaller body sizes (Blanckenhorn and Demont, Reference Blanckenhorn and Demont2004), whereas precipitation can influence reproductive activities (Saeedi et al., Reference Saeedi, Kamrani, Nordhaus and Diele2018). Temperature is also identified as an environmental factor capable of influencing the physiology and development of organisms (Aguilar-Alberola and Mesquita-Joanes, Reference Aguilar-Alberola and Mesquita-Joanes2014). Populations living in locations with higher temperatures tend to reach sexual maturity faster, which can restrict growth and result in smaller body sizes (Atkinson and Sibly, Reference Atkinson and Sibly1997; Hartnoll, Reference Hartnoll2001). Furthermore, crustaceans from intertidal zones are subject to high environmental dynamics, in which spatial and temporal variations in abiotic factors exert a significant influence on their biological parameters and life cycles (Alves-Júnior et al., Reference Alves-Júnior, Santana, Figueiredo and Araújo2018).
Crustacean populations found in tropical regions typically have their reproduction primarily influenced by temperature and rainfall (Lønborg et al., Reference Lønborg, Müller, Butler, Jiang, Ooi, Trinh, Wong, Ali, Cui, Siong, Yando, Friess, Rosentreter, Eyre and Martin2021). The former factor favours sexual activity and metabolism for embryonic development in some coastal species (Alves-Júnior et al., Reference Alves-Júnior, Santana, Figueiredo and Araújo2018), whereas the latter increases the nutritional supply that females need to nourish their embryos (Lønborg et al., Reference Lønborg, Müller, Butler, Jiang, Ooi, Trinh, Wong, Ali, Cui, Siong, Yando, Friess, Rosentreter, Eyre and Martin2021). The reproduction of species can be synchronized with these and other factors, such as the tidal range; thus, many marine organisms reproduce synchronously (Christy, Reference Christy2011). Reproductive synchrony is defined as the coordination of reproductive events between individuals of a population or between different species (such as symbiont and host) to optimize reproductive success (Christy, Reference Christy2011; Mercier and Hamel, Reference Mercier and Hamel2014). Reproductive asynchrony occurs when there is a mismatch between reproductive cycles, which can be influenced by different responses to environmental signals (Christy, Reference Christy2011; Mercier and Hamel, Reference Mercier and Hamel2014).
In addition to environmental factors, other factors, such as host characteristics and number, can also influence the population and reproductive aspects of symbiotic species. In symbiotic relationships involving crabs of the family Pinnotheridae (De Haan, Reference De Haan and von1833), different ecomorphological patterns can be observed, particularly in carapace shape and lifestyle habits, demonstrating the adaptation of the symbiont to its host (de Gier and Becker, Reference de Gier and Becker2020). For example, crabs found with burrowing organisms have adaptations that make their carapace wide and flat, while the third pair of legs is enlarged to cling to the inside of burrows. In endosymbiotic species, the body has a rounded shape (Hultgren et al., Reference Hultgren, Foxx and Palacios Theil2022). Crabs can also exhibit physiological, reproductive, and behavioural adaptations to adapt to a symbiotic lifestyle, creating both beneficial strategies for themselves and affecting the physical and reproductive characteristics of their hosts (Jaramillo et al., Reference Jaramillo, Salas-Yanquin, Büchner-Miranda, Cubillos, Montory, Jan, Luis and Oscar2023). de Gier and Becker (Reference de Gier and Becker2020) described strategies in which symbiotic crabs leave the host to mate in open waters, forming mating swarms, a classic example of intraspecific synchrony. Although studies have demonstrated reproductive synchrony processes, mainly related to environmental and intraspecific factors, there is still an unexplored gap in knowledge investigating the temporal synchrony or asynchrony of reproduction between symbionts and their hosts.
The pea crab Austinixa aidae (Righi, Reference Righi1967) is a recognized non-obligate symbiont of Callichirus corruptus Hernáez, Miranda, Rio, and Pinheiro, 2022, which inhabits the intertidal zones of sandy beaches (Rodrigues and Shimizu, Reference Rodrigues and Shimizu1997; Peiró and Mantelatto, Reference Peiró and Mantelatto2011). This symbiotic crab and its host are widely distributed along the Brazilian coast, although occurrence records are not continuous for all coastal states; confirmed records for A. aidae include the states of Pará, Ceará, Rio Grande do Norte, Paraíba, Pernambuco, Alagoas, Bahia, Espírito Santo, and São Paulo (Mantelatto et al., Reference Mantelatto, Tamburus, Magalhães, Buranelli, Terossi, Negri, Castilho, Costa and Zara2020; Almeida et al., Reference Almeida, Araújo-Silva, Lucatelli, Bezerra, Balbino, Tamburus and Mantelatto2023). For its host, C. corruptus, occurrence has been documented in the states of Pará, Maranhão, Piauí, Ceará, Rio Grande do Norte, Paraíba, Pernambuco, Alagoas, Sergipe, Bahia, Espírito Santo, Rio de Janeiro, São Paulo, Paraná, and Santa Catarina (Mantelatto et al., Reference Mantelatto, Tamburus, Carvalho-Batista, Rossi, Buranelli, Pantaleão, Teles, Zara, Carvalho, Bochini, Terossi, Robles, Castilho and Costa2022, as C. major). The widespread occurrence of A. aidae at northern latitudes was consolidated after synonymy with A. hardyi (Harrison and Hanley, Reference Scott Harrison and Hanley2005) and A. bragantina (Almeida et al., Reference Almeida, Araújo-Silva, Lucatelli, Bezerra, Balbino, Tamburus and Mantelatto2023), while the distribution of C. corruptus reflects the recent taxonomic reclassification of Brazilian populations previously identified as C. major (Hernáez et al., Reference Hernáez, Miranda, Rio and Pinheiro2022).
Biological information available for A. aidae is restricted to one population from the southeast region of Brazil, addressing population structure (Peiró and Mantelatto, Reference Peiró and Mantelatto2011), mating system (Peiró et al., Reference Peiró, Baeza and Mantelatto2013), and fecundity (Peiró et al., Reference Peiró, Mossolin and Mantelatto2014). For C. corruptus, studies are more extensive and focused on populations in the Southeast and Northeast of Brazil, with works on population biology (Alves-Júnior et al., Reference Alves-Júnior, Araújo and Coelho2014), population dynamics (Botter-Carvalho et al., Reference Botter-Carvalho, Santos and Carvalho2007; Moschetto et al., Reference Moschetto, Borges and Duarte2020), reproductive aspects (Alves-Júnior et al., Reference Alves-Júnior, Santana, Figueiredo and Araújo2018), growth and maturity (Rio et al., Reference Rio, Hernáez and Pinheiro2019), spatial distribution (Rosa et al., Reference Rosa, Freire and Souza2018; Constantino et al., Reference Constantino, Ferreira, Zalmon and Soares-Gomes2024), and the impact of exploitation on the population (Costa et al., Reference Costa, Marinho, Gomes, Santos, Carvalho and Botter-Carvalho2020). Despite considerable information on both species, existing studies have focused almost exclusively on the individual biology of each species, revealing a significant knowledge gap regarding integrated analyses that simultaneously assess the population structure and reproduction of both species in the same location.
Thus, this study aimed to describe the population structure of A. aidae and its host, C. corruptus, on a sandy beach in Northeast Brazil and correlate reproductive periods and host use patterns. We compared the results of the two species to understand the dynamics of the symbiotic relationship over time, evaluating the degree of reproductive correlation (synchrony or asynchrony). This research focuses on understanding how the symbiont A. aidae adjusts its population structure in response to its host, which provides critical shelter from predators and adverse environmental conditions. Our goal was to identify whether the symbiont’s reproduction is shaped by the host’s temporal availability or whether local abiotic factors promote a temporal shift between the reproductive peaks of both species. To this end, we investigated the size–frequency distribution, sex ratio, reproductive, and recruitment periods simultaneously for both species, the incidence of crabs in their host galleries, and the relationship between size and the number of crabs per burrow and host size. Additionally, we verified possible latitudinal differences in relation to other previously studied populations.
Materials and methods
Sampling was conducted monthly from May 2023 to April 2024 in the intertidal region of Cinelândia Beach, located in the northeast region of Brazil (11°00′14″ S, 37°03′28″ W; Figure 1). The beach is classified as dissipative, with semi-diurnal tides and a maximum amplitude of 2.6 m (Dominguez et al., Reference Dominguez, da Silva Pinto Bittencourt, Santos and Do Nascimento2016; Rosa, Reference Rosa2021). Furthermore, the region has a tropical humid climate, with a rainy season between April and August and a dry season between November and February (Alvares et al., Reference Alvares, Stape, Sentelhas, De Moraes Gonçalves and Sparovek2013). Among the local impacts, we can highlight the use of the beach for various leisure activities, such as recreational bathing and sports (e.g., soccer and volleyball). However, during the study, no burrowing shrimp collections by fishermen were observed during field activities, as occurs on other beaches on the Brazilian coast (Moschetto et al., Reference Moschetto, Borges and Duarte2020).
Collection site: (a) Burrows of Callichirus corruptus; (b) Cinelândia Beach, Aracaju, SE; (c) location of the collection area.

Figure 1 Long description
A) Shows burrows in sandy terrain, likely indicating the presence of burrowing organisms. B) Displays Cinelândia Beach with a view of the shoreline and ocean under a clear sky. C) Consists of three maps: the first map shows Brazil with a highlighted region for Aracaju, SE; the second map zooms into the state of SE, showing Aracaju and surrounding areas; the third map is a satellite view of Cinelândia Beach, marked with a red dot, showing detailed coastal and inland features. The legend identifies Aracaju-SE, Cinelândia Beach and Brazil, with a scale bar indicating distances up to 6 km.
Sampling was conducted during diurnal spring tides through the visual identification of C. corruptus burrow openings. Specimens were collected opportunistically across the intertidal zone using a suction pump, with a standardized sampling effort of two collectors for 2 hours (Rodrigues, Reference Rodrigues1976). Each burrow was pumped four times, and the obtained sediment was deposited in a 0.5 mm mesh sieve. The sieve was then rinsed with seawater, and the crabs and hosts were individually placed in plastic bags labelled with the number of burrows sampled. The animals were euthanized by thermal shock and kept refrigerated. At the end of the collection, the material was taken to the Carcinology Laboratory of the Federal University of Sergipe and preserved in 70% alcohol until analysed. Of the sampled material, 211 specimens of A. aidae and 38 of C. corruptus were deposited in the Zoological Collection of the Federal University of Sergipe (CZUFS CRU-00164, CZUFS CRU-00166) as vouchers. Water temperature, atmospheric temperature, salinity, and rainfall were measured at each collection site. Water temperature was measured using a digital thermometer, salinity was measured using an optical refractometer, and rainfall and atmospheric temperature were obtained from the website of the National Institute of Meteorology (INMET; https://bdmep.inmet.gov.br/#).
To assess the correlation between environmental factors (water temperature, salinity, precipitation, and mean monthly atmospheric temperature) and host abundance, cross-correlation analysis was performed (Probst et al., Reference Probst, Stelzenmüller and Fock2012). This analysis was used to assess how variations in environmental factors influenced biotic variables over time, considering possible lags in the effects. Positive lags indicate that the dependent variable is correlated with the independent variable in earlier periods, whereas negative lags indicate a correlation with the independent variable in later periods (Probst et al., Reference Probst, Stelzenmüller and Fock2012). The lag values were adjusted to identify the most relevant time intervals for each environmental factor. All data were analysed using R software, and the results were interpreted based on the statistical significance of the correlations at each time interval (α = 0.05).
In the laboratory, C. corruptus and A. aidae individuals were sexed following the methodologies used by Rio et al. Reference Rio, Hernáez and Pinheiro2019 and Peiró et al. (Reference Peiró, Mossolin and Mantelatto2014), respectively. In C. corruptus, females have gonopores on the third pair of pereiopods and trisegmented pleopods, whereas males have bisegmented pleopods and a hypertrophied cheliped, characterized by strong heterochely. For A. aidae, the most evident sexual dimorphism is in the morphology of the abdomen, which is wider in females and narrower in males. The carapace width (CW) of the symbiotic crab and carapace length (CL) of the host were measured using a digital calliper (accuracy: 0.01 mm).
The population dynamics of A. aidae and its host, C. corruptus, were analysed based on the monthly distribution of demographic categories in size classes, considering CW in A. aidae and CL in C. corruptus. Although the amplitude of the size classes was initially estimated using Sturges’ rule (Reference Sturges1926), manual adjustments were made to standardize the intervals (e.g., 1.0 mm for A. aidae), optimizing data visualization, and allowing direct comparisons with previous demographic studies (Peiró et al., 2011, Reference Peiró, Baeza and Mantelatto2013). Both species were grouped into demographic categories (males, females, ovigerous females, and undifferentiated juveniles, defined as individuals whose external sexual characters were not yet visible or developed enough to allow sex identification) to verify the temporal variations in frequency distribution. The frequency distributions of both species were subjected to the Kolmogorov–Smirnov test for normality (α = 0.05) (Zar, Reference Zar1999).
The reproductive and recruitment periods of A. aidae and its host C. corruptus were determined based on the monthly frequency of ovigerous females in relation to the total number of females and the presence of undifferentiated juveniles in the sample, respectively (Hill, Reference Hill1977; Pezzuto, Reference Pezzuto1998). The frequency of ovigerous females and juveniles was correlated with environmental variables through cross-correlation analysis (Probst et al, Reference Probst, Stelzenmüller and Fock2012). The sex ratio was analysed for each population, sampling month, and size class using the chi-square test (α = 0.05) (Zar, Reference Zar1999) to verify whether the sex ratio followed a 1:1 proportion.
Pearson’s correlation was used to verify possible correlations between the abundance and mean size of crabs found together in the same burrow and the size of the hosts (Peiró and Mantelatto, Reference Peiró and Mantelatto2011). This analysis was also performed to verify possible correlations between the abundance, reproduction, and recruitment periods of the crabs and hosts. For correlation analyses involving hosts, only the specimens successfully captured were considered, ensuring that the low capture efficiency of the host, attributed to the depth of its galleries, did not bias the biological interactions analysed. To verify possible differences in the size of individuals of both species in populations from different latitudes, body size data were extracted from studies conducted along the Brazilian coast. We considered CL for C. corruptus and CW for A. aidae, and selected studies that presented both mean and maximum values.
Results
Monthly precipitation varied from 48 mm in November 2023 to 433.6 mm in May 2023. The mean atmospheric, water, and salinity temperatures showed smaller variations throughout the sampling period, with means of 26.7 ± 1.3, 27.9 ± 1.7, and 36 ± 3.4°C, respectively.
Austinixa aidae
In total, 1275 crabs were collected (mean of 0.82 ± 0.76 crabs per burrow), of which 676 were females (including ovigerous and non-ovigerous females; 53%), 544 were males (43%), and 55 were undifferentiated juveniles (4%), with a variation of zero to five individuals per burrow. The average density of crabs per C. corruptus burrow ranged from 0.35 ± 0.48 individuals in February 2024 to 1.21 ± 1.03 individuals in September 2023. The CW of females ranged from 2.16 to 8.72 mm (mean ± standard deviation [SD] = 5.51 ± 1.52 mm), that of males from 2.13 to 9.03 mm (mean ± SD = 5.40 ± 1.53 mm), and that of undifferentiated juveniles ranged from 1.78 to 2.80 mm (mean ± SD = 2.22 ± 0.24 mm). No difference was observed between the average size of males and females (t = −1.23; p = 0.22); however, males attained maximum sizes (9.03 mm CW) larger than females (8.72 mm CW).
Total number of individuals showed a negative correlation with temperature at lags (months) of −1 (R = −0.74; T = −3.48; P < 0.05), 0 (R = −0.77; T = −3.80; P < 0.05), and 1 (R = −0.69; T = −3.07; P < 0.05), and a positive correlation in relation to precipitation at lags of 2 (R = −0.57; T = −2.22; P < 0.05) and 3 (R = −0.69; T = 3.08; P < 0.05). No significant correlations were observed for the other abiotic factors.
The size class distribution of A. aidae showed a non-normal pattern for the total population (D = 0.06; p < 0.05), with a concentration of individuals near the central classes, but with asymmetry in the lateral tails, with the upper classes showing a rapid decline. Furthermore, when analysing the normality in the distribution of each collection month, only the months of January (D = 0.080; p > 0.05), February (D = 0.079, p > 0.05), and March (D = 0.082; p > 0.05) of 2024 presented a normal distribution (Figure 2). Furthermore, the smallest size classes predominated in May, August, and September, with a significant influence of undifferentiated juveniles in the last 2 months. The largest size classes, from 7 to 8, demonstrated peaks in July and August, with a significant influence on the number of ovigerous females.
Size–frequency distribution (CW = carapace width) of Austinixa aidae collected inside Callichirus corruptus burrows at Cinelândia Beach, Aracaju, SE, Brazil, from May 2023 to April 2024. Values inside the panels indicate the absolute number of individuals (n) collected in each month.

Figure 2 Long description
The image contains twelve bar graphs representing the size frequency distribution of Austinixa aidae and Callichirus corruptus collected at Cinelândia Beach, Aracaju, SE, Brazil, from May 2023 to April 2024. Each graph corresponds to a specific month, displaying the number of individuals collected. The horizontal axis represents carapace width classes from 0 to 10, while the vertical axis shows the number of individuals, ranging from 0 to 25. The graphs are labeled with the total number of individuals collected each month: May 2023 (115), June 2023 (122), July 2023 (130), August 2023 (151), September 2023 (132), October 2023 (116), November 2023 (94), December 2023 (82), January 2024 (110), February 2024 (49), March 2024 (76) and April 2024 (98). The legend differentiates between juveniles, females, ovigerous females and males. Key trends include peaks in larger size classes during July and August and a predominance of smaller size classes in May, August and September. The graphs show a non-normal distribution pattern with concentration near central classes and asymmetry in lateral tails.
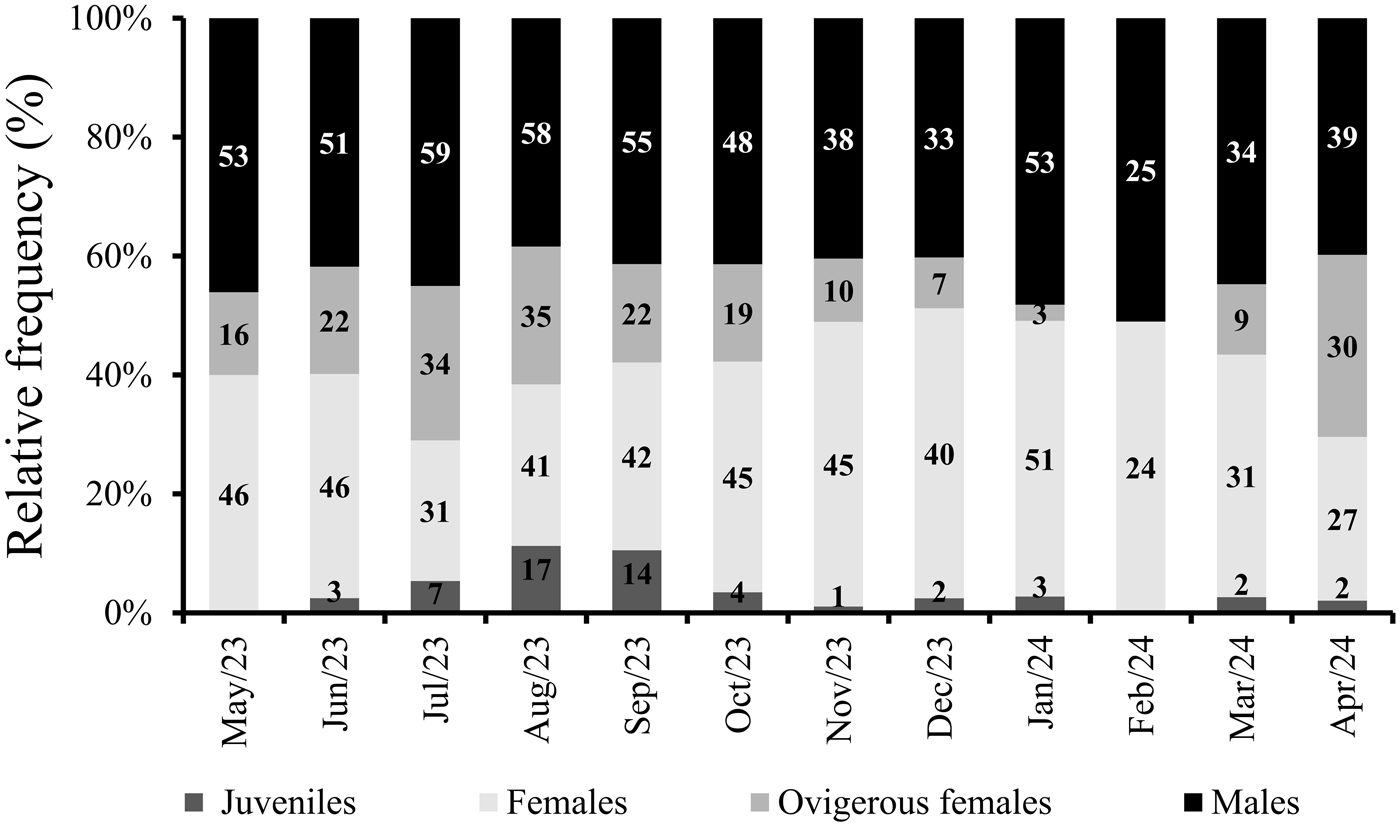
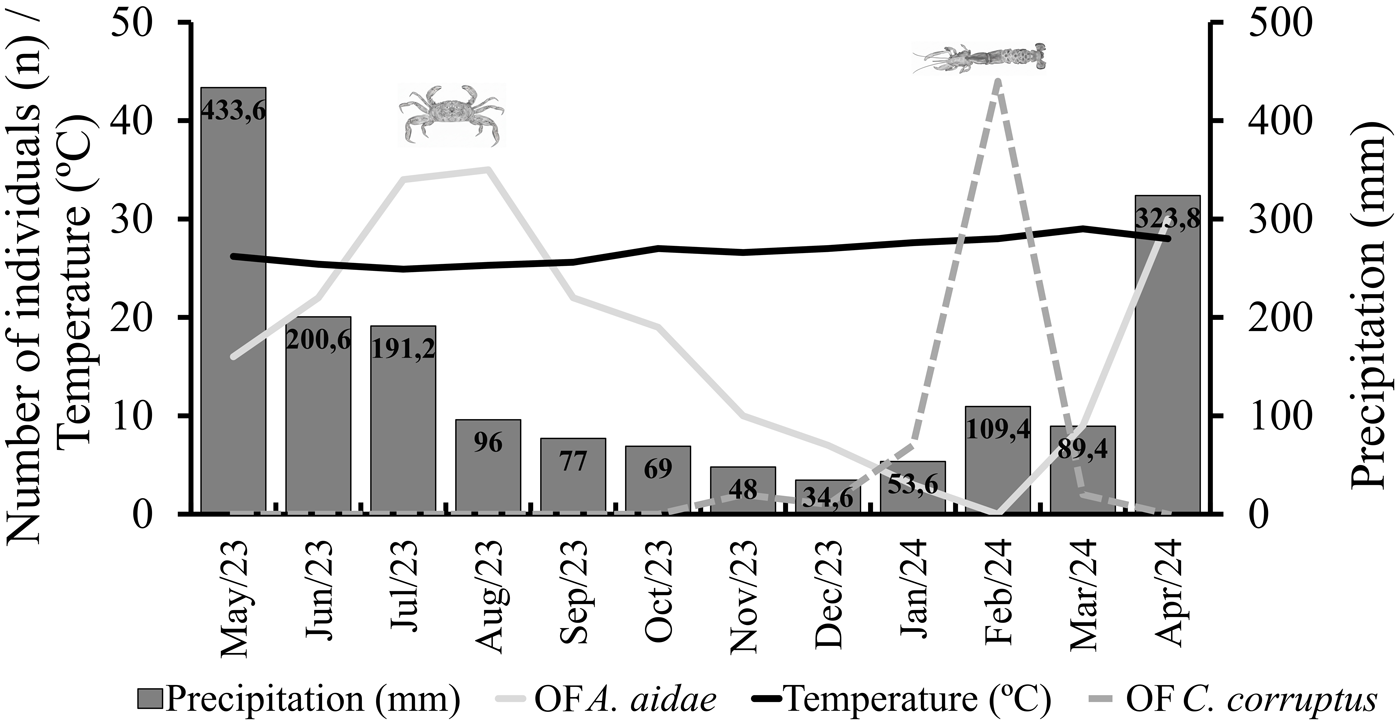
The observed occurrence rate of crabs per burrow ranged from 37% in February 2024 to 78% in August 2023, demonstrating variation during the sampling period. In February, no undifferentiated juveniles or ovigerous females were found in the population, whereas these two age groups were more frequent in August (Figure 3). The occurrence of ovigerous females in the population was recorded throughout almost all sampling months, with peaks between June and August 2023 and in April 2024. These periods of greater presence of ovigerous females occurred in the rainiest months, beginning in May with a total monthly precipitation of 433.6 mm and extending until July, with precipitation reaching 191.2 mm (Figure 4).
Monthly relative frequency (%) of the symbiotic crab Austinixa aidae by demographic category (juveniles, females, ovigerous females, and males) at Cinelândia Beach, Aracaju, SE. Values inside the bar segments indicate the absolute number of individuals (n) collected in each category.

Figure 3 Long description
A stacked vertical bar graph titled Austinixa aidae. The y axis label is Relative frequency left parenthesis percent right parenthesis, with tick labels 0 percent, 20 percent, 40 percent, 60 percent, 80 percent, 100 percent. The x axis categories are May dash 23, Jun dash 23, Jul dash 23, Aug dash 23, Sep dash 23, Oct dash 23, Nov dash 23, Dec dash 23, Jan dash 24, Feb dash 24, Mar dash 24, Apr dash 24. A legend lists Juveniles, Females, Ovigerous females, Males. Each bar is stacked into four segments with numbers printed inside segments. May dash 23: segment values 0, 46, 16, 53. Jun dash 23: segment values 3, 46, 22, 51. Jul dash 23: segment values 7, 31, 34, 59. Aug dash 23: segment values 17, 41, 35, 58. Sep dash 23: segment values 14, 42, 22, 55. Oct dash 23: segment values 4, 45, 19, 48. Nov dash 23: segment values 1, 45, 10, 38. Dec dash 23: segment values 2, 40, 7, 43. Jan dash 24: segment values 3, 51, 3, 57. Feb dash 24: segment values 0, 24, 0, 25. Mar dash 24: segment values 2, 31, 9, 34. Apr dash 24: segment values 2, 27, 30, 39.
Monthly variations in the abundance of ovigerous females of Austinixa aidae and Callichirus corruptus, mean temperature (°C), and accumulated precipitation (mm) at Cinelândia Beach, Aracaju, SE, Brazil, from May 2023 to April 2024. Bars represent precipitation (associated with the right Y-axis), with absolute values (mm) indicated inside each column. Lines (associated with the left Y-axis) represent the mean temperature (°C) (solid black line) and the number of individuals (n) of ovigerous females of A. aidae (solid light grey line) and C. corruptus (dashed light grey line).

Figure 4 Long description
The image contains a mixed bar and line graph displaying monthly data from May 2023 to April 2024. The horizontal axis lists months: May 23, Jun 23, Jul 23, Aug 23, Sep 23, Oct 23, Nov 23, Dec 23, Jan 24, Feb 24, Mar 24, Apr 24. The left vertical axis is labeled Number of individuals (n) with a range from 0 to 50. The right vertical axis is labeled Precipitation (mm) with a range from 0 to 500. Bars represent precipitation values: May 23: 433.6 mm, Jun 23: 200.6 mm, Jul 23: 191.2 mm, Aug 23: 96 mm, Sep 23: 77 mm, Oct 23: 69 mm, Nov 23: 48 mm, Dec 23: 34.6 mm, Jan 24: 14.6 mm, Feb 24: 0 mm, Mar 24: 109.4 mm, Apr 24: 32.8 mm. A solid black line represents mean temperature (degree celsius), associated with the left axis, showing a relatively stable trend across months. Two additional lines represent the number of individuals of ovigerous females: Austinixa aidae (solid light grey line) and Callichirus corruptus (dashed light grey line). The solid light grey line peaks in August 23, while the dashed light grey line peaks in February 24. The graph shows a correlation between precipitation and the abundance of ovigerous females, with higher numbers during rainier months. Visual differentiation is provided by bars for precipitation and distinct line styles for temperature and species data.
Cross-correlation analysis revealed that precipitation positively influenced the abundance of ovigerous females with a 2-month lag (Lag 2; R = 0.67; T = 2.89; P < 0.05). Furthermore, from September to December, the incidence of ovigerous females gradually decreased until January and February 2024, when only three ovigerous females were recorded in January, and none were recorded in February. Cross-correlation analysis also confirmed that temperature negatively influenced the abundance of ovigerous females at lags of −1 (R = −0.74; T = −3.87; P < 0.05) and 0 (R = −0.63; T = −2.58; P < 0.05).
Similar to ovigerous females, the highest incidence of undifferentiated juveniles and the smallest population size classes were recorded in July, August, and September. The cross-correlation with the precipitation variable was positive with a lag of 3 months (R = 0.74; T = 3.51; P < 0.05). These juveniles were also positively correlated with the frequency of ovigerous females at lags of 0 (R = 0.62; T = 2.54; P < 0.05) and 1 (R = 0.76; T = 3.79; P < 0.05). Thus, these months were the recruitment period of the species and followed its reproductive peaks.
The sex ratio of A. aidae did not differ significantly from the expected proportion of 1:1 over the months; however, when analysing the total number, it was observed that the proportion was biased in favour of females (chi-square = 14.02; p = 0.0001), with a proportion of 0.80:1. Regarding the analysis by size classes, the ratio did not differ significantly from 1:1 in most classes (p > 0.05), except for the upper-intermediate classes 6–|7 mm and 7–|8 mm, which exhibited a significant bias towards females (ratios of 0.66:1, chi-square = 9.96, p = 0.002; 0.52:1, chi-square = 25.4, p < 0.001, respectively). In contrast, the largest size classes (8–|9 mm and 9–|10 mm) exhibited a numerical trend towards male dominance (ratios of 1.03:1 and 2.40:1, respectively), although these deviations were not statistically significant (p = 0.856 and p = 0.089, respectively).
Callichirus corruptus
A total of 345 individuals were collected, including 197 females (including ovigerous and non-ovigerous females; 57%), 113 males (33%), and 35 undifferentiated juveniles (10%). The CL of females ranged from 9.63 to 20.88 mm (mean ± SD = 15.51 ± 2.59 mm), that of males from 9.40 to 19.69 mm (mean ± SD = 13.91 ± 2.70 mm), and that of undifferentiated juveniles ranged from 5.79 to 9.9 mm (mean ± SD = 7.97 ± 1.58 mm). Unlike crabs, the hosts showed a difference in CL between sexes (t = −4.57; p < 0.001), demonstrating that females were larger than males.
The time series correlation between the total number of host individuals over the months in relation to abiotic factors was not significant for any of the investigated variables. However, positive correlations were observed between the number of ovigerous females and the mean atmospheric temperature with lag −1 (R = 0.62; T = 2.55; P < 0.05).
The size class distribution of C. corruptus showed a non-normal pattern for the total population (D = 0.076; P < 0.05), with a higher peak in the class between 15 and 17 mm CL and a rapid decline in the last class (19–21 mm). In the analysis of size classes in each sampling month (Figure 5), October 2023 (D = 0.166; P < 0.05), February 2024 (D = 0.134; P < 0.05), and March 2024 (D = 0.142; P < 0.05) presented a non-normal distribution. The smallest size classes had a predominance of undifferentiated juveniles, whereas the largest size classes had more females, mainly ovigerous.
Distribution of size frequencies (CL = carapace length) of Callichirus corruptus collected from Cinelândia Beach, Aracaju, SE, Brazil, from May 2023 to April 2024. Values inside the panels indicate the absolute number of individuals (n) collected in each month.

Figure 5 Long description
The image showing 12 grouped bar charts titled May 2023, June 2023, July 2023, August 2023, September 2023, October 2023, November 2023, December 2023, January 2024, February 2024, March 2024 and April 2024. Legend categories: Juveniles, Females, Ovigerous females, Males. Shared axes for all charts. Horizontal axis: size class bins labeled 3 dash 5, 5 dash 7, 7 dash 9, 9 dash 11, 11 dash 13, 13 dash 15, 15 dash 17, 17 dash 19, 19 dash 21. Vertical axis label: N degree sign of individuals. Vertical axis range: 0 to 20. May 2023: n equals 33. June 2023: n equals 55. July 2023: n equals 21. August 2023: n equals 20. September 2023: n equals 15. October 2023: n equals 28. November 2023: n equals 12. December 2023: n equals 23. January 2024: n equals 17. February 2024: n equals 57. March 2024: n equals 29. April 2024: n equals 35. Across the 12 charts, bars are present in multiple size classes, with the tallest bars most often appearing in the 15 dash 17 and 17 dash 19 size classes. Several months show small or near zero bars in the smallest size classes 3 dash 5 and 5 dash 7. February 2024 shows the highest total n value, n equals 57 and includes tall bars in the larger size classes, including 15 dash 17, 17 dash 19 and 19 dash 21. June 2023 shows n equals 55 and includes multiple bars across mid to larger size classes, including 11 dash 13 through 19 dash 21. November 2023 shows the lowest total n value, n equals 12, with short bars across fewer size classes. The figure presents the same size class bins and the same N degree sign of individuals scale for each month, allowing comparison of the monthly distributions from May 2023 through April 2024.
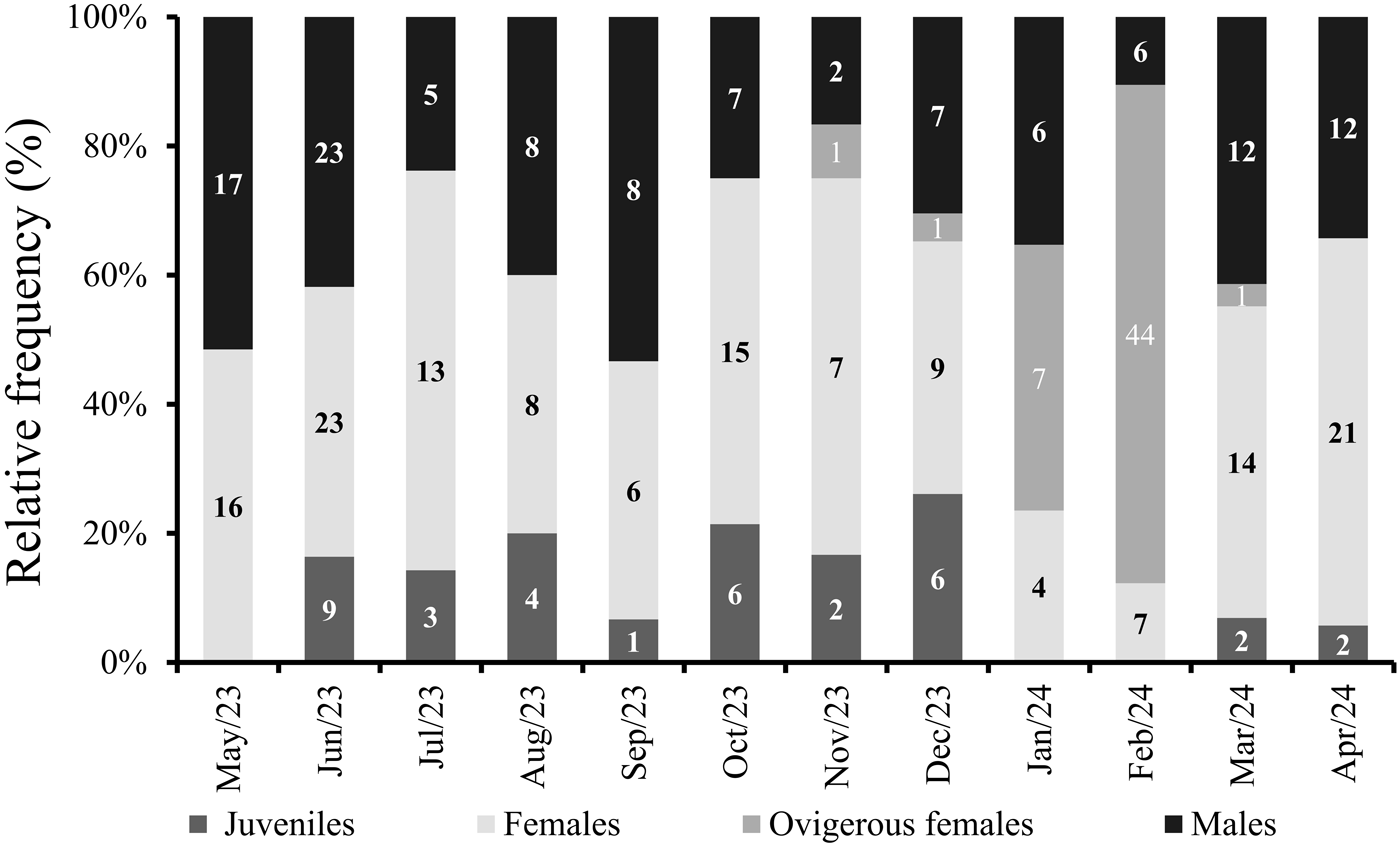
During the sampling period, ovigerous females were recorded from November 2023 onwards, with a sharp increase in abundance in February 2024, when most females were found carrying eggs (Figure 6), characterizing the reproductive period of the species. Thus, the reproductive peak of C. corruptus was recorded during the hottest period of the year, with lower rainfall than during other periods (Figure 4). Undifferentiated juveniles were found in almost all sampling months; however, no significant cross-correlation with environmental variables or the frequency of ovigerous females was detected.
Monthly relative frequency (%) of Callichirus corruptus grouped by demographic categories (juveniles, females, ovigerous females, and males) at Cinelândia Beach, Aracaju, SE. Values inside the bar segments indicate the absolute number of individuals (n) collected in each category.

Figure 6 Long description
The stacked bar graph has the y axis label Relative frequency left parenthesis percent right parenthesis, with tick labels 0 percent, 20 percent, 40 percent, 60 percent, 80 percent and 100 percent. The x axis shows months: May23, Jun23, Jul23, Aug23, Sep23, Oct23, Nov23, Dec23, Jan24, Feb24, Mar24 and Apr24. A legend lists four categories: Juveniles, Females, Ovigerous females and Males. Each month is shown as one stacked bar with numbers printed inside the segments. May23: Juveniles 0, Females 16, Ovigerous females 0, Males 17. Jun23: Juveniles 9, Females 23, Ovigerous females 0, Males 23. Jul23: Juveniles 3, Females 13, Ovigerous females 0, Males 5. Aug23: Juveniles 4, Females 8, Ovigerous females 0, Males 8. Sep23: Juveniles 1, Females 6, Ovigerous females 0, Males 8. Oct23: Juveniles 6, Females 15, Ovigerous females 0, Males 7. Nov23: Juveniles 2, Females 7, Ovigerous females 1, Males 2. Dec23: Juveniles 6, Females 9, Ovigerous females 1, Males 7. Jan24: Juveniles 0, Females 4, Ovigerous females 7, Males 6. Feb24: Juveniles 0, Females 7, Ovigerous females 44, Males 6. Mar24: Juveniles 2, Females 14, Ovigerous females 1, Males 12. Apr24: Juveniles 2, Females 21, Ovigerous females 0, Males 12.
The total sex ratio of C. corruptus differed significantly in favour of females (chi-square = 22.65; p < 0.001), with a ratio of 0.58:1. The same bias occurred in the months of July 2023 (chi-square = 4.26; p = 0.003; proportion of 0.36:1), November 2023 (chi-square = 4.45; p = 0.034; proportion of 0.22:1), and February 2024 (chi-square = 33.39; p < 0.001; proportion of 0.14:1). Regarding the analysis by size classes, the sex ratio followed the expected 1:1 proportion in the smaller classes up to 13 mm (p > 0.05). However, a significant female-biased deviation was observed in the larger classes ranging from 13 to 19 mm (13–|15 mm: ratio 0.59:1, chi-square = 4.63, p = 0.031; 15–|17 mm: ratio 0.46:1, chi-square = 12.2, p < 0.001; 17–|19 mm: ratio 0.34:1, chi-square = 15.3, p < 0.001). The female bias observed in the largest size class (19–|21 mm, ratio 0.33:1) was not statistically significant (chi-square = 3.00, p = 0.083).
A low but significant correlation was observed between the number of crabs per burrow and host size, demonstrating a tendency towards an increase in the number of guests in larger hosts (R = 0.22; T = 2.73; P = 0.007). A similar pattern was observed in relation to the size of the guests and hosts sharing the same burrow (R = 0.39; T = 3.33; P = 0.001).
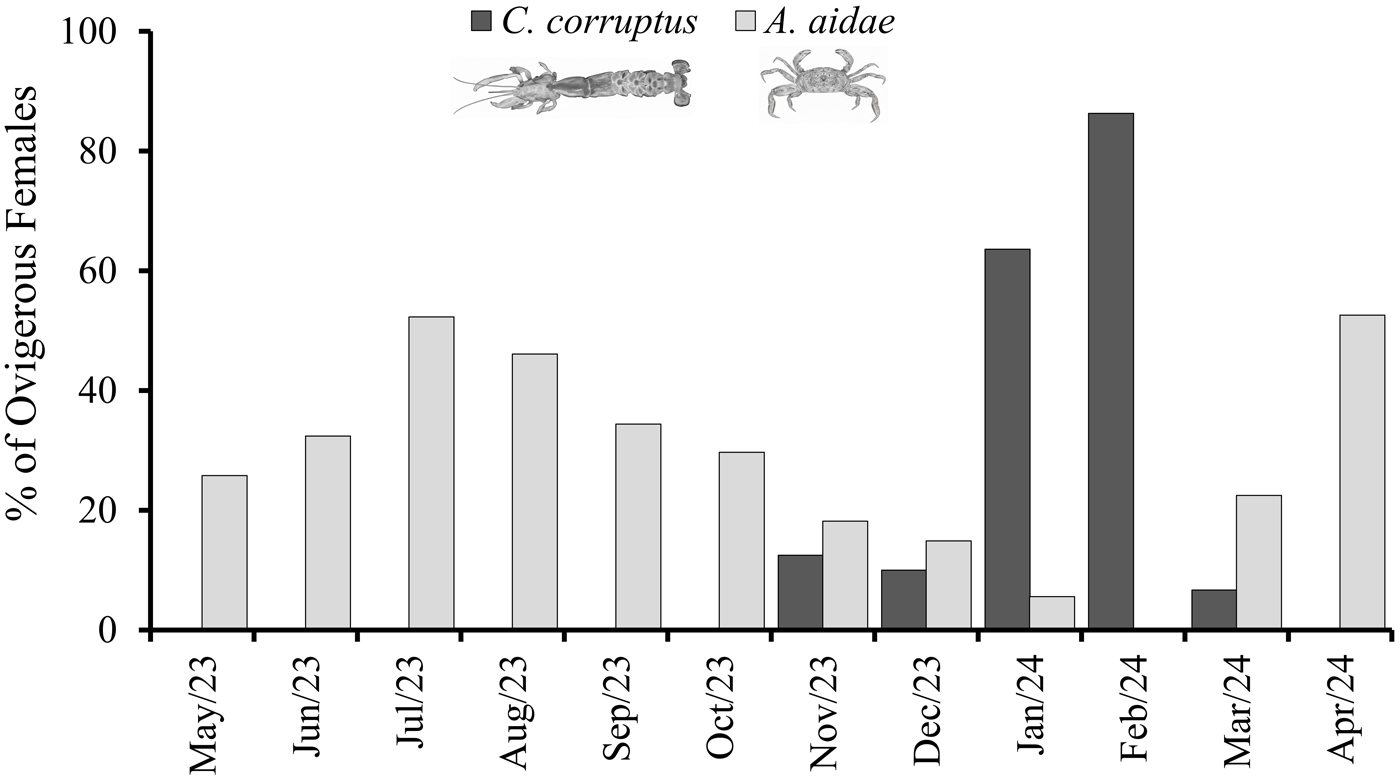
No significant correlation was observed between the abundance of guests and hosts (R = −0.43; T = −1.45; P = 0.17). However, a significant negative correlation was found between the percentage of ovigerous females of C. corruptus and A. aidae (R = −0.76; T = −3.73; P = 0.003), indicating that in months where the number of ovigerous females of one species increases, the other decreases (Figure 7). There were also negative correlations of ovigerous females of C. corruptus with the abundance of crabs (R = −0.65; T = −2.75; P = 0.02) and with the percentage of burrows occupied by guests in relation to the total investigated (R = −0.79; T = −4.20; P = 0.001). Finally, no significant correlation was observed in relation to the recruitment period of the species (R = 0.09; T = 0.28; P = 0.78).
Frequency of ovigerous females of Austinixa aidae and its host Callichirus corruptus collected between May 2023 and April 2024 at Cinelândia Beach, Aracaju, SE.

Figure 7 Long description
The bar graph displays the percentage of ovigerous females for two species, Callichirus corruptus and Austinixa aidae, from May 2023 to April 2024. The x-axis lists months from May 23 to Apr 24, while the y-axis represents the percentage of ovigerous females, ranging from 0 to 100 percent. The graph uses dark bars for C. corruptus and light bars for A. aidae. Key values include: May 23: A. aidae approximately 25 percent; Jun 23: A. aidae approximately 30 percent; Jul 23: A. aidae approximately 55 percent; Aug 23: A. aidae approximately 50 percent; Sep 23: A. aidae approximately 35 percent; Oct 23: A. aidae approximately 30 percent; Nov 23: C. corruptus approximately 15 percent, A. aidae approximately 20 percent; Dec 23: C. corruptus approximately 10 percent, A. aidae approximately 15 percent; Jan 24: C. corruptus approximately 70 percent, A. aidae approximately 5 percent; Feb 24: C. corruptus approximately 90 percent; Mar 24: C. corruptus approximately 10 percent, A. aidae approximately 30 percent; Apr 24: A. aidae approximately 60 percent. The graph shows that A. aidae consistently has higher percentages in most months, except for January and February 2024, where C. corruptus peaks. The data highlights the seasonal variation in ovigerous females between the two species.
Comparisons of the mean sizes of A. aidae and C. corruptus with sizes reported in other studies revealed a latitudinal trend, with populations from the southeast being larger than those from the northeast (Tables 1 and 2).
Morphometric comparison between two distinct populations of Austinixa aidae

Table 1 Long description
The table compares body size measurements for Austinixa aidae from two locations, reported separately for males and females. For Cinelândia Beach in southeastern Brazil, mean carapace width is 5.40 millimeters with a standard deviation of 1.53 for males and 5.51 millimeters with a standard deviation of 1.52 for females; maximum carapace length is 9.03 millimeters for males and 8.72 millimeters for females. For Ubatuba in São Paulo, mean carapace width is 6.13 millimeters with a standard deviation of 2.24 for males and 6.27 millimeters with a standard deviation of 2.03 for females; maximum carapace length is 10.10 millimeters for males and 10.50 millimeters for females. Across both sexes, the Ubatuba population shows larger average width and larger maximum length than the Cinelândia population. Within each population, females have slightly higher mean width than males, while maximum length is higher for males at Cinelândia and higher for females at Ubatuba. The table provides summary statistics only, so it does not indicate sample sizes or whether differences are statistically significant.
CW, carapace width. Values are presented as range followed by arithmetic mean ± standard deviation (SD) in parentheses.
Discussion
The results obtained showed asynchrony between the reproductive periods of A. aidae and its host C. corruptus. Positive correlations were also observed between host size, number, and C. corruptus size, suggesting that larger hosts may represent a better resource for symbiotic crabs. A latitudinal trend in the size of the species was also found, as both species had smaller sizes than those recorded for populations at higher latitudes (Tables 1 and 2).
Among the environmental factors, only precipitation showed variations between sampling months, whereas the other factors showed patterns with low amplitudes. This is expected, given that this is a tropical region with a seasonal thermal regime showing few variations. Among the environmental parameters analysed, precipitation is the main climatic factor, varying between the rainy and dry seasons (Amâncio-Martinelli et al., Reference Amâncio-Martinelli, Santana and Guimarães2013). Salinity generally varies across seasons, being lower during the rainy season because of increased freshwater inflow to the coastal region (Alves-Júnior et al., Reference Alves-Júnior, Araújo and Coelho2014). However, this was not observed in the present study.
Despite the low temperature range, A. aidae abundance decreased with increasing temperatures. Possible explanations for this response may lie in the reaction of C. corruptus to similar variations. Increased temperature can accelerate the metabolism of burrowing shrimp (Posey, Reference Posey1986), favouring sexual activity and embryonic development (Hill, Reference Hill1977; Alves-Júnior et al., Reference Alves-Júnior, Araújo and Coelho2014). Thus, the host relies on more resources to meet its needs, reducing their availability to crabs, which apparently responded with a decline in burrow occupancy.
Precipitation is an important abiotic factor for crabs, influencing the occurrence of conditions favourable for increased population abundance (Lønborg et al., Reference Lønborg, Müller, Butler, Jiang, Ooi, Trinh, Wong, Ali, Cui, Siong, Yando, Friess, Rosentreter, Eyre and Martin2021). This variable is responsible for increasing the input of nutrients from rivers into the coastal zone (Lønborg et al., Reference Lønborg, Müller, Butler, Jiang, Ooi, Trinh, Wong, Ali, Cui, Siong, Yando, Friess, Rosentreter, Eyre and Martin2021). This results in a greater availability of suspended organic matter and increased primary production in the region (Rosa et al., Reference Rosa, Freire and Souza2018). Thus, crabs may benefit from and respond positively to increased precipitation.
The mean crab size in A. aidae did not differ between males and females. This same result was observed in the Perequê-açu Beach population in Ubatuba, São Paulo (Peiró and Mantelatto, Reference Peiró and Mantelatto2011), although with some differences in the results. The mean and maximum sizes for males and females were larger than those observed in the Aracaju, Sergipe population (Table 1). These differences may be attributed to environmental factors arising from a latitudinal cline (Hirose et al., Reference Hirose, Fransozo, Tropea, López-Greco and Negreiros-Fransozo2012) or adaptations to their host, C. corruptus, which may provide different conditions for the two populations. Larger hosts offer increased burrow space and higher nutrient availability; as the water flow entering the burrow is enhanced by the host’s size, the symbionts benefit from a greater supply of suspended particles and oxygen (Jaramillo et al., Reference Jaramillo, Salas-Yanquin, Büchner-Miranda, Cubillos, Montory, Jan, Luis and Oscar2023).
Regarding C. corruptus, the occurrence of females larger than males is a common characteristic of this species and may be associated with reproductive factors (Alves-Júnior et al, Reference Alves-Júnior, Araújo and Coelho2014), which may indicate the lack of sexual selection regarding male size, as occurs in other species of burrowing shrimp (Rio et al., Reference Rio, Hernáez and Pinheiro2019). Thus, sexual size dimorphism in this species indicates that females invest more energy in somatic growth than males, enhancing reproductive success (Castilho et al., Reference Castilho, Gavio, Costa, Boschi, Bauer and Fransozo2007; Santos et al., Reference Santos, Simões, Bochini, Costa and Costa2015).
The mean size of C. corruptus recorded in this study corroborates the latitudinal gradient observed for the species along the Brazilian coast (Table 2). Individuals from lower latitudes, such as those in Pernambuco (07°–08° S), have lower mean CLs, ranging from 10.26 to 11.0 mm (Silva et al., Reference Silva, Shinozaki-Mendes, Marinho, Costa, Matoso and Botter-Carvalho2025), whereas populations from the Southeast (23° S) exhibit higher values, reaching 17.5 mm (Rio et al., Reference Rio, Hernáez and Pinheiro2019). This variation can be explained by climatic factors and the availability of resources (Rosa et al., Reference Rosa, Freire and Souza2018), following the trend of greater somatic growth in waters with lower mean annual temperatures (Blanckenhorn et al., Reference Blanckenhorn, Stillwell, Young, Fox and Ashton2006). However, although the mean size demonstrates a latitudinal pattern, the maximum size does not seem to corroborate this result, generating an apparent contradiction. Although recent studies suggest using maximum size in decapods to avoid bias imposed by fishing pressure (Farias et al., Reference Farias, Alves, Jacobina and Martinez2025), the use of maximum sizes can make analyses susceptible to sampling outliers. To overcome this distortion, studies that consolidate the ecophysiological responses of ectotherms to latitude and temperature tend to use mean body size (Atkinson, Reference Atkinson1994); therefore, this approach has been used in different studies that analysed the influence of the latitudinal gradient in crabs (Papacostas and Freestone, Reference Papacostas and Freestone2016; Hirose et al., Reference Hirose, Fransozo, Tropea, López-Greco and Negreiros-Fransozo2012).
Comparative morphometric data of Callichirus corruptus populations along the Brazilian coast

Table 2 Long description
The table compares carapace length measurements, in millimeters, for male and female Callichirus corruptus from multiple Brazilian coastal populations reported by different studies. For each site and sex, it lists the mean size with standard deviation and the maximum observed size. Females are usually larger than males, including at Conceição Beach in Pernambuco, Cinelândia Beach in Sergipe, and all São Paulo sites. Pernambuco shows the smallest male mean sizes, with the lowest at Piedade Beach in Silva et al. 2025, while São Paulo populations have the largest mean sizes for both sexes, with female means around the high teens. The largest maximum size in the table is a female from Piedade Beach in Silva et al. 2025, reaching 26.26 millimeters, exceeding maxima reported for São Paulo. Piedade Beach appears in two different studies with different coordinates and shows differing mean sizes by sex, indicating results may vary by sampling, methods, or population differences. Some São Paulo latitude information is not available for certain entries, which limits geographic comparisons for those rows.
CL, carapace length; n.a., information not available in the original study. Values are presented as range followed by arithmetic mean ± standard deviation (SD) in parentheses.
Thus, regarding average body size, the latitudinal effects on A. aidae and C. corruptus populations fit the pattern already observed for other marine crustaceans (Farias et al., Reference Farias, Alves, Jacobina and Martinez2025), where increased latitude is reflected in larger individuals (Castilho et al., Reference Castilho, Gavio, Costa, Boschi, Bauer and Fransozo2007). According to Farias et al. (Reference Farias, Alves, Jacobina and Martinez2025), variations in salinity and temperature can influence the size of individuals in different populations. Therefore, the lower temperatures found at higher latitudes allow the symbiont and its host to reach larger sizes, as do other marine organisms (Forster et al., Reference Forster, Hirst and Atkinson2012). In colder waters, individuals take longer to reach sexual maturity, allowing for greater investment in somatic growth, whereas in populations at lower latitudes, sexual maturity tends to be earlier, with individuals reaching smaller body sizes (Castilho et al., Reference Castilho, Gavio, Costa, Boschi, Bauer and Fransozo2007; Santos et al., Reference Santos, Simões, Bochini, Costa and Costa2015).
A. aidae presented ovigerous females throughout almost all months of collection, a pattern that appears to be common to this and other species of the same genus (Peiró and Mantelatto, Reference Peiró and Mantelatto2011; João and Hernáez, Reference João and Hernáez2021), demonstrating a continuous seasonal pattern (Pinheiro and Terceiro, Reference Pinheiro and Terceiro2000) in which the species reproduces throughout the year, but with more favourable periods for reproduction. In the Perequê-Açu Beach population in Ubatuba, the species’ reproductive peaks were recorded between November and May (Peiró et al., Reference Peiró, Mossolin and Mantelatto2014), whereas in this study, they were recorded between June and August. This variation is possibly influenced by climatic factors in each region, such as rainfall, which provides favourable conditions for females to obtain resources (Nóbrega et al., Reference Nóbrega, Quaresma, Lima and Martinelli-Lemos2021). While at Cinelândia Beach in Aracaju, Sergipe, the rainy season occurs in winter, in Ubatuba, São Paulo, it occurs in summer (Blain, Reference Blain2010). The seasonal pattern of precipitation in tropical and subtropical regions causes changes in terrestrial runoff between dry and rainy periods, generating seasonal variations in the supply of nutrients to coastal waters (Lønborg et al., Reference Lønborg, Müller, Butler, Jiang, Ooi, Trinh, Wong, Ali, Cui, Siong, Yando, Friess, Rosentreter, Eyre and Martin2021). This nutritional variation may explain the reproductive peak of both populations during the rainy season, as precipitation has been identified as an important factor in regulating reproductive activity in other crustaceans (Saeedi et al., Reference Saeedi, Kamrani, Nordhaus and Diele2018; Hernáez et al., Reference Hernáez, Villegas-Castro, Duarte and Pinheiro2019b).
The reproductive period of C. corruptus occurs in summer, as reported in other studies, in which increased temperatures stimulate gonadal development (Botter-Carvalho et al., Reference Botter-Carvalho, Santos and Carvalho2007; Alves-Júnior et al., Reference Alves-Júnior, Araújo and Coelho2014; Rosa et al., Reference Rosa, Freire and Souza2018). For the Sergipe population, Rosa et al. (Reference Rosa, Freire and Souza2018) recorded ovigerous females exclusively from November to March, with a reproductive peak in December and January. In the present study, the peak occurred in February. This represents a minor seasonal variation that does not indicate a significant shift in the species’ reproductive cycle, even after a nearly 10-year interval.
Thus, reproductive asynchrony was observed between A. aidae and its host, evidenced by a negative correlation between the frequencies of ovigerous females of both species. This divergence may be an adaptation of the symbiont to its host, avoiding competition for nutrients, which can be intense during the summer due to the need for C. corruptus to allocate resources for reproduction. C. corruptus are positively affected by increased temperature, which accelerates their metabolism and allows males to dig internal tunnels to the females’ burrows without exposing themselves to the external environment (Alves-Júnior et al., Reference Alves-Júnior, Araújo and Coelho2014; Constantino et al., Reference Constantino, Ferreira, Zalmon and Soares-Gomes2024). However, we do not rule out the possibility that species respond differently to external factors or use different food resources. Another hypothesis to explain the results of reproductive asynchrony is based on the fact that during the reproductive period, female C. corruptus migrate to the upper regions of the burrow (Alves-Júnior et al., Reference Alves-Júnior, Santana, Figueiredo and Araújo2018), the same region occupied by the symbiotic crabs. This change in behaviour could trigger an aggressive habit, leading to the expulsion of the symbionts from the burrows. This would also explain why few A. aidae individuals are found in burrows during this period. The aggressiveness of the C. corruptus species has been previously reported (Constantino et al., Reference Constantino, Ferreira, Zalmon and Soares-Gomes2024); however, this relationship with its symbiont still needs to be better understood.
The female-biased sex ratio observed in this study for A. aidae and C. corruptus demonstrates that males may be subject to selective forces that increase mortality, or that sampling biases are present, both of which can lead to a deviation from the expected 1:1 ratio. For the host C. corruptus, this deviation is strongly influenced by the efficiency of the sampling method combined with the species’ reproductive behaviour. Females, particularly ovigerous ones, tend to occupy the shallower portions of the burrows to improve oxygenation and ventilation of their embryos, making them significantly more susceptible to capture by suction pumps (Nates and Felder, Reference Nates and Felder1999; Botter-Carvalho et al., Reference Botter-Carvalho, Santos and Carvalho2007). Additionally, another hypothesis is that disputes between males within burrows can increase male mortality, further contributing to female dominance (Rio et al., Reference Rio, Hernáez and Pinheiro2019). In contrast, for A. aidae, according to the mating system proposed by Peiró et al. (Reference Peiró, Baeza and Mantelatto2013), males migrate between hosts in search of mates, increasing their exposure to predators (Vergamini and Mantelatto, Reference Vergamini and Mantelatto2008), corroborating the hypothesis of differential migration reported by Wenner (Reference Wenner1972). Thus, the sex ratio would be biased towards females, which have more cryptic and sedentary habits than males. Furthermore, an analysis of the size classes revealed that our data aligned with the standard pattern described by Wenner (Reference Wenner1972), which corresponded to the proximate pattern proposed by Peiró and Mantelatto (Reference Peiró and Mantelatto2011) for this group of symbionts. Although the upper-intermediate classes (6–|8 mm) showed a significant bias towards females, the largest size classes (8–|10 mm) exhibited a trend towards male dominance (reaching a ratio of 2.40:1). The lack of statistical significance in these final classes is likely due to the natural reduction in sample size at maximum lengths; however, the biological trend corroborates the pattern of male prevalence at extreme sizes.
In general, larger hosts can offer larger shelters and more food resources to symbionts (de Gier and Becker, Reference de Gier and Becker2020), and in the case of burrowing shrimp, this occurs with the existence of larger burrows and a greater flow of water containing organic food into the burrows (Constantino et al., Reference Constantino, Ferreira, Zalmon and Soares-Gomes2024). Therefore, the positive correlation may indicate that larger crabs tend to select larger hosts; however, this does not inhibit the occupation of conspecific hosts. When the host is large and complex, symbionts do not invest in defending it against other individuals, allowing aggregations to form on the same host (Baeza and Thiel, Reference Baeza and Thiel2003). In contrast, the high availability of burrows in the environment, including unoccupied burrows, allows many individuals to be found solitary and may also indicate that the aggregations of hosts encountered may be related to some other factor, such as reproduction, in addition to the provision of refuge and food.
The population structures of the two species differed from those at other latitudes, with changes in the reproductive peak of A. aidae and differences in the size of both species. Furthermore, A. aidae reproduces throughout the year and is favoured by rainy periods, whereas its host exhibits greater reproductive intensity during warmer months. This suggests that these two species may have coevolved to avoid resource competition. Thus, the results obtained allow for a better understanding of how distant populations shape their population structure in response to environmental conditions and how symbiotic species tend to adapt their occupancy and reproductive strategies to their hosts.
Acknowledgements
The authors would like to thank the entire team at the Carcinology Laboratory of the Federal University of Sergipe, David Pacheco, Rayssa Costa, Vinício Lins, and Sinara Moreira, for their support and assistance during the fieldwork. We also thank the Federal University of Sergipe and the Program of Ecology and Conservation (PPEC) for providing all facilities.
Author contributions
C.F.G. and G.L.H. conceptualized the study, designed the methodology, and performed the data collection and formal analyses. C.F.G. and G.L.H. wrote the manuscript. All authors have read and agreed to the final version of the manuscript.
Funding
This work was supported by Coordenação de Aperfeiçoamento de Pessoal de Nível Superior (CAPES) (C.F.G., grant number 88887.858269/2023-00).
Competing interests
The authors declare no conflict of interest.
Data availability
The data supporting the findings of this study are available from the corresponding author upon reasonable request.
Ethical standards
This research was conducted in compliance with relevant Brazilian national guidelines for animal welfare and collection, authorized under the SISBIO/ICMBio permit number 24097-5.