1. Background
Some of the most central and long-lasting controversies in philosophy of science have concerned various forms of ‘scientific realism’. Historically, one important set of issues characterized in these terms concerns the metaphysical status of unobservable entities and the semantic status of theoretical terms. In the late nineteenth and early twentieth centuries, a strand of positivistic idealism denied that unobservable entities could exist independently of our minds (e.g., Pearson Reference Pearson1911). Similarly, in the heyday of logical positivism, it was debated whether scientific theories should be interpreted literally as being about mind-independent parts of the world. The logical positivists denied this, arguing instead that theories should be interpreted as collections of actual or possible observations associated with the theory (e.g., Schlick Reference Schlick1936). In analytic philosophy of science, these debates are now largely considered settled in favor of the realist view that unobservable entities do exist mind-independently and scientific theories are straightforwardly true or false depending on the state of the world (including its unobservable aspects).Footnote 1 In the current article, we refer to this as metaphysical realism (MR).
Arguably, the central focus of recent debates under the heading of ‘scientific realism’ has concerned the epistemic status of a privileged set of scientific theories or theory parts. In this debate, scientific realists are roughly those who claim that empirically successful scientific theories, including what these theories say about unobservable entities, are typically at least approximately true. This statement of a type of epistemic realism (ER) is often qualified in various ways, for example, as extending only to certain parts of successful scientific theories, such as what these theories say about structures (Worrall Reference Worrall1989, Reference Worrall, Burian, Hull and Forbes1994), causes (Cartwright Reference Cartwright1983; Hacking Reference Hacking1983), or some combination of both (Chakravartty Reference Chakravartty2007; Egg Reference Egg2016). In support of ER, many realists appeal to some version of the no-miracles argument (NMA) according to which the approximate truth of current best theories can be inferred on the basis of its being the best explanation of their empirical success (Smart Reference Smart1963; Putnam Reference Putnam1975; Musgrave Reference Musgrave and Nola1988; Psillos Reference Psillos1999). Against ER, many antirealists appeal to some version of the pessimistic induction (PI) according to which current best theories will probably suffer the same fate as those numerous historical theories that were successful at the time but have now been discarded (Poincaré Reference Poincaré1905/1952; Hesse Reference Hesse, Suppes and Asquith1976; Laudan Reference Laudan1981a; Stanford Reference Stanford2006).
While ER is arguably the most debated dimension of scientific realism, there are other prominent debates in philosophy of science that have also been characterized as concerning ‘scientific realism’. Van Fraassen rejected ER as a legitimate definition of ‘scientific realism’, arguing that such a definition should not refer to any specific set of scientific theories such as those that are currently ‘best’ or ‘most successful’ (Reference van Fraassen1980, 7; see also Reference van Fraassen and Agazzi2017, 95–97). Instead, van Fraassen suggested that scientific realism amounts to the conjunction of two theses about acceptance and the aim of science, which we will refer to as van Fraassen realism (vFR): “Science aims to give us, in its theories, a literally true story of what the world is like; and acceptance of a scientific theory involves the belief that it is true” (Reference van Fraassen1980, 8). Van Fraassen’s antirealist alternative, constructive empiricism, denies both theses—roughly by replacing ‘true’ with ‘empirically adequate’: “Science aims to give us theories which are empirically adequate; and acceptance of a theory involves as belief only that it is empirically adequate” (12).Footnote 2
It is important to understand what exactly van Fraassen meant by characterizing realism and antirealism in terms of ‘acceptance’ and what science ‘aims to give us’. In speaking of the ‘aim’ of science, van Fraassen is referring to the basic criterion of success for scientific theories, that is, the fundamental standards against which scientific theories should be judged (Reference van Fraassen1980, 8; see also Reference van Fraassen and Agazzi2017, 98). The realist claims that scientific theories should be true, while the constructive empiricist insists that empirically adequate theories are just as good as far as science is concerned. By ‘acceptance’, van Fraassen is referring to whatever attitude scientists in fact have toward the theories they use in their scientific endeavors (e.g., in their explanations, predictions, and further theorizing; van Fraassen Reference van Fraassen1980, 12 and 151–52; see also Rosen Reference Rosen1994, 145). Thus, the issue of realism is partly about whether using theories for these purposes involves believing that those theories are true or merely that they are empirically adequate. Importantly, van Fraassen is adamant that constructive empiricism makes no claim whatsoever about what individual scientists do or should believe; rather, his concern is only with what kind of belief (if any) is involved in the scientific enterprise as such (Forrest Reference Forrest1994; Rosen Reference Rosen1994; van Fraassen Reference van Fraassen1994).
A final cluster of issues debated under the heading of ‘scientific realism’ concerns how science makes progress. In large part because of Bird’s (Reference Bird2007) defense of an epistemic view of scientific progress, the nature of progress in science has again become prominent in philosophy of science after lying dormant for a few decades. In this debate, scientific realism is frequently characterized as the idea that scientific progress is or involves getting closer to the truth, including the underlying truth about unobservable entities. Thus, what we will call progressive realism (PR) is the thesis that an episode in science is progressive when scientists have a more accurate account of the world, including its unobservable aspects, at the end of the episode than at its beginning. This thesis is denied by antirealist accounts of scientific progress, such as Kuhn’s (Reference Kuhn1970) and Laudan’s (Reference Laudan1977, Reference Laudan and Hacking1981b) problem-solving accounts and Rowbottom’s (Reference Rowbottom2019) instrumentalist account, and affirmed in different ways by various self-professed realist accounts (e.g., Bird Reference Bird2007; Niiniluoto Reference Niiniluoto2014, Reference Niiniluoto2017; Dellsén Reference Dellsén2016).
Although each of the aforementioned strands of scientific realism has been discussed and debated almost ad nauseam, there have been nearly no empirical investigations into how scientists themselves view these issues. This is surprising since working scientists are arguably in a better epistemic position with regard to a number of issues in these debates. For example, working scientists would seem to be in the best position to evaluate the epistemic merits of theories they currently accept, since they have access to, and awareness of, a greater variety of evidence than others who might want to evaluate these theories (including philosophers of science). Similarly, scientists themselves are surely in a better position than philosophers to tell whether their acceptance of a particular theory involves believing that the theory is true (as per vFR). Although scientists are by no means infallible judges of these matters, their opinions should at least be taken seriously enough to have an impact on these debates.
The central aim of our study was to investigate the attitudes of working scientists toward each strand of scientific realism: Are scientists themselves scientific realists—and if so, in what sense? Our aim was also to investigate the relationships between affirmations of different strands of realism, in order to gauge the extent to which different realism debates really are distinct in the minds of scientists themselves. Furthermore, we sought to compare the attitudes of working scientists in different fields—physics, chemistry, biology, economics, psychology, sociology, and anthropology—as well as to compare the attitudes of working scientists with the attitudes of those who study aspects of science that are of central relevance to scientific realism, that is, scholars in history and philosophy of science (HPS). Finally, we wanted to understand what other philosophical views about science, such as about the theory ladenness (TL) of observation and the ability of science to explain everything eventually, were associated with different strands of scientific realism within each field.
2. Materials, Procedure, and Participants
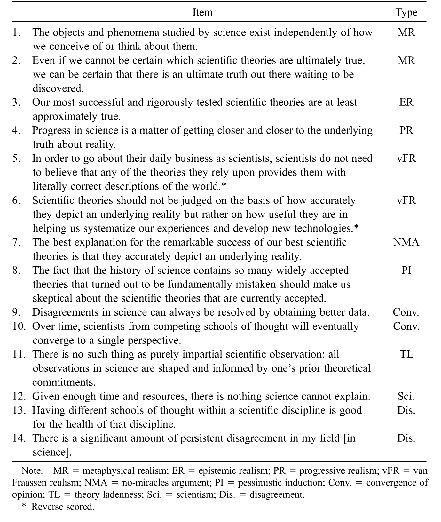
In order to probe the judgments of scientists and HPS scholars about each of the dimensions of scientific realism described above, we constructed the Scientific Realism Questionnaire (SRQ), the elements of which appear in table 1.Footnote 3 Participants were asked to read each statement and indicate the extent to which they agreed or disagreed with it by selecting one of the following answer choices: completely disagree, mostly disagree, slightly disagree, neither agree nor disagree, slightly agree, mostly agree, completely agree.
Questionnaire Items

| Item | Type | |
|---|---|---|
| 1. | The objects and phenomena studied by science exist independently of how we conceive of or think about them. | MR |
| 2. | Even if we cannot be certain which scientific theories are ultimately true, we can be certain that there is an ultimate truth out there waiting to be discovered. | MR |
| 3. | Our most successful and rigorously tested scientific theories are at least approximately true. | ER |
| 4. | Progress in science is a matter of getting closer and closer to the underlying truth about reality. | PR |
| 5. | In order to go about their daily business as scientists, scientists do not need to believe that any of the theories they rely upon provides them with literally correct descriptions of the world.* | vFR |
| 6. | Scientific theories should not be judged on the basis of how accurately they depict an underlying reality but rather on how useful they are in helping us systematize our experiences and develop new technologies.* | vFR |
| 7. | The best explanation for the remarkable success of our best scientific theories is that they accurately depict an underlying reality. | NMA |
| 8. | The fact that the history of science contains so many widely accepted theories that turned out to be fundamentally mistaken should make us skeptical about the scientific theories that are currently accepted. | PI |
| 9. | Disagreements in science can always be resolved by obtaining better data. | Conv. |
| 10. | Over time, scientists from competing schools of thought will eventually converge to a single perspective. | Conv. |
| 11. | There is no such thing as purely impartial scientific observation; all observations in science are shaped and informed by one’s prior theoretical commitments. | TL |
| 12. | Given enough time and resources, there is nothing science cannot explain. | Sci. |
| 13. | Having different schools of thought within a scientific discipline is good for the health of that discipline. | Dis. |
| 14. | There is a significant amount of persistent disagreement in my field [in science]. | Dis. |
Note. MR = metaphysical realism; ER = epistemic realism; PR = progressive realism; vFR = van Fraassen realism; NMA = no-miracles argument; PI = pessimistic induction; Conv. = convergence of opinion; TL = theory ladenness; Sci. = scientism; Dis. = disagreement.
* Reverse scored.
Most statements on the SRQ were formulated as statements of (some version of) scientific realism or some view that realists would probably be more inclined to endorse. We endeavored to make the statements simple and easy for scientists to understand and, thus, avoided semi-technical terms such as ‘unobservable’, ‘empirical adequacy’, ‘acceptance’, ‘aim of science’, and their cognates.Footnote 4 For purposes of analysis, a response of ‘completely disagree’ to one of these statements was scored as 1, ‘mostly disagree’ as 2, and so on. Responses to statements marked with an asterisk were reverse scored (e.g., ‘strongly agree’ was scored as 1). Each of the items in the SRQ makes a statement about science as a whole rather than about any particular scientific discipline. It should be noted that NMA and PI are standardly formulated as arguments about science as a whole rather than about particular sciences or scientific theories. Nevertheless, in a follow-up study, we will develop a questionnaire that asks participants separately about natural and social science.
The first six statements on the SRQ concerned the central dimensions of scientific realism. Statements 1 and 2 are formulations of MR. Item 3 is a statement of ER. Statement 4 is an expression of PR. And statements 5 and 6 reject scientific realism as characterized by van Fraassen (vFR).
The remaining eight statements on the SRQ concerned additional features of scientific practice, the responses to which we thought might shed light on responses to the first six. Statements 7 and 8 represent two of the most prominent arguments for and against ER in the philosophical literature (i.e., NMA and PI). We hypothesized that participants’ responses to these statements would correlate (positively and negatively, respectively) with their responses to 3. Statements 9 and 10 express the expectation that scientific disagreements are never ultimately fundamental, can always in principle be overcome, and will be replaced by convergence of opinion when sufficient data become available (Conv.). While these statements are not expressions of MR, ER, or PR, we expected them to positively correlate with participants’ responses to 1–4.
We also hypothesized that a strong endorsement of the theory-ladenness of observation (statement 11), positive views about expert disagreement (statement 13), and perceptions of disagreement within science (statement 14) would negatively predict participants’ realism scores and that agreement with the view that science can explain everything (statement 12) would positively predict them.
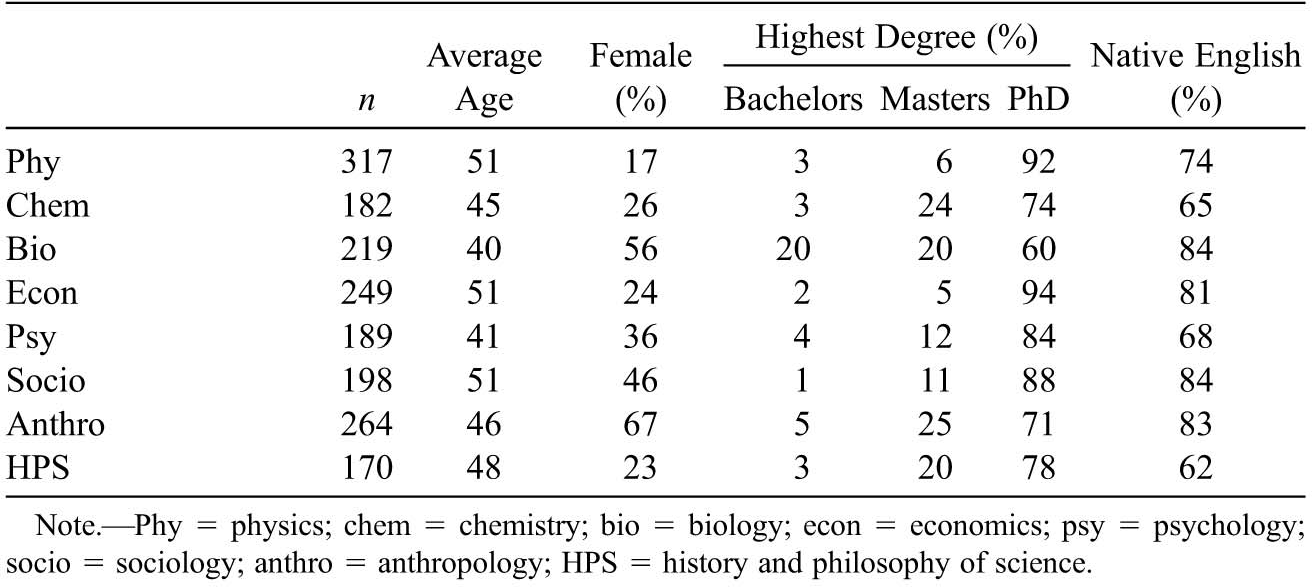
We recruited 1,798 scholars working in seven scientific disciplines (physics, chemistry, biology, economics, psychology, sociology, and anthropology) and in HPS, and asked them to respond to the 14 statements on the SRQ.Footnote 5 Participants were recruited between November 2016 and July 2017 via professional listservs and direct e-mail invitations (e-mail addresses were collected by hand from university departmental websites). The SRQ was hosted online. Test items were presented in counterbalanced order. Participants were asked to indicate the scientific discipline in which they worked and to provide basic demographic information about their age, gender, ethnicity, native language, and highest degree earned. Participant demographics are represented in table 2.
Participant Demographics

| n | Average Age | Female (%) | Highest Degree (%) | Native English (%) | |||
|---|---|---|---|---|---|---|---|
| Bachelors | Masters | PhD | |||||
| Phy | 317 | 51 | 17 | 3 | 6 | 92 | 74 |
| Chem | 182 | 45 | 26 | 3 | 24 | 74 | 65 |
| Bio | 219 | 40 | 56 | 20 | 20 | 60 | 84 |
| Econ | 249 | 51 | 24 | 2 | 5 | 94 | 81 |
| Psy | 189 | 41 | 36 | 4 | 12 | 84 | 68 |
| Socio | 198 | 51 | 46 | 1 | 11 | 88 | 84 |
| Anthro | 264 | 46 | 67 | 5 | 25 | 71 | 83 |
| HPS | 170 | 48 | 23 | 3 | 20 | 78 | 62 |
Note. Phy = physics; chem = chemistry; bio = biology; econ = economics; psy = psychology; socio = sociology; anthro = anthropology; HPS = history and philosophy of science.
3. Results: Realism Scores
The mean responses from each discipline to each item on the SRQ appear in table 3. Standard deviations appear in parentheses.
Mean Responses to Each Statement on the Scientific Realism Questionnaire, Organized by Participant Discipline

| Item | Physics | Chemistry | Biology | Economics | Psychology | Sociology | Anthropology | HPS |
|---|---|---|---|---|---|---|---|---|
| 1 (MR) | 6.0 (1.5) | 5.6 (1.7) | 5.4 (1.7) | 5.4 (1.6) | 4.7 (1.9) | 4.5 (1.9) | 4.2 (2.0) | 5.0 (1.9) |
| 2 (MR) | 5.0 (1.9) | 5.3 (1.9) | 5.3 (1.7) | 5.3 (1.6) | 4.9 (1.7) | 4.6 (1.9) | 3.6 (1.9) | 4.1 (2.0) |
| 3 (ER) | 6.0 (1.3) | 5.7 (1.3) | 5.7 (1.2) | 5.7 (1.0) | 5.2 (1.3) | 5.4 (1.2) | 5.1 (1.4) | 5.0 (1.5) |
| 4 (PR) | 5.5 (1.6) | 5.7 (1.4) | 5.8 (1.2) | 5.6 (1.3) | 5.3 (1.4) | 5.1 (1.5) | 4.0 (1.9) | 4.2 (1.9) |
| 5 (vFR) | 3.0 (1.9) | 3.2 (1.8) | 3.6 (1.9) | 2.6 (1.7) | 3.0 (1.7) | 3.1 (1.8) | 3.1 (1.7) | 2.8 (1.7) |
| 6 (vFR) | 3.9 (2.0) | 4.0 (1.8) | 4.4 (1.7) | 3.7 (1.7) | 3.8 (1.6) | 4.0 (1.8) | 3.7 (1.8) | 3.7 (1.9) |
| 7 (NMA) | 5.7 (1.4) | 5.7 (1.4) | 5.7 (1.1) | 5.5 (1.2) | 4.9 (1.5) | 5.2 (1.3) | 4.6 (1.8) | 4.6 (1.7) |
| 8 (PI) | 3.9 (2.0) | 4.4 (1.9) | 4.5 (1.8) | 4.6 (1.7) | 4.9 (1.7) | 4.5 (1.8) | 5.0 (1.7) | 4.6 (1.8) |
| 9 (Conv.) | 4.6 (1.9) | 4.7 (1.8) | 4.3 (1.7) | 3.8 (1.8) | 4.0 (1.8) | 3.7 (1.8) | 3.3 (1.8) | 3.1 (1.7) |
| 10 (Conv.) | 5.0 (1.5) | 4.7 (1.6) | 4.5 (1.6) | 3.9 (1.6) | 3.9 (1.7) | 3.2 (1.5) | 3.1 (1.6) | 3.8 (1.7) |
| 11 (TL) | 4.6 (1.9) | 5.0 (1.7) | 5.2 (1.5) | 4.9 (1.6) | 5.4 (1.6) | 5.4 (1.5) | 6.0 (1.3) | 5.5 (1.5) |
| 12 (Sci.) | 3.2 (2.0) | 3.9 (2.1) | 3.9 (2.2) | 3.0 (1.7) | 3.4 (1.9) | 2.8 (1.8) | 2.8 (1.8) | 2.8 (1.9) |
| 13 (Dis.) | 6.0 (1.0) | 6.0 (1.0) | 6.1 (0.9) | 5.6 (1.2) | 6.1 (0.9) | 6.0 (1.1) | 6.3 (0.8) | 5.9 (1.0) |
| 14 (Dis.) | 4.3 (1.7) | 4.2 (1.7) | 4.8 (1.6) | 5.6 (1.4) | 5.5 (1.3) | 5.6 (1.4) | 5.7 (1.2) | 5.0 (1.4) |
Note. Standard deviations in parentheses. MR = metaphysical realism; ER = epistemic realism; PR = progressive realism; vFR = van Fraassen realism; NMA = no-miracles argument; PI = pessimistic induction; Conv. = convergence of opinion; TL = theory ladenness; Sci. = scientism; Dis. = disagreement.
We begin by discussing statistical analyses of participants’ responses to statements 1–6 because these represent measures of what are taken to be the central dimensions of scientific realism. Since participant responses to statements 5 and 6 were reverse scored, a higher mean response to statements 1–6 indicates a more strongly realist response. A series of Kruskal-Wallis tests revealed significant between-discipline differences (all
 ) in participants’ responses to all statements.Footnote 6
A number of theoretically significant facts are immediately apparent from the first six rows of data in table 3. The most strongly realist responses are found among natural scientists, and the least realist responses tend to be found among anthropologists and HPS scholars. Responses are also more strongly realist among natural scientists than among social scientists. Some statements (e.g., 3, “Our most successful and rigorously tested scientific theories are at least approximately true”) garnered rather strongly realist responses across the board, while other statements (e.g., 5, “In order to go about their daily business as scientists, scientists do not need to believe that any of the theories they rely upon provides them with literally correct descriptions of the world”) garnered antirealist responses across the board.Footnote 7 We decided in advance of collecting and analyzing data that the various disciplines in our study would be arranged in all tables and figures according to traditional conceptions of what are the ‘hardest’ and ‘softest’ sciences. We do not endorse these traditional characterizations, but it is noteworthy that on almost all analyses we report, there is a significant downward trend in the degree of realism expressed as one moves from ‘hardest’ to ‘softest’ science.
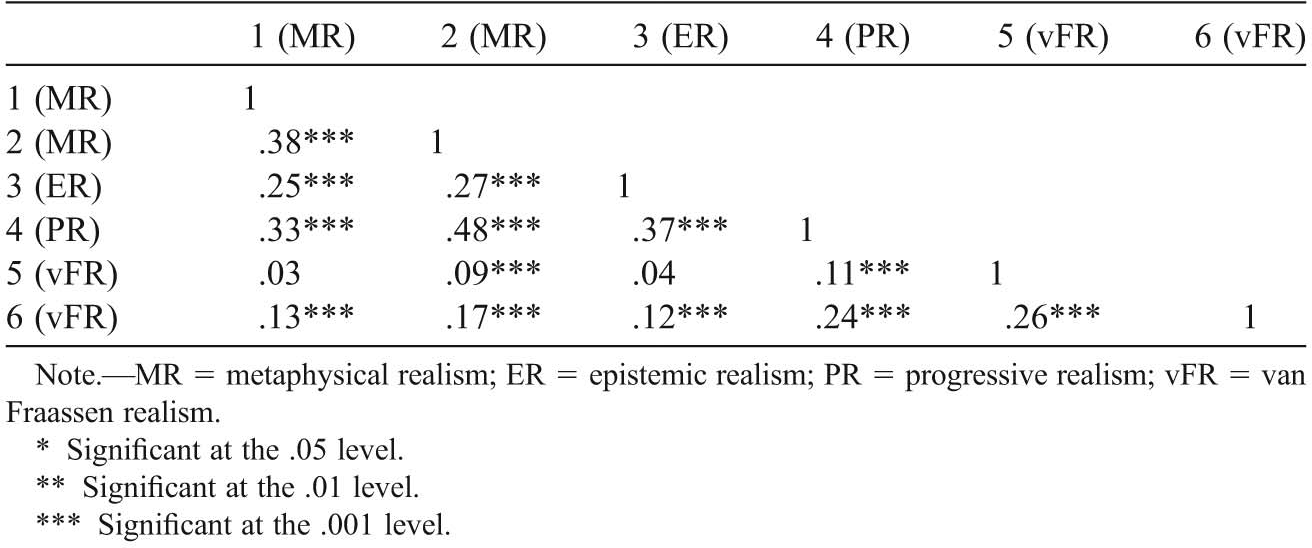
Kendall’s tau correlations between participants’ responses to the first six statements on the SRQ are represented in table 4. As expected, participant responses to the two statements of MR positively correlated with each other fairly well. The two statements of vFR correlated moderately well together but not as strongly as we anticipated. Statement 4, “Progress in science is a matter of getting closer and closer to the underlying truth about reality,” correlated fairly strongly with statements of MR and ER.
Kendall’s Tau Correlation Matrix for the First Six Statements on the Scientific Realism Questionnaire

| 1 (MR) | 2 (MR) | 3 (ER) | 4 (PR) | 5 (vFR) | 6 (vFR) | |
|---|---|---|---|---|---|---|
| 1 (MR) | 1 | |||||
| 2 (MR) | .38*** | 1 | ||||
| 3 (ER) | .25*** | .27*** | 1 | |||
| 4 (PR) | .33*** | .48*** | .37*** | 1 | ||
| 5 (vFR) | .03 | .09*** | .04 | .11*** | 1 | |
| 6 (vFR) | .13*** | .17*** | .12*** | .24*** | .26*** | 1 |
Note. MR = metaphysical realism; ER = epistemic realism; PR = progressive realism; vFR = van Fraassen realism.
* Significant at the .05 level.
** Significant at the .01 level.
*** Significant at the .001 level.
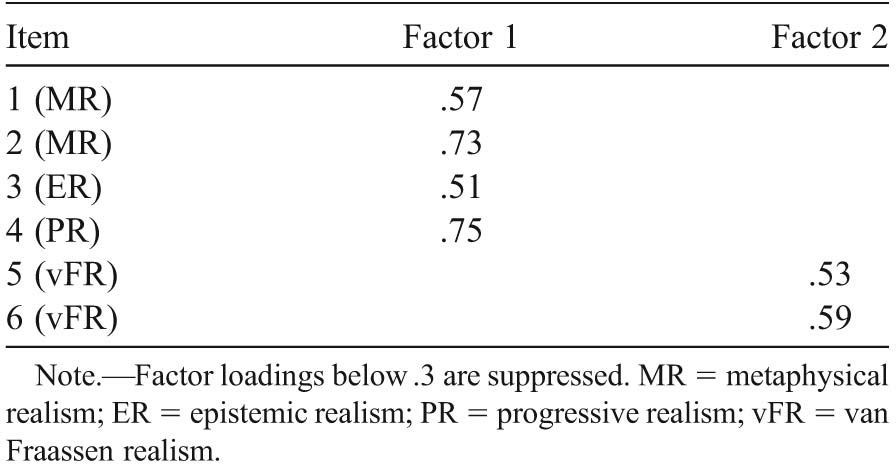
In order to examine broader patterns in our data and the ways in which participants’ responses to the first six items on the SRQ clustered together, we conducted an exploratory factor analysis.Footnote 8 The analysis resulted in the two factors represented in the columns of table 5. The factor loadings represented in table 5 (i.e., the values in the two rightmost columns) correspond (roughly) to the correlations between participants’ responses to each statement and the underlying factor in question. Factor 1 explained 31.7% of the variance in the data, while factor 2 explained 8.3%. The two factors correlated to a moderate degree (
 ). Thus, our factor analysis reveals that the first four statements on the SRQ seem to be getting at the same underlying phenomenon—at least when examined at a certain level of granularity—but that this phenomenon is distinctively different from the one being measured by statements 5 and 6.
Pattern Matrix for an Exploratory Factor Analysis of Data from Statements 1–6 of the Scientific Realism Questionnaire

| Item | Factor 1 | Factor 2 |
|---|---|---|
| 1 (MR) | .57 | |
| 2 (MR) | .73 | |
| 3 (ER) | .51 | |
| 4 (PR) | .75 | |
| 5 (vFR) | .53 | |
| 6 (vFR) | .59 |
Note. Factor loadings below .3 are suppressed. MR = metaphysical realism; ER = epistemic realism; PR = progressive realism; vFR = van Fraassen realism.
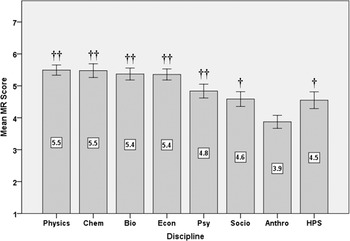
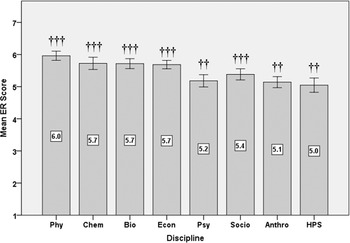
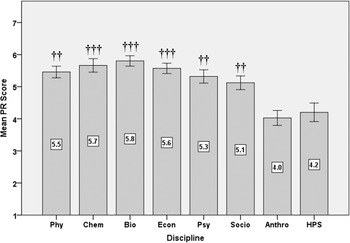
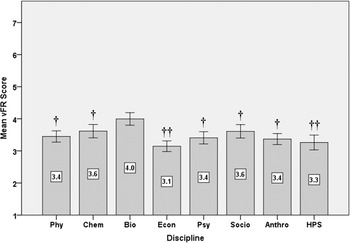
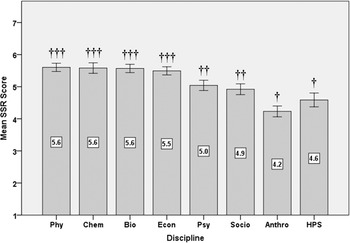
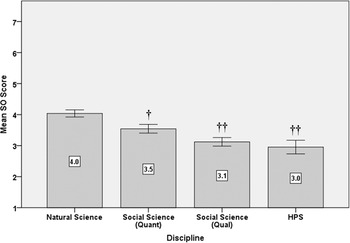
On the basis of the foregoing correlational and factor analyses and the philosophical theorizing on which the SRQ was based, we calculated separate scores for each of the dimensions of scientific realism that we studied for each scientist who participated in our study. MR scores were obtained by averaging participants’ responses to statement 1, “The objects and phenomena studied by science exist independently of how we conceive of or think about them,” and statement 2, “Even if we cannot be certain which scientific theories are ultimately true, we can be certain that there is an ultimate truth out there waiting to be discovered.” Participants’ ER and PR scores were simply their responses to statement 3, “Our most successful and rigorously tested scientific theories are at least approximately true,” and statement 4, “Progress in science is a matter of getting closer and closer to the underlying truth about reality,” respectively. The vFR scores were calculated by averaging responses to statement 5, “In order to go about their daily business as scientists, scientists do not need to believe that any of the theories they rely upon provides them with literally correct descriptions of the world,” and statement 6, “Scientific theories should not be judged on the basis of how accurately they depict an underlying reality but rather on how useful they are in helping us systematize our experiences and develop new technologies.” Because participants’ responses to statements 1–4 clustered together (i.e., loaded onto a single factor), and because these statements represent the core dimensions of scientific realism on a standard way of thinking about the matter, we also calculated a standard scientific realism (SSR) score for each participant by averaging together participants’ responses to these statements. Mean MR, ER, PR, vFR, and SSR scores and 95% confidence intervals for each discipline appear in figures 1–5. A series of Kruskal-Wallis tests revealed significant between-discipline differences on each score.Footnote 9 One-sample Wilcoxon signed rank tests were conducted on each score for each discipline to determine whether the observed distribution differed significantly from a hypothetical distribution centered around the neutral midpoint of 4. In all figures, distributions that differed from the midpoint to a small extent are marked with a dagger (†), distributions that differed to a medium extent are marked with a double dagger, and distributions that differed to a large extent are marked with triple dagger. Distributions whose measure of effect size fell below the conventional threshold for a small effect received no mark.Footnote 10
Mean metaphysical realism scores, sorted by discipline.

Mean epistemic realism scores, sorted by discipline.

Mean progressive realism scores, sorted by discipline.

Mean van Fraassen realism scores, sorted by discipline.

Mean standard scientific realism scores, sorted by discipline.

With the exception of figure 4, we see common patterns in each of these figures. There are higher realism scores among natural scientists than social scientists, the views of HPS scholars strongly diverge from those of natural scientists, and the views of HPS agree most closely with those of anthropologists (and sometimes sociologists). In most figures, means mostly fell significantly above the neutral midpoint. Only in figure 4 did means generally fall below the midpoint.
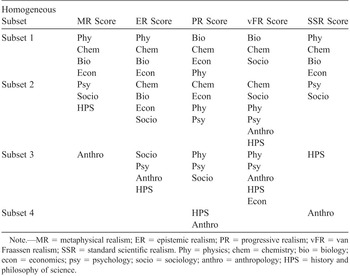
A series of post hoc REGWQ (Ryan-Einot-Gabriel-Welsch Q) range tests were conducted in order to classify the mean responses of the eight disciplines represented in our study into distinct homogeneous subsets. REGWQ tests place mean responses into distinct subsets if they differ significantly from each other (at an α level of .05, controlling for the family-wise error rate) and into the same subset otherwise. The results of these tests are represented in table 6.
Homogeneous Subsets on Each Score, with Disciplines Listed in Descending Order of Mean Score

| Homogeneous Subset | MR Score | ER Score | PR Score | vFR Score | SSR Score |
|---|---|---|---|---|---|
| Subset 1 | Phy | Phy | Bio | Bio | Phy |
| Chem | Chem | Chem | Chem | Chem | |
| Bio | Bio | Econ | Socio | Bio | |
| Econ | Econ | Phy | Econ | ||
| Subset 2 | Psy | Chem | Chem | Chem | Psy |
| Socio | Bio | Econ | Socio | Socio | |
| HPS | Econ | Phy | Phy | ||
| Socio | Psy | Psy | |||
| Anthro | |||||
| HPS | |||||
| Subset 3 | Anthro | Socio | Phy | Phy | HPS |
| Psy | Psy | Psy | |||
| Anthro | Socio | Anthro | |||
| HPS | HPS | ||||
| Econ | |||||
| Subset 4 | HPS | Anthro | |||
| Anthro |
Note. MR = metaphysical realism; ER = epistemic realism; PR = progressive realism; vFR = van Fraassen realism; SSR = standard scientific realism. Phy = physics; chem = chemistry; bio = biology; econ = economics; psy = psychology; socio = sociology; anthro = anthropology; HPS = history and philosophy of science.
In the second column of table 6, we can see that the natural sciences and economics cluster into a subset at the top of the table with the highest MR scores; that psychology, sociology, and HPS cluster into a second subset with the next highest set of scores; and that anthropology appears by itself at the bottom with the lowest SSR score. With the exception of vFR scores, something like this pattern is repeated in each of the other columns.Footnote 11
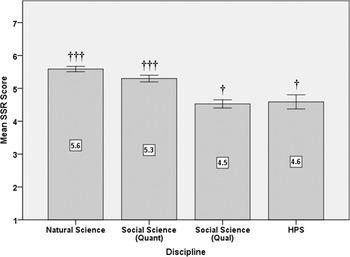
As we noted above, we hypothesized that the realism scores of natural scientists would be higher than those of social scientists and that the realism scores of social scientists working in disciplines that rely primarily on quantitative methods would be higher than those of scientists in disciplines where qualitative methods are common. In order to test this hypothesis more clearly, we sorted scientists’ SSR scores into three groups. Physics, chemistry, and biology were combined into natural science; economics and psychology were combined into social science where quantitative methods predominate; and sociology and anthropology were combined into social science where qualitative methods are common. The means scores of these three groups, together with those of HPS scholars, are represented in figure 6.
Mean standard scientific realism scores, sorted by broad disciplinary category.

A Kruskal-Wallis test revealed a significant between-group difference on this score (
 ,
 ). Post hoc Mann-Whitney tests indicated significant pair-wise differences between each paired participants group (
 ), except for HPS and the qualitative social sciences (
 ).Footnote 12 That is, (i) natural scientists had significantly higher SSR scores than social scientists or HPS scholars, (ii) social scientists in disciplines where quantitative methods predominate had significantly higher SSR scores than HPS scholars and social scientists where qualitative methods are common, and (iii) social scientists in more qualitative disciplines did not differ significantly from HPS scholars.
4. Results: Additional Factors
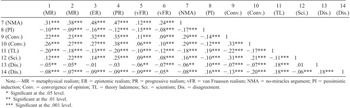
We now turn our attention to analyses of data from the remaining eight statements on the SRQ. A Kendall’s tau correlation matrix for these statements, showing their correlations among themselves and with the first six statements, appears in table 7. Participant responses to statement 7, “The best explanation for the remarkable success of our best scientific theories is that they accurately depict an underlying reality” (which expresses NMA), correlated fairly strongly with responses to statements about each of the standard dimensions of scientific realism (i.e., statements 1–4). Surprisingly, statement 8, “The fact that the history of science contains so many widely accepted theories that turned out to be fundamentally mistaken should make us skeptical about the scientific theories that are currently accepted” (which represents PI), did not strongly correlate with participant responses to any other statement.
Kendall’s Tau Correlation Matrix for the Remaining Data from the Scientific Realism Questionnaire

| 1 | 2 | 3 | 4 | 5 | 6 | 7 | 8 | 9 | 10 | 11 | 12 | 13 | 14 | |
|---|---|---|---|---|---|---|---|---|---|---|---|---|---|---|
| (MR) | (MR) | (ER) | (PR) | (vFR) | (vFR) | (NMA) | (PI) | (Conv.) | (Conv.) | (TL) | (Sci.) | (Dis.) | (Dis.) | |
| 7 (NMA) | .31*** | .38*** | .48*** | .47*** | .12*** | .24*** | 1 | |||||||
| 8 (PI) | −.10*** | −.09*** | −.16*** | −.12*** | −.15*** | −.08*** | −.17*** | 1 | ||||||
| 9 (Conv.) | .22*** | .23*** | .32*** | .35*** | .11*** | .09*** | .29*** | −.14*** | 1 | |||||
| 10 (Conv.) | .26*** | .27*** | .27*** | .38*** | .06*** | .10*** | .29*** | −.12*** | .33*** | 1 | ||||
| 11 (TL) | −.20*** | −.18*** | −.13*** | −.20*** | −.10*** | −.12*** | −.18*** | .19*** | −.22*** | −.17*** | 1 | |||
| 12 (Sci.) | .12*** | .22*** | .14*** | .25*** | .09*** | .08*** | .16*** | −.10*** | .31*** | .21*** | −.11*** | 1 | ||
| 13 (Dis.) | −.05** | −.05* | −.01 | −.03 | −.06** | −.07*** | −.06** | .10*** | −.07*** | −.07*** | .18*** | .01 | 1 | |
| 14 (Dis.) | −.08*** | −.07*** | −.09*** | −.09*** | −.09*** | −.05* | −.08*** | .16*** | −.13*** | −.20*** | .18*** | −.06*** | .18*** | 1 |
Note. MR = metaphysical realism; ER = epistemic realism; PR = progressive realism; vFR = van Fraassen realism; NMA = no-miracles argument; PI = pessimistic induction; Conv. = convergence of opinion; TL = theory ladenness; Sci. = scientism; Dis. = disagreement.
* Significant at the .05 level.
** Significant at the .01 level.
*** Significant at the .001 level.
Responses to statement 9, “Disagreements in science can always be resolved by obtaining better data,” and statement 10, “Over time, scientists from competing schools of thought will eventually converge to a single perspective,” correlated moderately well with each other, with responses to the four statements about the standard dimensions of scientific realism, and with NMA (i.e., 7).
As expected, responses to statement 11, “There is no such thing as purely impartial scientific observation; all observations in science are shaped and informed by one’s prior theoretical commitments,” negatively correlated with responses to statements that expressed realist sentiments. They also positively correlated with statement 13, “Having different schools of thought within a scientific discipline is good for the health of that discipline,” and statement 14, “There is a significant amount of persistent disagreement in my field [in science]”—although none of these correlations were as large as expected. Also as expected, responses to statement 12, “Given enough time and resources, there is nothing science cannot explain,” correlated most strongly with responses to statements of PR and the replacement of disagreement with convergence of opinion in light of new evidence. Statements 13 and 14 negatively correlated with expressions of scientific realism, but only to a small or negligible degree.
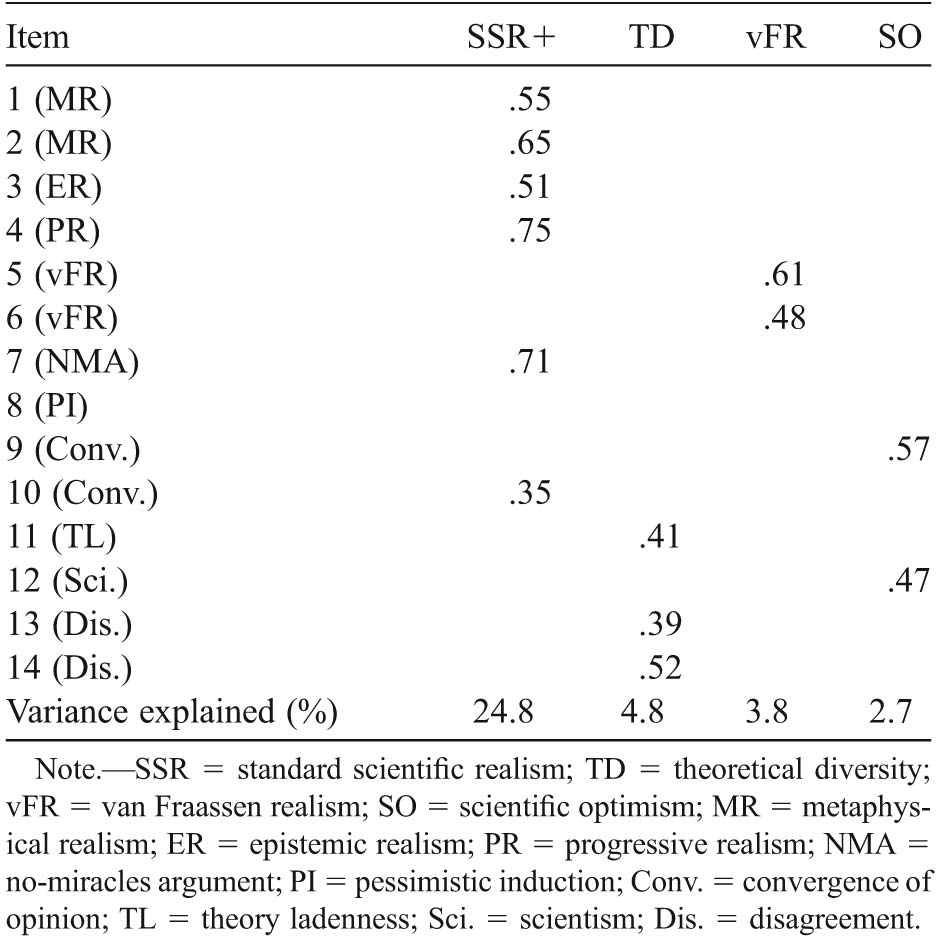
In order to examine how the 14 statements on the SRQ clustered together, we performed a second exploratory factor analysis, this time using all of the data from the SRQ.Footnote 13 The analysis resulted in the four factors represented in table 8.
Pattern Matrix for an Exploratory Factor Analysis of Data from Statements 1–14 of the Scientific Realism Questionnaire

| Item | SSR+ | TD | vFR | SO |
|---|---|---|---|---|
| 1 (MR) | .55 | |||
| 2 (MR) | .65 | |||
| 3 (ER) | .51 | |||
| 4 (PR) | .75 | |||
| 5 (vFR) | .61 | |||
| 6 (vFR) | .48 | |||
| 7 (NMA) | .71 | |||
| 8 (PI) | ||||
| 9 (Conv.) | .57 | |||
| 10 (Conv.) | .35 | |||
| 11 (TL) | .41 | |||
| 12 (Sci.) | .47 | |||
| 13 (Dis.) | .39 | |||
| 14 (Dis.) | .52 | |||
| Variance explained (%) | 24.8 | 4.8 | 3.8 | 2.7 |
Note. SSR = standard scientific realism; TD = theoretical diversity; vFR = van Fraassen realism; SO = scientific optimism; MR = metaphysical realism; ER = epistemic realism; PR = progressive realism; NMA = no-miracles argument; PI = pessimistic induction; Conv. = convergence of opinion; TL = theory ladenness; Sci. = scientism; Dis. = disagreement.
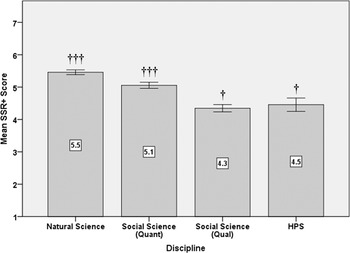
Participants’ responses to the four standard dimensions of scientific realism (statements 1–4) clustered together with their responses to a statement of NMA (7) and (albeit to a lesser extent) to a statement that competing schools of thought should eventually converge to a single perspective (10). Since this factor includes the previous SSR statements, we refer to it as ‘SSR+’. Scientists’ mean SSR+ scores are represented in figure 7 and displayed according to the same broad disciplinary categorization used in figure 6. A Kruskal-Wallis test revealed significant between-group differences on this score (
 ,
 ). Post hoc Mann-Whitney tests indicated significant pair-wise differences between each paired participants group (
 ), except for HPS and the qualitative social sciences (
 ).
Mean standard scientific realism+ scores, sorted by broad disciplinary category.

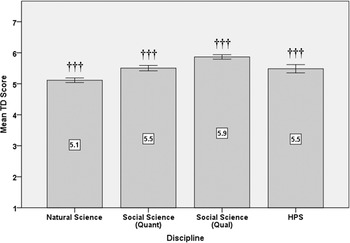
Statements 11, 13, and 14 formed a second cluster characterized by an embrace of theoretical diversity (TD) and the pervasiveness and penetrability of such diversity. The mean TD scores of scientists in our study are represented in figure 8. A Kruskal-Wallis test revealed a significant between-group difference on this score (
 ,
 ). Post hoc Mann-Whitney tests indicated significant pair-wise differences between each paired participants group (
 ), except for HPS and the quantitative social sciences (
 ).
Mean theoretical diversity scores, sorted by broad disciplinary category.

Our statement of PI (8) failed to load to an appreciable extent onto any of the four resulting factors—that is, responses to this statement failed to cluster with responses to any other statement to an appreciable extent. Since factor loadings below .3 were suppressed, the row for this statement in table 8 is blank. The statements that concerned vFR (5 and 6) again failed to cluster with any other statements in the analysis.
Statements 9 and 12 clustered together around a factor that seems to involve a kind of optimism about science’s eventual ability to explain the world and resolve disagreements. Disciplinary differences on scientific optimism (SO) are represented in figure 9. A Kruskal-Wallis test revealed significant between-group differences on this score (
 ,
 ). Post hoc Mann-Whitney tests indicated significant pair-wise differences between each paired participants group (
 ), except for HPS and the qualitative social sciences (
 ).
Mean scientific optimism scores, sorted by broad disciplinary category.

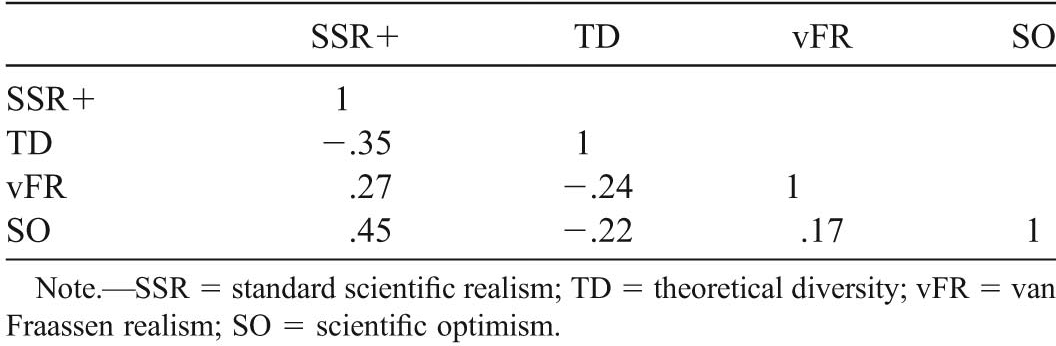
Correlations between the four factors described above are depicted in table 9. As might be expected, higher SO scores predicted higher SSR+ scores. Higher TD scores predicted lower SSR+ scores, lower vFR scores, and lower SO scores.
Factor Correlation Matrix

| SSR+ | TD | vFR | SO | |
|---|---|---|---|---|
| SSR+ | 1 | |||
| TD | −.35 | 1 | ||
| vFR | .27 | −.24 | 1 | |
| SO | .45 | −.22 | .17 | 1 |
Note. SSR = standard scientific realism; TD = theoretical diversity; vFR = van Fraassen realism; SO = scientific optimism.
5. Discussion
We turn now to a discussion of the significance of these results for debates about scientific realism and our understanding of science more broadly. One of the most significant of our findings concerns differences in philosophical opinions between HPS scholars and scientists in the quantitative sciences studied here, which include natural scientists (physicists, chemists, and biologists) and some social scientists (economists and psychologists). In particular, HPS scholars differed significantly from natural scientists on our measures of MR, ER, and PR and in our overall measures of standard scientific realism (SSR and SSR+). Furthermore, HPS scholars differed significantly from quantitative scientists with regard to SO. By contrast, HPS scholars were significantly in step with the generally more antirealist qualitative scientists in our study (sociologists and anthropologists) with regard to all of these measures.
Since the quantitative sciences are the sciences that HPS scholars have studied most extensively—especially in debates about scientific realism—this almost certainly reflects a real difference in opinion between HPS scholars and their subject matter (i.e., scientists themselves). What could explain such a discrepancy? An HPS-friendly explanation is that HPS scholars have, whereas quantitative scientists have not, learned about the significant historical and philosophical challenges facing the various types of scientific realism involved in our study. Relatedly, it could be suggested that quantitative scientists have been indoctrinated by an overly realist and optimistic view of science, whereas HPS scholars have not been subject to such propaganda. In favor of this explanation, one could appeal to Kuhn’s (Reference Kuhn1970, 136–43) observation that textbooks in natural science tend to present a selective and distorted view of the history of science as a series of great achievements accumulated over time. Since such textbooks are arguably more central to the training of quantitative scientists than qualitative scientists, this might also explain why the qualitative scientists in our study (sociologists and anthropologists) align themselves more closely with HPS scholars than our quantitative scientists.Footnote 14
A more HPS-critical type of explanation of our results lays the blame on the picture painted of science within HPS. On this explanation, it would be claimed that HPS scholars often present an impoverished or simplistic view of science in which skeptical and antirealist arguments will seem stronger than they are. We note three ways in which this challenge could be substantiated. First, it could be argued that HPS scholars are trained and encouraged to emphasize the role of historically contingent factors in the development of science, such as the influence of social and political values. Conversely, HPS scholars will tend to reject as uninteresting or ‘whiggish’ research into scientific developments in which scientists simply adopted theories on the basis of strong empirical evidence. As a consequence, it would be argued, HPS scholars are presented with a picture of science that is skewed toward antirealism.Footnote 15 Second, much historical work that is meant to challenge scientific realism (ER in particular) proceeds from studying one or a few instances of scientific theories that were, in retrospect, false or insufficiently supported by the available evidence. However, quantitative scientists may be skeptical of placing much stock on what is essentially anecdotal evidence and may furthermore have reasons to think that the cases in question are not representative of the currently accepted theories in their fields. Third, working scientists may well have access to a variety of unstated or ‘tacit’ evidence that is not—and perhaps could not be—reported in scientific articles and documents but that nevertheless justifiably increases their levels of confidence in currently accepted theories.Footnote 16 Scientific conclusions that may appear from the outside to be blind leaps of faith, or overconfidence in a particular theory, may in fact be grounded in a tacit but nevertheless justified understanding of the scientific subject matter in question.
Another significant finding concerns the differences in realist tendencies between scientific disciplines. In a recent study, Robinson, Gonnerman, and O’Rourke (Reference Robinson, Gonnerman and O’Rourke2019) investigated differences in the philosophical opinions of 264 scientists classified into three different branches of science, ‘life sciences’, ‘physical sciences and mathematics’ and ‘social and behavioral sciences’. For our purposes, their most relevant results concern two philosophical statements that Robinson et al. characterize as concerning ‘reality’, that is, “Scientific claims need not represent objective reality to be useful” (reality 2) and “The subject of my research is a human construct” (reality 4). Robinson et al. found statistically significant differences between scientists in life sciences and social and behavioral sciences on reality 2. They also found statistically significant differences on reality 4 between life science and physical sciences and mathematics, on the one hand, and social and behavioral sciences, on the other hand.
In comparison to Robinson et al. (Reference Robinson, Gonnerman and O’Rourke2019), our study is much larger and more powerful (1,798 participants as compared with 264), employed a more fine-grained categorization of scientific fields (seven ‘disciplines’ rather than three ‘branches’), and probed more specific and precisely stated opinions regarding scientific realism.Footnote 17 However, our study partially confirmed Robinson et al.’s results insofar as “The subject of my research is a human construct” (reality 4) corresponds to (the denial of) our statement 1: “The objects and phenomena studied by science exist independently of how we conceive of or think about them.” In our study, psychologists, sociologists and anthropologists scored significantly lower than biologists (who most clearly represent the life sciences in our study; all
 ). Indeed, the former fields also scored much lower than chemists and physicists (
 ), which would presumably be classified as ‘physical sciences’ by Robinson et al. Interestingly, however, Robinson et al. did not observe a statistically significant difference between their ‘physical sciences and mathematics’ and ‘social and behavioral sciences’ on reality 4. From the point of view of our study, this is an anomaly that may be explained by the inclusion of mathematics in the former branch. After all, it is plausible that a nontrivial number of mathematicians see the subject of their research—mathematical objects—as a ‘human construct’ (in line with intuitionism about mathematics; see Iemhoff Reference Iemhoff and Zalta2013).Footnote 18
More significantly, our study dramatically extends Robinson et al.’s results about differences between scientific fields to a number of issues regarding scientific realism. In the broadest terms, our results show that quantitative sciences such as physics and economics appear to be much more inclined toward standard forms of scientific realism than qualitative sciences such as sociology and anthropology. These differences were especially pronounced with regard to metaphysical statements about objective truth and mind-independent reality (MR) and whether scientific progress involves more accurate representation of underlying reality (PR). This may in part be explained by the fact that the subject matter of sociology and anthropology are arguably more subjective and malleable by human intervention than the subject matter of the natural sciences. However, this conjecture seems inadequate to explain why economics aligns itself so closely with the natural sciences, given that the subject matter of economics is similar in the aforementioned respects. A better explanation may thus appeal to the fact that economics tends to employ a similar methodology as the natural sciences in our study, with a heavy emphasis on quantitative methods. For example, it may be that dedicating oneself to quantitative methods instills a realist mind-set about one’s theories and their relation to evidence. Alternatively, those who come to appreciate using quantitative methods may be somehow predisposed toward realism. Again, these issues would need to be investigated further.
So far in this section we have focused on what we label SSR (statements 1–4), which cluster with statements of NMA and scientific convergence to a single perspective (statements 7 and 10). As we have noted, responses to these statements did not cluster with vFR, defined as a two-tiered thesis about the belief involved in acceptance of a theory and the basic criterion for success in science. This suggests that not only does van Fraassen’s approach differ from the ways other philosophers of science have defined scientific realism but also that vFR may not connect in substantial ways with the broad set of issues involved in other discussions of scientific realism. On the one hand, this is not surprising given that van Fraassen’s intention was to restructure the scientific realism debate in light of what he saw as an inadequate conception of the underlying issue. On the other hand, it may be worrying for van Fraassen that our participants apparently did not see him as addressing the same philosophical issue as other contributors to the scientific realism debate. Presumably, the goal of van Fraassen’s restructuring of the debate was to capture a logically distinct but closely associated set of issues; if so, our data suggest that this restructuring was not entirely successful.
With that said, another interesting result of our study is that the two statements of different aspects of vFR did cluster together. This suggests that van Fraassen’s two claims about the belief involved in acceptance and science’s criterion of success do indeed ‘come as a package’ in the minds of scientists, as opposed to being two entirely separate issues that can be treated independently of each other. Discussing these claims independently of each other, as philosophers of science often do in their treatment of van Fraassen’s constructive empiricism (e.g., Dicken Reference Dicken2010), might thus be somewhat misleading.
Yet another interesting result is how popular van Fraassen’s type of scientific antirealism appears to be in all of the scientific disciplines in our study, both absolutely and relative to other forms of scientific realism (MR, ER, and PR). In analytic philosophy of science, where nearly all the debate about van Fraassen’s conception of realism and antirealism has taken place, very few have aligned themselves with van Fraassen’s constructive empiricism or any other position that counts as antirealist on van Fraassen’s definition.Footnote 19 However, our results suggest that this is by far the most popular version of antirealism among scientists, and this holds for each of the scientific disciplines studied here (compare fig. 4 to figs. 1, 2, 3, and 5). It is noteworthy in this regard that many well-known scientists have publicly expressed positions that are very similar to van Fraassen’s antirealism (e.g., Hawking and Mlodinow’s [Reference Hawking and Mlodinow2010] ‘model-dependent realism’). Such anecdotal evidence for the popularity of a van Fraassen–style antirealism about science can now be backed up with more systematic support.
The relative popularity of van Fraassen–style antirealism among scientists is also significant in light of the exchange between van Fraassen (1994) and Rosen (Reference Rosen1994) about the nature of constructive empiricism. In brief, their exchange concerned the relationship between the scientific realism debate, as construed by van Fraassen, and the intentions of individual scientists. Rosen claimed that the debate could not simply be about scientists’ own understanding of the aim of science, since that should be settled by a sociological investigation in which scientists are simply asked for their personal opinions on the matter. In van Fraassen’s response, he acknowledged that scientific realism and constructive empiricism are not straightforward empirical claims that could be directly tested by a sociological investigation of this sort, due primarily to the fact that who counts as scientists in the first place will be determined in part by one’s view of what it is to do science, which is in turn determined by science’s criterion of success. Any sociological investigation into the extent to which scientists are realists or antirealists would thus be complicated by a “hermeneutic circle” in which the extension of ‘science’ is partly determined by the aim of science and vice versa (van Fraassen 1994, 188–92).
It is not clear to us exactly where van Fraassen lands on the issue of whether vFR could be investigated empirically by surveying scientists.Footnote 20 However, our own view is that the opinions held by scientists themselves are at least highly relevant to evaluating vFR (and van Fraassen’s antirealist alternative, constructive empiricism), since it surely counts against a philosophical account if it must attribute to scientists substantial and widespread misconceptions about science’s own criterion of success and what is in fact involved in accepting a scientific theory.Footnote 21 Our impression is that many philosophers of science have assumed that this type of empirical study would count in favor of vFR and against constructive empiricism (see, e.g., Rosen Reference Rosen1994, 145–46). Our study suggests that the opposite is true. Indeed, every single discipline’s mean vFR score fell on or below the midpoint. This indicates that most scientists are antirealists of some kind on van Fraassen’s conception of the debate.
There are many other interesting correlations in our data, but we restrict ourselves to highlighting two further results. First, it is noteworthy how closely agreement with PR—the idea that progress is a matter of getting closer to the underlying truth—correlates with other forms of realism, MR and ER, and the associated NMA. Second, we were surprised to find no strong correlation in our data between standard forms of scientific realism, SSR, and what is usually taken as the main argument against scientific realism (i.e., PI; statement 8). It is worth noting that the same is not true for the most popular type of argument in favor of scientific realism (i.e., NMA; statement 7), which correlates very strongly with ER and PR (see table 7) and clusters with SSR (see table 8). This suggests that, in contrast to most philosophers of science, scientists who endorse PI do not view it as posing a serious challenge to ER and PR. Perhaps, then, the realist response to PI that is most likely to be found convincing among working scientists will not consist in rebutting this antirealist argument but rather in articulating a form of scientific realism that is unambiguously compatible with the PI.Footnote 22 We hope that the findings we report here regarding the judgments of scientists and HPS scholars about different dimensions of scientific realism will lead to fruitful discussions about the nature of scientific realism and the relationship between scientific practices and philosophical theorizing about those practices.