Implications
In order to meet the demands of consumers and slaughterhouses, breeders have selected chickens for low-carcass fatness. The relevant trait used for such selection was the proportion of abdominal fat (AF). Fat is currently considered to be a by-product of very little commercial value. Moreover, in terms of sustainability, fatty animals are less efficient in the conversion of feed during the rearing period. Comparing two divergent chicken lines selected for low or high AF has increased our understanding of energy metabolism in meat-type chickens. Therefore, the fat line and lean line chickens could be used as a biomedical model to study the mechanisms of human metabolic disorders such as obesity.
Introduction
During the period 1970 to 1975, slaughterhouses developed the presentation of poultry products as cut parts. Therefore, they paid greater attention to the bone, muscle and adipose tissue yields in poultry strains. Modern strains of chickens that had been strongly selected for rapid growth rate also exhibit excessive body fat deposition, and fat is considered to be a by-product of very little commercial value. Moreover, it is a costly body component from an energy point of view and its deposition in large amounts can considerably decrease feed efficiency. The body fat of chicken can be influenced by the composition of the diet, particularly the energy/protein ratio and bird sex (females having higher carcass fatness than males). However, the genetic approach seemed to be the most efficient way to modify carcass fatness in chicken as this trait displayed high heritability (Ricard and Rouvier, Reference Ricard and Rouvier1969). Therefore, many experimental direct or indirect selection programmes against carcass fatness were undertaken. Direct selection against abdominal fat (AF) using sib-test procedures was undertaken in France by Leclercq et al. (Reference Leclercq, Blum and Boyer1980), Israël by Cahaner and Nitsan (Reference Cahaner and Nitsan1985) and the Netherlands by Leenstra and Pit (Reference Leenstra and Pit1987). One study using hand palpation of AF pad thickness was conducted on mature females by Lilburn et al. (Reference Lilburn, Leach, Buss and Martin1982). One of the main problems associated with selection against AF arises from the need to slaughter birds to measure AF directly and precisely and to use collateral birds for breeding purposes. Indirect selection against carcass fatness was also tested on the basis of feed conversion ratio (FCR; Pym and Solvyns, Reference Pym and Solvyns1979 and Leenstra and Pit, Reference Leenstra and Pit1987), plasma concentration of very low-density lipoproteins (Whitehead and Griffin, Reference Whitehead and Griffin1984) or glucose (Leclercq et al., Reference Leclercq, Simon and Ricard1987). Among these different selection programmes, the one undertaken by Leclercq (Reference Leclercq1988) led to studies on the effects of such selection on growth and reproduction performance, carcass composition, meat quality and metabolism of energy and proteins. By combining diet characteristics (fat, amino acid (AA) and/or protein levels), nutritional status (feeding, fasting and refeeding) and lines selected for high or low AF, our understanding of hormonal and genetic regulation of fat metabolism in birds was substantially improved. This review aims to gather the effects of such selection on growth, body composition and metabolism in the chicken. The reported studies have been realized during the selection programme, regarding the first seven generations and also with the further generations.
Selection programme for high or low AF content in meat-type chickens
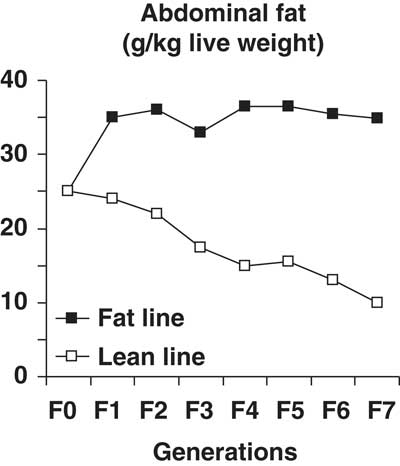
The foundation stock was described by Leclercq (Reference Leclercq1988). Generation F1 comprised 23 sires and 68 dams distributed into 23 pedigree pens. Birds were taken from six different origins in order to gather as many genes as possible. These breeders provided the F0 generation. Four males per dam of this generation were slaughtered at 63 days of age and their AF pads were excised and weighed. Mean BWs and proportions of AF were calculated for each of the 68 families. They were classified as fat (FL) families or lean (LL) families according to the deviation from the linear regression between the proportion of AF and live weight (LW). Fourteen sires per line were kept at F0 and F1 and 15 sires per line thereafter. Five dams were placed in each pedigree pen. The two lines are currently maintained with 20 sires at each generation per line, and the selection programme has been conducted over seven successive generations, the mean interval between generations being 9 months. There has been no difference between lines for LW, as only the proportion of AF has been selected. Divergence according to proportion of AF appeared very early in the selection programme (Figure 1). It seemed very difficult to exceed a plateau of 40 g AF/kg LW in male chickens at 63 days of age. As divergence increased, variability in the proportion of AF became very different between lines. At the F7 generation, the standard deviation of the FL was twice that of the LL.
Abdominal fat in relation to live weight of male chickens in successive generations (Leclercq, Reference Leclercq1988).

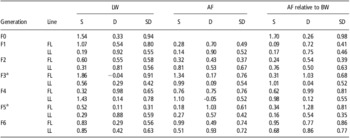
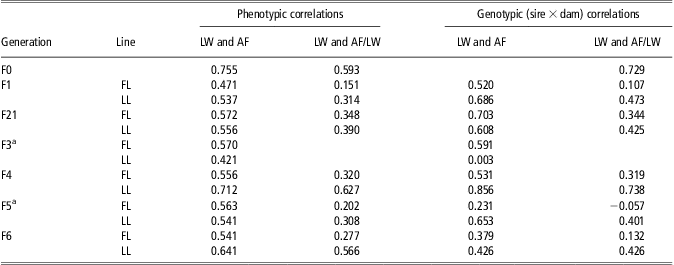
Heritabilities were calculated at each generation for LW, AF and combinations of both parameters. Values of heritability of these parameters for the first six generations are provided in Table 1. These findings confirmed the high heritability of the proportion of AF observed in meat-type chickens. Phenotypic and genetic correlations between LW and AF or proportion of AF for the first six generations are presented in Table 2. The coefficient of correlation between LW and AF was highest in the F0; however, it remained high (>0.5) in later generations. Similarly, the correlation between LW and proportion of AF was highest in the F0. However, in the following generations, it remained low (about 0.3). Thus, the first step of the selection programme, taking into account the deviation from the regression between proportion of AF and LW, resulted in a substantial decrease in the positive correlation, which naturally occurs between growth rate and fattening. Both parameters could then be considered as almost independent. The selection programme was based on fatness of males because more females are required for breeding, and females are always fatter than males (Leclercq, Reference Leclercq1988). Therefore, the selection programme resulted in a divergence between the lines that was significant but less pronounced in females than in males. Except for generation F0 (r = 0.71, P < 0.001), the correlations between fatness values for males and females were not significant (r = −0.41 to 0.33 depending on generation), suggesting that fattening of males and females is not entirely controlled by the same genes. The selection programme was stopped after selection of F6 breeders to provide the F7 generation. A representative sample of FL and LL birds was kept as breeders for subsequent generations. For all subsequent generations, any modification of growth performance and body composition of each line were avoided. Therefore, the difference in AF between lines remained constant (about 29 g/kg LW). A recent study reported 4.7% and 2.1% AF in FL and LL lines, respectively (Jlali et al., Reference Jlali, Gigaud, Metayer-Coustard, Sellier, Tesseraud, Le Bihan-Duval and Berri2012).
Calculated heritabilities of LW, AF and combinations of both parameters for the first six generations in the chicken lines selected for high (FL) or low (LL) AF pad (Leclercq, Reference Leclercq1988)
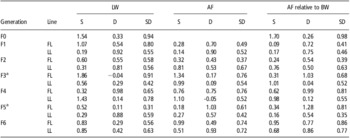
LW = live weight; AF = abdominal fat; S = sire component; D = dam component; SD = sire + dam component.
aMeasurements made at 5 weeks of age.
Phenotypic and genotypic correlations between LW and AF in two chicken lines selected for high (FL) or low (LL) abdominal fat pad (Leclercq, Reference Leclercq1988)

LW = live weight; AF = abdominal fat.
aMeasurements made at 5 weeks of age.
Growth and body composition
Growth performance
Growing birds of both lines had similar BWs at 63 days of age (about 2060 g, average weight calculated for the first seven generations, Leclercq, Reference Leclercq1988). However, FL chickens had a higher growth rate during the first few weeks post hatching, whereas adult LL chickens exhibited a higher BW than FL chickens (Leclercq, Reference Leclercq1988). FL chickens had a higher FCR than LL chickens (Leclercq, Reference Leclercq1988). Food intake, metabolizable energy content of the diet and maintenance requirements were not different between the lines (Géraert et al., Reference Géraert, Mac Leod and Leclercq1988).
Hens from both lines exhibited the same energy requirements for maintenance and production. Therefore, the higher feed consumption of LL hens was because of their higher BW (Leclercq, Reference Leclercq1988).
Carcass composition
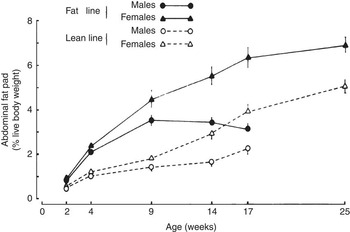
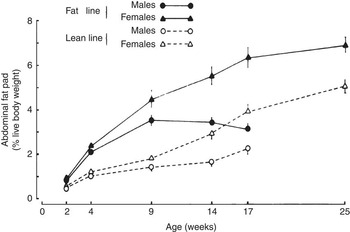
At 63 days of age, AF was twice as high in FL chickens than in LL chickens (Leclercq, Reference Leclercq1988). The amount of fat deposited between the thigh muscles was also twofold greater in FL chickens than in LL chickens (Ricard et al., Reference Ricard, Leclercq and Marché1982). Finally, selection on high AF resulted in an increase in the total lipid content of the carcass (1.4-fold at 9 weeks of age (Simon and Leclercq, Reference Simon and Leclercq1982). A longitudinal study showed that the difference in AF between lines was significant from 4 weeks of age and was maximal at 9 weeks of age. It then remained constant for the females and slightly decreased for the males (Figure 2).
Longitudinal study of abdominal fat pad in fat (FL) and lean (LL) chickens of both sexes (F4 generation). Means ± s.e.m., n = 8 to 18. Means of FL and LL chickens were significantly different within each sex and at each age (P > 0.05; Simon and Leclercq, Reference Simon and Leclercq1982a).
There is an interaction between diet composition and genetic background for AF deposition. Swennen et al. (Reference Swennen, Janssens, Collin, Le Bihan-Duval, Verbeke, Decuypere and Buyse2006) reported that chickens fed a low-protein/high-fat diet exhibited higher AF deposition than chickens fed a high-protein/low-fat diet. This diet-induced difference was more pronounced for the FL chickens.
The diameters and numbers of adipocytes removed from AF were also higher in FL chickens than in LL chickens (Simon and Leclercq, Reference Simon and Leclercq1982; Hermier et al., Reference Hermier, Quignard-Boulange, Dugail, Guy, Salichon, Brigant, Ardouin and Leclercq1989). The activity of lipoprotein lipase (LPL) per cell in AF did not differ with genotype, regardless of the nutritional state. However, FL chickens exhibited the highest LPL activity per whole fat pad, enhancing the circulating fatty acid uptake (Hermier et al., Reference Hermier, Quignard-Boulange, Dugail, Guy, Salichon, Brigant, Ardouin and Leclercq1989). Females exhibited higher carcass fatness than males in both lines (Simon and Leclercq, Reference Simon and Leclercq1982).
For the same amount of feed and metabolizable energy ingested, the distribution of energy between fat and protein differed between lines. There was greater protein deposition in LL chickens and conversely decreased fat retention than in FL chickens, irrespective of age (5 and 7 weeks) or ambient temperature (10°C and 25°C; Géraert et al., Reference Géraert, Mac Leod and Leclercq1988). This was consistent with the higher meat yield relative to carcass weight reported in LL chickens by Ricard and Touraille (Reference Ricard and Touraille1988) and more recently by Berri et al. (Reference Berri, Le Bihan-Duval, Baéza, Chartrin, Millet and Bordeau2005).
Muscle characteristics and meat quality
Glycogen content was higher and ultimate pH was lower in the breast muscle of FL chickens than in LL chickens (Berri et al., Reference Berri, Le Bihan-Duval, Baéza, Chartrin, Millet and Bordeau2005). Therefore, FL chickens produced paler and less yellow breast meat with higher drip loss than LL chickens. However, despite their differences in ultimate pH, cooking loss and shear force values were similar in FL and LL chickens. Moreover, the glycogen content of breast muscle in LL chickens was inversely related to abdominal fatness. The activation level of adenosine monophosphate-activated protein kinase (AMPK) was investigated in relation to these variations (Sibut et al., Reference Sibut, Le Bihan-Duval, Tesseraud, Godet, Bordeau, Cailleau-Audouin, Chartrin, Duclos and Berri2008). The main difference observed between lines was a threefold greater level of AMPK activation, evaluated by phosphorylation of AMPKα-(Thr172) in the muscle of LL birds. Dietary protein level affected muscle glycogen storage and the related meat quality parameters in LL chickens, whereas it had no effect on muscle characteristics of FL chickens (Jlali et al., Reference Jlali, Gigaud, Metayer-Coustard, Sellier, Tesseraud, Le Bihan-Duval and Berri2012). Giving LL chickens a low-protein diet (17%) led to lower levels of breast muscle glycogen and, as a consequence, higher ultimate pH, lower lightness and drip loss during cold storage than chickens fed a high-protein diet (23%). This effect of dietary protein level on muscle glycogen level could be mediated by AMPK phosphorylation levels.
Selection for low or high AF did not affect the lipid content of thigh and breast muscles (Ricard et al., Reference Ricard, Leclercq and Touraille1983; Berri et al., Reference Berri, Le Bihan-Duval, Baéza, Chartrin, Millet and Bordeau2005). Regarding the composition of intramuscular lipids of thigh muscles (triglycerides, phospholipids, free cholesterol and free fatty acids), Ricard and Leclercq (Reference Ricard and Leclercq1984) found no significant difference between FL and LL chickens.
Breast and thigh meat of roasted carcasses of LL chickens were judged to be more tender than that of roasted carcasses of FL chickens, whereas the thigh meat of FL chickens had more flavour than that of LL chickens. No differences between lines were observed for meat juiciness or flavour of breast meat (Ricard and Touraille, Reference Ricard and Touraille1988).
Reproductive performance
Laying performance was recorded for each generation when breeders were in pedigree pens. Two full comparisons were undertaken by placing birds of F4 and F7 generations in large individual cages (Leclercq and Simon, Reference Leclercq and Simon1982; Leclercq et al., Reference Leclercq, Kouassi-Kouakou and Simon1985). No difference was observed in egg numbers. Mean egg weight of FL breeders was always lower than that of LL breeders, but this difference could be accounted for by the difference in live BW. The proportion of yolk was always higher in FL eggs than in LL eggs (33% v. 29% at F4 generation, Simon and Leclercq, Reference Simon and Leclercq1982). No difference between lines was observed for age at sexual maturity (185 days), fertility or hatchability of eggs. Mean duration of incubation was found to be slightly but significantly longer for FL than for LL eggs (1 to 2 h more; Bernarczyk et al., Reference Bernarczyk, Simon, Ferre and Leclercq1984). No significant difference between lines in laying percentage at peak egg production (about 70%), egg fertility (about 75.4%) or egg hatchability (about 88.8%) was found over the last generations.
Energy metabolism
Glucose–insulin balance
At the third generation, whether in fasted or fed state, 2-week-old FL chickens exhibited lower plasma glucose levels and higher plasma insulin levels than LL chickens (Leclercq, Reference Leclercq1988). For generation F4, both in the fed and fasted state, the plasma glucose level was lower in FL than in LL chickens (Simon and Leclercq, Reference Simon and Leclercq1982; Leclercq et al., Reference Leclercq, Hermier and Salichon1984). From 5 to 8 weeks of age, plasma glucose increased to similar levels in both lines after ad libitum refeeding or forced feeding, following a 16-h fasting period; however, in contrast, plasma insulin level was considerably enhanced in FL chickens (Simon and Leclercq, Reference Simon and Leclercq1982). At 17 weeks of age, glucose clearance was faster in FL chickens. After ad libitum refeeding following a fasting period, Simon and Leclercq (Reference Simon and Leclercq1985) also showed that hepatic glycogen reserves were more rapidly restored in FL chickens than in LL chickens. The physiological status of FL chickens therefore appears to be very similar to the short-lived pre-obese state observed in mammals and characterized by hyperinsulinaemia. However, no resistance to insulin was observed in FL chickens (Simon and Leclercq, Reference Simon and Leclercq1985). The difference in plasma insulin concentration between lines did not seem to be dependent on the β-adrenergic system (Simon and Leclercq, Reference Simon and Leclercq1985). Perfused pancreases of FL chickens exhibited a defect in the first phase of insulin secretion in response to glucose or glucose plus arginine compared with LL chickens (Rideau et al., Reference Rideau, Simon and Leclercq1986).
No differences between lines were found in adipocyte sensitivity to glucagon or plasma levels of free fatty acid and glucagon, which indicates that there is no intrinsic defect in the ability of fat chickens to mobilize fat stores (Leclercq et al., Reference Leclercq, Chevalier, Derouet and Simon1988b). Moreover, Swennen et al. (Reference Swennen, Janssens, Collin, Le Bihan-Duval, Verbeke, Decuypere and Buyse2006) found no difference in glucose oxidation rate between lines.
Plasma glucose was measured in adult males and females of several generations. In the fasted state, plasma glucose levels of FL breeders were always lower than those of LL breeders. In the fed state, except for generation F10, the differences between lines were not significant (Leclercq, Reference Leclercq1988). Moreover, the albumin glucose content of eggs was lower for FL hens than for LL hens from F3 and F4 generations (Simon and Leclercq, Reference Simon and Leclercq1982).
Plasma lipids
Regardless of the nutritional status (fed or fasted), the total plasma lipid and lipoprotein levels were higher in FL birds than in LL birds, suggesting a higher rate of hepatic lipogenesis in FL chickens (Hermier et al., Reference Hermier, Chapman and Leclercq1984). Leclercq et al. (Reference Leclercq, Hermier and Guy1990) also reported higher hepatic very-low density lipoprotein (VLDL) secretion and VLDL removal from plasma in FL chickens than in LL chickens. However, lipoprotein profiles were similar in fasted and refed animals of both lines. Leclercq et al. (Reference Leclercq, Hermier and Salichon1984) reported higher triglyceride plasma levels in FL than in LL chickens, particularly in the fed state. The difference was more pronounced in birds fed a low-fat diet and became still more marked with age. No difference between lines was found for plasma cholesterol or non-esterified fatty acid concentrations.
Plasma triglyceride and phospholipid concentrations were measured in adult males and females of several generations (Leclercq, Reference Leclercq1988). No differences were observed between lines, suggesting that the difference in lipogenesis activity decreased after 9 weeks of age, particularly in males, for which the difference in AF also decreased (Figure 2). This conclusion was supported by the measurement of de novo fatty acid synthesis in 15-week-old chickens (Saadoun and Leclercq, Reference Saadoun and Leclercq1986), which showed no difference between lines. However, the difference in the amount of AF between lines persisted during adulthood, and the proportion of yolk in the eggs of FL hens was greater than that of LL hens, probably resulting from the difference in glucose–insulin balance between lines (Leclercq et al., Reference Leclercq, Kouassi-Kouakou and Simon1985).
Lipogenesis activity
Saadoun and Leclercq (Reference Saadoun and Leclercq1987) reported that hepatic lipogenesis was more pronounced in FL than in LL growing chickens. Regardless of diet or nutritional state, usually, FL chickens exhibited higher liver triglyceride content than LL chickens. A high-fat diet reduced lipogenesis activity in adipose and muscle tissues. This decrease was less pronounced in FL than in LL birds.
Simon et al. (Reference Simon, Chevalier, Derouet and Leclercq1991) reported that greater fattening of FL chickens compared with LL chickens could not be explained by an increase in the number of hepatic insulin receptors (INSR) or INSR kinase activity. However, the significant activation of the early stages of insulin signaling in the livers of fed FL chickens could at least partly account for their increased liver lipogenesis, although phosphatidyl-inositol 3′-kinase activity was not affected by genotype (Dupont et al., Reference Dupont, Chen, Derouet, Simon, Leclercq and Taouis1999). In fact, in the fed state, tyrosine phosphorylation of the liver INSR, insulin receptor substrate-1 (IRS-1) and Src homology and collagen protein (Shc) was higher in FL chickens and dependent on higher plasma insulin levels than in LL chickens.
Regardless of the nutritional status of chickens (fasted or ad libitum fed), Alleman et al. (Reference Alleman, Bordas, Caffin, Daval, Diot, Douaire, Fraslin, Lagarrigue and Leclercq1999b) found no difference between lines for the hepatic activity of citrate synthase, isocitrate dehydrogenase or malic enzyme, whereas FL chickens exhibited higher levels of activity of lactate dehydrogenase and malate dehydrogenase than LL chickens. Legrand and Lemarchal (Reference Legrand and Lemarchal1988) showed that hepatic Δ9 desaturating activity was higher in 11-week-old FL birds than in LL birds (41.1 v. 11.7 nmol/min per g liver), suggesting a higher rate of VLDL secretion.
Other hormones
In 5-week-old birds from generation F9, fasted for 16 h and then refed, the plasma growth hormone (GH) concentration was higher in FL than in LL (Picaper et al., Reference Picaper, Leclercq, Saadoun and Mongin1986). In contrast, Williams et al. (Reference Williams, Harvey and Leclercq1986) found no differences between the lines for GH or oestradiol plasma concentrations measured from 6 to 24 weeks of age in fed female birds of the F4 generation. However, LL females exhibited higher plasma-luteinizing hormone between 7 and 18 weeks of age. Buyse et al. (Reference Buyse, Vanderpooten, Leclercq, Berghman and Decuypere1994) found no differences between lines for GH plasma concentration, baseline, amplitude, length and frequency of GH pulses or affinity constants of specific GH binding to its liver receptors.
Higher levels of triiodothyronine (T3) and lower levels of thyroxine (T4) were found in the plasma of LL than FL chickens in the fed state during the growing period (Leclercq et al., Reference Leclercq, Guy and Rudeaux1988a). This difference disappeared as the birds reached sexual maturity. No differences between lines were observed at hatching or at adult age. T3 dietary supplementation decreased the AF proportion similarly in the two lines. Swennen et al. (Reference Swennen, Janssens, Collin, Le Bihan-Duval, Verbeke, Decuypere and Buyse2006) also reported higher plasma T3 levels in LL chickens than in FL chickens after a 24-h fasting period. The plasma T4 level was higher in FL chickens than in LL chickens in the refed state for 7 h after a 24-h fasting period. On the other hand, measuring T3 and T4 plasma levels in birds at 1, 3, 5 and 7 weeks of age, Byerly et al. (Reference Byerly, Simon, Le Bihan-Duval, Duclos, Cogburn and Porter2009) found no difference between lines for T4 and a slight increase in T3 at week 1 in FL.
Corticosterone levels were very similar in both lines in fasted and fed states and during refeeding (Saadoun et al., Reference Saadoun, Simon, Williams and Leclercq1988). Exogenous corticosterone increased fat content to a similar extent in both lines, suggesting similar sensitivity to this hormone (Saadoun et al., Reference Saadoun, Simon and Leclercq1987).
FL chickens exhibited higher plasma levels of IGF-I and IGF-II (insulin growth factors) than LL chickens in fasted and fed states, respectively, whereas no differences were observed between lines for their binding proteins (Beccavin et al., Reference Beccavin, Chevalier, Simon and Duclos1999). This could partly explain the greater growth rate or FL chickens.
Thermoregulation
Birds of both lines exhibited the same body temperature in both fed and fasted states (Leclercq, Reference Leclercq1988). Energy expenditure was similarly enhanced in both lines by cold exposure (10°C v. 25°C; Géraert et al., Reference Géraert, Mac Leod and Leclercq1988). Swennen et al. (Reference Swennen, Janssens, Collin, Le Bihan-Duval, Verbeke, Decuypere and Buyse2006) found no difference between lines for diet-induced thermogenesis in terms of metabolic BW (kg BW0.75) over 24 h/g of feed intake. However, Géraert et al. (Reference Géraert, Guillaumin and Leclercq1993) demonstrated that LL chickens had greater resistance to hot conditions (32°C v. 22°C) than FL chickens.
Protein metabolism
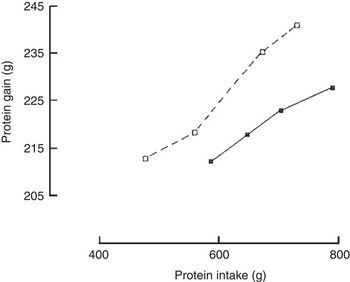
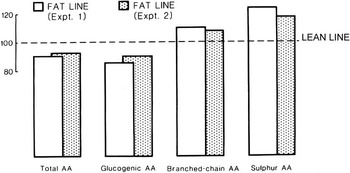
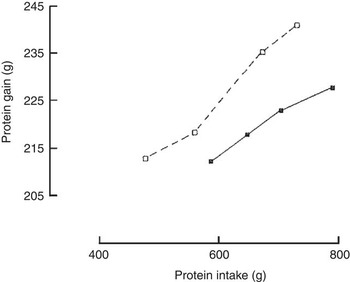
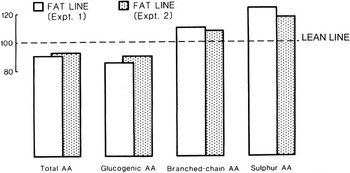
Leclercq (Reference Leclercq1983), Leclercq and Guy (Reference Leclercq and Guy1991) and Pym et al. (Reference Pym, Leclercq, Tomas and Tesseraud2004) showed that protein retention efficiency was higher in LL birds than in FL birds fed low- or high-protein diets (Figure 3). At a given protein intake, feather protein gain was also greater in LL than in FL chickens (Leclercq and Guy, Reference Leclercq and Guy1991). Géraert et al. (Reference Géraert, Leclercq and Larbier1987) reported that growing FL chickens had lower plasma levels of glucogenic AAs (e.g. alanine, threonine, glutamic acid and arginine) and higher levels of branched chain and sulphur AAs (SAAs) than LL birds, irrespective of diet and nutritional status (Figure 4). Leclercq et al. (Reference Leclercq, Chagneau, Cochard, Hamzaoui and Larbier1993) also found higher plasma concentrations of lysine, glutamic acid, histidine and serine and lower concentrations of branched AA, aromatic AA, SAA and arginine in LL birds than in FL birds. They found no differences between lines for aspartic acid, glycine, alanine or total AA. A higher insulin level in FL chickens might stimulate glucogenic AA hepatic uptake for lipogenesis. FL birds catabolized a greater proportion of dietary AA as demonstrated by the increase in uric acid excretion (Géraert et al., Reference Géraert, Mac Leod and Leclercq1988). Moreover, Alleman et al. (Reference Alleman, Bordas, Caffin, Daval, Diot, Douaire, Fraslin, Lagarrigue and Leclercq1999b) found greater glutamate dehydrogenase activity in the livers of fasted FL birds than in those of LL birds, confirming higher AA catabolism in FL chickens. However, Swennen et al. (Reference Swennen, Janssens, Collin, Le Bihan-Duval, Verbeke, Decuypere and Buyse2006) found no difference between the lines for protein oxidation as measured by plasma uric acid levels.
Relationship between body protein gain and protein intake from 3 to 8 weeks of age in male chickens of fat (FL) and lean (LL) lines (Leclercq, Reference Leclercq1983).
Plasma concentrations of free amino acids (AAs) in chickens selected for high abdominal fat relative to values determined in chickens selected for low abdominal fat (data from experiments 1 and 2 combined; Géraert et al., Reference Géraert, Leclercq and Larbier1987).
In free-choice feeding between diets containing different protein levels, FL chickens selected lower overall dietary protein content (179 v. 200 g/kg) than LL chickens (Leclercq and Guy, Reference Leclercq and Guy1991).
Moreover, it was possible to reduce the growth rate of LL chickens by decreasing the SAA concentration in diets (5.4 v. 5.8 g/kg), whereas the growth rate of FL chickens was not affected (Leclercq et al., Reference Leclercq, Chagneau, Cochard, Hamzaoui and Larbier1993). SAA retention was always greater in LL chickens than in FL chickens. These findings suggest that LL chickens require higher-dietary SAA levels and use SAA more efficiently than FL chickens. LL birds also exhibited lower growth rates than FL birds when diets were deficient in lysine, arginine or threonine (Alleman et al., Reference Alleman, Michel, Chagneau and Leclercq1999a). However, LL birds used these AAs more efficiently than FL birds. Alleman et al. (Reference Alleman, Michel, Chagneau and Leclercq2000) suggested that selection for fatness or leanness changed the AA requirements independently of the effects of food intake. For example, Alleman et al. (Reference Alleman, Michel, Chagneau and Leclercq1999a) estimated the digestible threonine requirement to be 13.9 and 12.4 mg per g of weight gain for LL and FL chickens, respectively.
Genetic control
Males and females originating from reciprocal F1 crosses between FL and LL chickens exhibited intermediate values for AF weight and proportion in relation to BW, fasting plasma glucose and lipid concentrations compared with those of the parental pure lines. These findings suggest that fattening in chickens is under polygenic control (Leclercq, Reference Leclercq1986).
In the livers of fed birds slaughtered at 9 weeks of age, the mRNA levels of ATP-citrate lyase (ACL), malic enzyme (ME), stearoyl-Coa desaturase (SCD) and apolipoprotein A1 (APO-A1) were more than twofold higher in FL chickens than in LL chickens (Alleman et al., Reference Alleman, Bordas, Caffin, Daval, Diot, Douaire, Fraslin, Lagarrigue and Leclercq1999b). Daval et al. (Reference Daval, Lagarrigue and Douaire2000) also showed that FL chickens had higher hepatic transcription rates and mRNA levels for several genes involved in hepatic lipid metabolism (ACL, ME and APO-A1) than LL chickens. These findings suggest that the greater hepatic lipogenesis ability of fat chickens is controlled at the gene level. Assaf et al. (Reference Assaf, Lagarrigue, Daval, Sansom, Leclercq, Michel, Pitel, Alizadeh, Vignal and Douaire2004) tested the genetic linkage between polymorphic sites in genes encoding key enzymes involved in fatty acid synthesis and secretion in the liver (ACL, ME, SCD, acetyl-CoA carboxylase (ACC) and fatty acid synthase (FASN)) and the fatness trait segregating in an F2 design obtained by inter-crossing FL and LL. Despite confirmation of higher mRNA levels in FL chickens, no genetic linkage of the gene alleles with the phenotype could be found. Moreover, the similar mRNA levels of sterol regulatory element-binding protein (SREBP1 and -2) observed between the two lines also eliminated the possibility of transcriptional factors regulating the two SREBP genes being directly responsible for variability of fatness.
Lagarrigue et al. (Reference Lagarrigue, Pitel, Carre, Abasht, Le Roy, Neau, Amigues, Sourdioux, Simon, Cogburn, Aggrey, Leclercq, Vignal and Douaire2006) investigated quantitative trait loci (QTL) for abdominal fatness and breast muscle weight in a three-generation design performed by inter-crossing FL and LL. They used 129 microsatellite markers and identified two significant QTL for fatness on chromosomes 1 and 5. Using the same experimental design, Abasht et al. (Reference Abasht, Pitel, Lagarrigue, Le Bihan-Duval, Le Roy, Demeure, Vignoles, Simon, Cogburn, Aggrey, Vignal and Douaire2006) confirmed the presence of QTL for fatness on chromosome 5 and identified a QTL by sex interaction. They also demonstrated that fat QTL alleles were segregating in both fat and lean lines. Univariate analyses confirmed the segregation for an AF QTL on chromosome 5 in male offspring, but not in female offspring (Le Mignon et al., Reference Le Mignon, Pitel, Gilbert, Le Bihan-Duval, Vignoles, Demeure, Lagarrigue, Simon, Cogburn, Aggrey, Douaire and Le Roy2009). Using a high-density genetic map, Demeure et al. (Reference Demeure, Duclos, Bacciu, Le Mignon, Filangi, Pitel, Boland, Lagarrigue, Cogburn, Simon, Le Roy and Le Bihan-Duval2013) proposed potential candidate genes located in QTL regions such as IGF-I, ACC and A2 phospholipases from groups IIE, V and IIA. A microarray analysis of differential gene expression in the livers of LL and FL chickens showed that cytochrome P450 2C45, thought to have a role in the biotransformation of steroids and poly-unsaturated fatty acids, was more highly expressed in LL chickens, whereas FASN, SCD, SREBP1 and hepatocyte nuclear factor 4 A were more highly expressed in FL chickens (Bourneuf et al., Reference Bourneuf, Hérault, Chicault, Carre, Assaf, Monnier, Mottier, Lagarrigue, Douaire, Mosser and Diot2006).
Skiba-Cassy et al. (Reference Skiba-Cassy, Collin, Chartrin, Medale, Simon, Duclos and Tesseraud2007) determined the mRNA levels of carnitine palmitoyltransferase 1 (CPT1) and succinyl-CoA:3-ketoacid CoA transferase (SCOT) in the liver and muscles. In the fed state, LL chickens exhibited higher mRNA L-CPT1 levels and greater β-hydroxy-acyl CoA dehydrogenase activity in the liver than FL chickens. There was no difference between lines for these two parameters in Pectoralis major and Sartorius muscles. However, FL chickens exhibited higher mRNA levels of M-CPT1 than LL chickens in the same muscles in both fed and fasting states. The mRNA level of SCOT was similar for both lines in P. major muscle, whereas the level was higher for LL chickens than FL chickens in the Sartorius muscle. Therefore, it seems that LL and FL chickens promote β-oxidation of lipids in the liver and muscles, respectively. In glycoytic-oxidative muscle, LL chickens can use ketone bodies produced by the liver as energy substrate. Collin et al. (Reference Collin, Swennen, Skiba-Cassy, Buyse, Chartrin, Le Bihan-Duval, Crochet, Duclos, Joubert, Decuypere and Tesseraud2009) also investigated the regulation of fatty acid oxidation in FL and LL chickens in the liver and Gastrocnemius muscle at the mRNA level. Their findings suggest that fatty acid utilization by mitochondria might be higher in both muscle and liver in FL chickens than in LL chickens, particularly when fed a high-fat and low-protein diet. Sibut et al. (Reference Sibut, Le Bihan-Duval, Tesseraud, Godet, Bordeau, Cailleau-Audouin, Chartrin, Duclos and Berri2008) investigated the transcriptional levels of enzymes involved in glycogen turnover in breast muscle. Their findings demonstrated downregulation and upregulation of the γ1 and γ2 AMPK subunit isoforms, respectively, in the muscle of LL chickens compared with FL chickens. They also showed greater gene expression of glycogen synthase, glycogen phosphorylase and the γ subunit of phosphorylase kinase in LL chickens. Selection on body fatness in the chicken could alter muscle glycogen content or turnover and, consequently, the quality traits of the resulting meat.
Byerly et al. (Reference Byerly, Simon, Le Bihan-Duval, Duclos, Cogburn and Porter2009) investigated the hypothalamic obesity gene network in FL and LL chickens. They showed that plasma T3 was increased and brain-derived neurotrophic factor (BDNF) expression decreased in FL compared with LL before and at the onset of adiposity divergence (weeks 1 and 3). Hypothalamic thyrotropin-releasing hormone (TRH) mRNA levels were lower in FL at week 3, suggesting that increased BDNF expression in LL might increase the expression of TRH, or the increased T3 in FL might inhibit expression of TRH. Finally, hypothalamic BDNF mRNA levels continued to increase at week 5 in LL compared with FL, corresponding to an increase in BDNF tyrosine kinase receptor B and leptin receptor mRNA levels. These differences between lines might at the hypothalamic level explain the greater ability of FL for body fat deposition. Byerly et al. (Reference Byerly, Simon, Cogburn, Le Bihan-Duval, Duclos, Aggray and Porter2010) defined hypothalamic transcription profiles with cDNA microarrays before and during divergence between FL and LL chickens on adiposity. They found differential expression between lines of genes involved in the control of body fat, glucose metabolism, glucose sensing and TNF signalling. The main differences occurred at 1 week of age, which is well before the divergence in adiposity between lines that begins at 3 weeks of age.
Conclusion
Selection for low or high AF content has resulted in a twofold higher carcass fatness for FL chickens compared with LL chickens without affecting the intramuscular lipid content. However, as BW at 63 days of age is kept similar between the two lines, carcass fatness cannot become excessive. Therefore, FL chickens do not develop hyperphagia behaviour. The main physiological modification seems to be a difference in the glucose–insulin balance, wherein FL chickens display a ‘pre-obese’ status. The highest circulating insulin level stimulates neo-glycogenesis in muscles and hepatic lipogenesis by directing AA towards such metabolism. Other hormones such as T3, T4, IGF-I and IGF-II could be involved in the regulation of metabolism, although their roles and mechanisms need further investigation. Certain studies began to describe the control of such metabolic differences at the hypothalamic level, but the link with other organs remained to be elucidated. As selection concerned only males, the gene control is sex dependent. Moreover, as the fatness of FL chickens is not excessive, the genes involved in the control of fatness seem not to be fixed in this line, and this could partly explain the variability observed in plasma levels of metabolites and hormones between experiments. Another explanation for this variability is based on the interaction between lines and diet characteristics, mainly the starch/lipids ratio and the energy/protein content ratio. Other factors such as the generation and age of the chickens could also explain discrepancies between studies.