



1 Introduction
Icing of surfaces due to the impact of water drops at subfreezing temperatures is a phenomenon present in various fields of nature and technology. It poses a severe problem for transportation systems, as it may result in ice accretion on aircraft (Cebeci & Kafyeke Reference Cebeci and Kafyeke2003), ships (Makkonen Reference Makkonen1987) and roadways (Symons & Perry Reference Symons and Perry1997). However, it is also a frequent problem for power lines (Szilder, Lozowski & Reuter Reference Szilder, Lozowski and Reuter2002; Farzaneh Reference Farzaneh2008) and wind turbines (Dalili, Edrisy & Carriveau Reference Dalili, Edrisy and Carriveau2009). Iced surfaces not only affect the proper and reliable function of the respective system; they can also represent a serious danger, since aircraft may crash, ships can capsize, iced roads result in traffic accidents and power lines and wind turbines may collapse as a consequence of the additional loading by ice accretion. To minimize these risks, a correct understanding of the mechanisms during ice accretion is of fundamental importance for the prediction and prevention of ice accretion.
Several physical processes, including fluid flow and heat transfer during drop impact, nucleation of the potentially supercooled liquid, and the solidification of the liquid, which may be affected by the impact surface, are involved during ice accretion. The spreading of a drop impacting onto a solid surface under isothermal conditions has been extensively studied and is well understood (Rein Reference Rein1993, Reference Rein2003; Yarin Reference Yarin2006; Roisman Reference Roisman2009; Roisman, Berberović & Tropea Reference Roisman, Berberović and Tropea2009; Josserand & Thoroddsen Reference Josserand and Thoroddsen2016; Yarin, Roisman & Tropea Reference Yarin, Roisman and Tropea2017). Heat transfer during non-isothermal drop impact has been examined numerically (Pasandideh-Fard et al. Reference Pasandideh-Fard, Bhola, Chandra and Mostaghimi1998, Reference Pasandideh-Fard, Aziz, Chandra and Mostaghimi2001; Berberović et al. Reference Berberović, Roisman, Jakirlić and Tropea2011; Schremb et al. Reference Schremb, Borchert, Berberović, Jakirlić, Roisman and Tropea2017a ), experimentally (Pasandideh-Fard et al. Reference Pasandideh-Fard, Bhola, Chandra and Mostaghimi1998; Moita, Moreira & Roisman Reference Moita, Moreira and Roisman2010) as well as theoretically (Roisman Reference Roisman2010). It is an important aspect in the scope of icing, since it determines the liquid temperature, which in turn is a crucial parameter for the nucleation and freezing process. The statistics of nucleation has been studied in depth for the case of liquid at rest, such as sessile or levitated drops (Pruppacher & Klett Reference Pruppacher and Klett1997; Hobbs Reference Hobbs2010; Hoose & Möhler Reference Hoose and Möhler2012). However, only a few studies consider the statistics of nucleation during the complex process of a drop impact (Schremb, Roisman & Tropea Reference Schremb, Roisman and Tropea2015; Schremb et al. Reference Schremb, Roisman, Jakirlić and Tropea2016; Schremb, Roisman & Tropea Reference Schremb, Roisman and Tropea2017c ). As long as an impinging drop is liquid, it may move on the substrate until solidification fixes its current shape. The stochastic nature of nucleation, which is the trigger for solidification, therefore strongly influences the shape and size of the area iced after a drop impact onto a dry solid surface; even if the impact conditions are constant (Schremb et al. Reference Schremb, Roisman and Tropea2015). Both the impact and freezing process may be described separately, depending on the impact conditions and temperatures. Due to stochastic nucleation, the impact and freezing processes do not start simultaneously in the case of drop impact onto a dry solid surface and therefore, also their mutual interaction is subject to the stochastic freezing delay time.
Solidification in general depends on the temperature of the liquid. For solidification at the freezing temperature, the solidification front is stable and its propagation can be mathematically described as a one-phase Stefan problem (Alexiades & Solomon Reference Alexiades and Solomon1992; Davis Reference Davis2001). In the case of a supercooled liquid, the front propagation is described as a two-phase Stefan problem. In both cases of stable freezing, the freezing front velocity decreases with time. However, in the case of a supercooled liquid, the initially planar freezing front may become unstable, resulting in the fast propagation of single dendrites or a cloud of dendrites through the liquid (Schremb & Tropea Reference Schremb and Tropea2016; Schremb et al. Reference Schremb, Campbell, Christenson and Tropea2017b ). If the supercooled liquid is in contact with a solid substrate and solidification is initiated by heterogeneous nucleation at the substrate, a thin ice layer propagates along the substrate surface prior to dendritic freezing (Kong & Liu Reference Kong and Liu2015; Schremb & Tropea Reference Schremb and Tropea2016; Schremb et al. Reference Schremb, Campbell, Christenson and Tropea2017b ). The typical dendrite velocity, which is constant in time and just depends on the liquid supercooling, is much higher than the transient front velocity of a planar freezing front. However, the propagation velocity of the thin ice layer at a solid wall is even higher than the front velocity of the dendrite cloud (Kong & Liu Reference Kong and Liu2015; Schremb & Tropea Reference Schremb and Tropea2016; Schremb et al. Reference Schremb, Campbell, Christenson and Tropea2017b ), but is also constant in time. It depends on the liquid supercooling and, in contrast to a freely growing dendrite, the ice layer velocity also depends on the thermal properties of the neighbouring wall (Kong & Liu Reference Kong and Liu2015; Schremb & Tropea Reference Schremb and Tropea2016; Schremb et al. Reference Schremb, Campbell, Christenson and Tropea2017b ).
The impact and solidification of water drops at room temperature onto an ice surface has already been investigated by Jin, Zhang & Yang (Reference Jin, Zhang and Yang2017). However, to the authors’ knowledge the impact of single supercooled water drops onto a smooth ice surface, resulting in immediate solidification of the impacting supercooled water drop, has never been investigated before. In the present study, the influence of varying drop and surface temperatures, and impact velocities on the lamella thinning and the ice layer thickness after a single drop impact at subfreezing conditions is experimentally examined and theoretically modelled. By using an ice impact surface, which acts as a uniform and immediate nucleator, stochastic nucleation is avoided and drop spreading and freezing begin simultaneously, resulting in a high repeatability of the experimental results. The impact process is observed using a high-speed video system with a high spatial and temporal resolution, and the lamella thinning and the thickness of the resulting ice layer are measured from the captured videos. The flow in the spreading lamella is mathematically described with consideration of the expanding dendrite cloud and the developing viscous boundary layer. A solution for the upper bound of the ice layer thickness resulting from a single drop impact is derived and shows very good agreement with the experimental results for all examined impact conditions. Based on the theoretical scaling, a semi-empirical equation is obtained, which allows an accurate prediction of the residual ice layer thickness after supercooled drop impact. The present work results in a better understanding of the mutual interaction between fluid flow and solidification during drop impact and may serve as a building block for the improvement of existing ice accretion models.
2 Experimental method
The experimental set-up is schematically shown in figure 1. It has been used in several previous studies (Schremb et al.
Reference Schremb, Roisman, Jakirlić and Tropea2016, Reference Schremb, Roisman and Tropea2017c
) and is modified for the present study to allow observation of the impact process in a side view. The set-up consists of three major parts: a drop generation system, a cooling system and an observation system. Drops are generated at a polytetrafluoroethylene (PTFE) tube supplied by a micropump with de-ionized water (Milli-Q Type 1, electrical conductivity
 $\unicode[STIX]{x1D70E}=5.5\times 10^{-6}~\text{S}~\text{m}^{-1}$
at
 $25\,^{\circ }\text{C}$
). After reaching a certain size, a drop detaches from the tube due to gravity. A very small volume flow rate of the micro pump guarantees a reproducible drop size, since inertia plays no role during drop detachment.
Schematic of the experimental set-up.
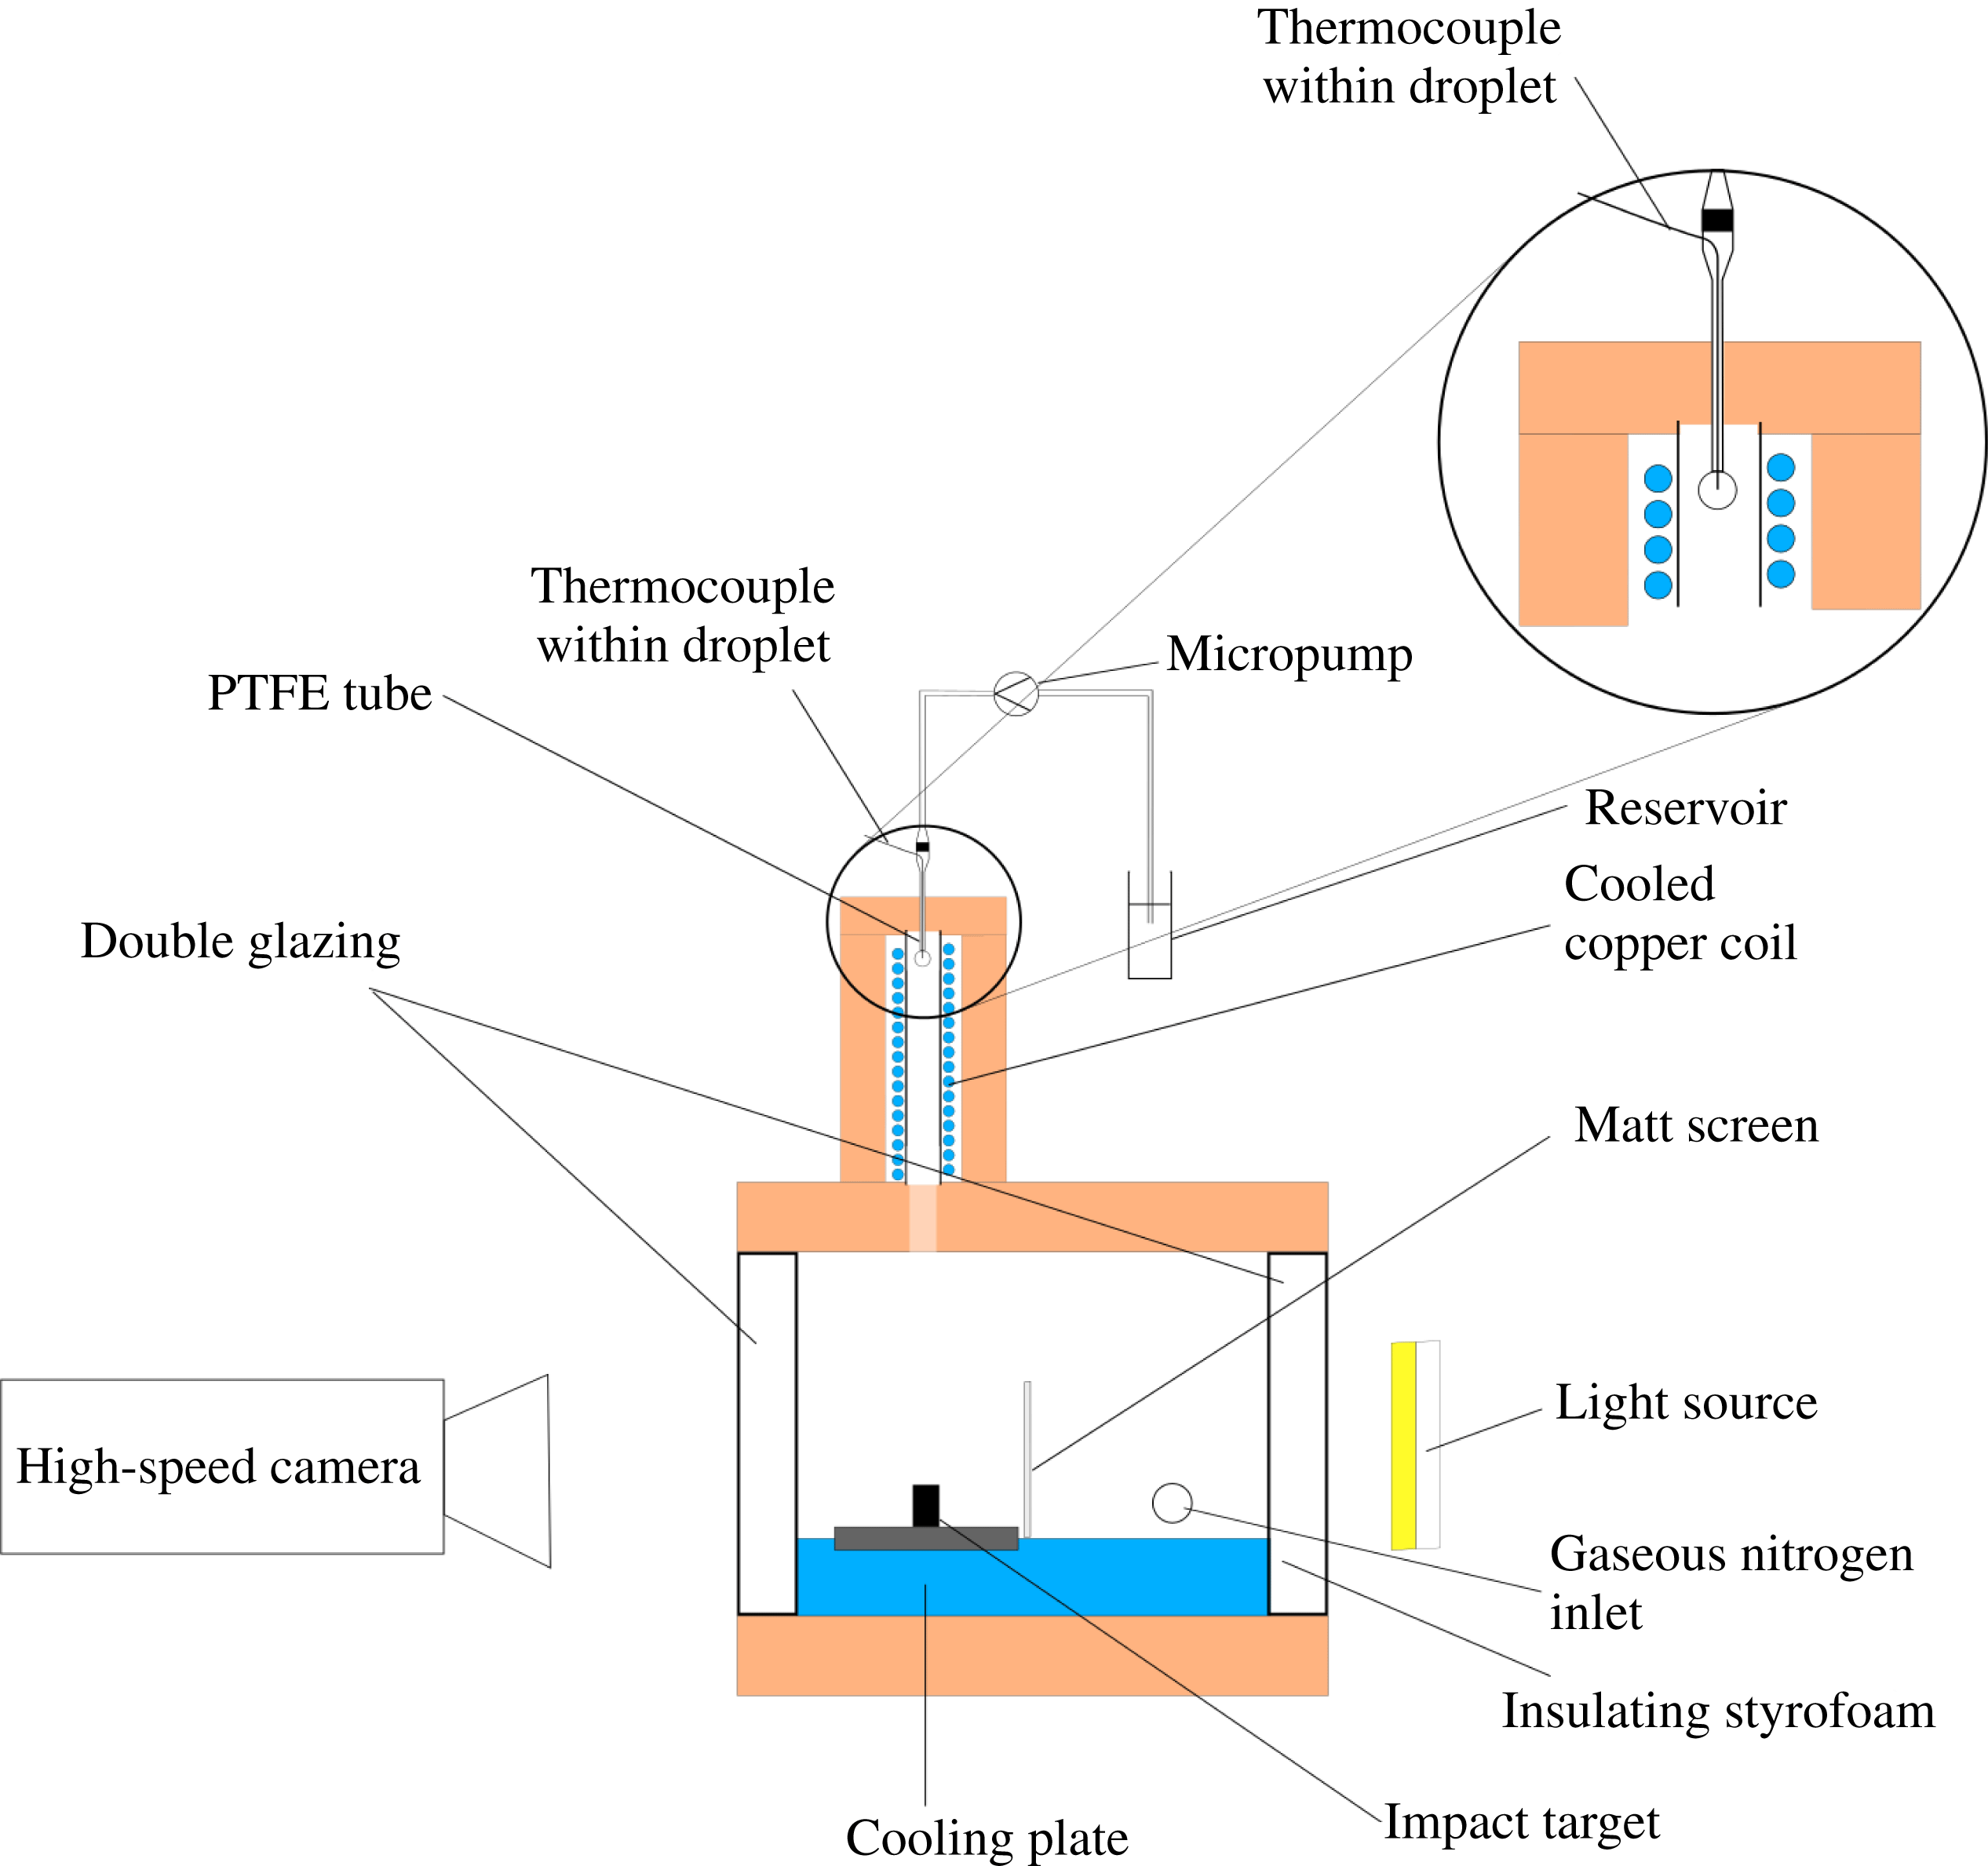
An external chiller provides a cold impact surface and is furthermore used to supercool the water drops. By heating a bypass flow of the cooling fluid, the drop and surface temperature can be controlled independently. An aluminium cooling plate is held at a constant temperature and a cylindrical aluminium impact target is placed on the cooling plate. Water drops impact onto a smooth ice surface, existing at the hollow upper end of the impact target. This ice surface is generated by freezing a water drop placed in the cavity of the impact target and horizontally cutting the hemispherical frozen drop with a razor blade. With a diameter of approximately 5 mm, the size of the ice impact surface is comparable to the drop diameter and therefore, it is smaller than the maximum spread of the impacting drop. Liquid is ejected from the edges of the impact surface during spreading and the formation of a pronounced rim around the centre of impact, which would otherwise hinder the observation of the entire process of lamella thinning, is suppressed (see figure 5). Therefore, the lamella thinning and the resulting ice layer thickness in the centre of drop impact can be observed undisturbed. This method has been used in several previous studies (Rozhkov, Prunet-Foch & Vignes-Adler Reference Rozhkov, Prunet-Foch and Vignes-Adler2002, Reference Rozhkov, Prunet-Foch and Vignes-Adler2004), and an influence of the ejection of the lamella on the measurement of the lamella thickness in the centre of impact is not expected.
The water drops cool down during their slow growth at the PTFE tube, which ends in a vertically oriented stainless steel tube. The tube is wrapped in a copper coil and a cooling fluid within the coil cools down the steel tube, providing a cold atmosphere in the tube, allowing drop supercoolings of up to
 $\unicode[STIX]{x0394}T=18~\text{K}$
. To thermally shield the set-up from the ambient and to avoid frost and condensate on any cold parts of the set-up, the cooling tower and the cooling plate are encapsulated in Styrofoam chambers filled with gaseous nitrogen. The drop temperature is continuously measured during drop generation with a thermocouple immersed into the drop, as shown in the detail of figure 1. Similarly, the temperature of the ice impact surface is measured with a thermocouple immersed into the impact target, ending in the ice surface.
The drop diameter
 $d_{d}$
is kept constant and has been measured for all investigated temperatures from multiple separate calibration videos as
 $d_{d}=3.4\pm 0.1~\text{mm}$
. The impact velocity
 $v_{d}$
is varied between
 $v_{d}=2.2\pm 0.02$
and
 $v_{d}=3.2\pm 0.02~\text{m}~\text{s}^{-1}$
. The velocity has also been determined from separate calibration videos for each temperature. The drop and surface temperature are varied between
 $-6$
and
 $-16\,^{\circ }\text{C}$
. Experiments are performed for both isothermal (the drop and surface temperature are equal) and non-isothermal conditions (the drop or surface temperature is varied while the remainder is constant). Considering the temperature dependence of the liquid properties, the impact Reynolds number,
 $Re\equiv d_{d}v_{d}/\unicode[STIX]{x1D708}$
, and Weber number,
 $We\equiv \unicode[STIX]{x1D70C}d_{d}v_{d}^{2}/\unicode[STIX]{x1D70E}$
, are
 $Re=2130\ldots 4860$
and
 $We=210\ldots 454$
respectively;
 $\unicode[STIX]{x1D708}$
and
 $\unicode[STIX]{x1D70E}$
are the liquid kinematic viscosity and surface tension.
The impact process is captured in a side view using a high-speed video system (Photron Fastcam SA 1), a long distance microscope (Navitar 6000 Zoom lens) and LED backlight illumination. To increase the temporal and spatial resolution during the experiments, the field of view is reduced and only the lower half of a drop is visible at the moment of first contact with the ice surface. The impact process is recorded with 10 000 frames per second and an optical resolution of approximately
 $5.5~\unicode[STIX]{x03BC}\text{m}~\text{pixel}^{-1}$
to allow accurate measurements of the transient lamella thinning and the resulting ice layer thickness.
3 Qualitative description
The processes taking place during the impact of a supercooled water drop onto an iced surface are very different from the processes during the impact onto a dry solid surface. In the case of drop impact onto a dry solid substrate, stochastic nucleation results in strongly varying freezing delay times after impact (Schremb et al. Reference Schremb, Roisman and Tropea2015, Reference Schremb, Roisman, Jakirlić and Tropea2016, Reference Schremb, Roisman and Tropea2017c ); fluid flow during drop impact and solidification do not start at the same time. Since freezing after nucleation fixes the momentary shape of the liquid, the varying moment of nucleation drastically influences the final outcome of such a drop impact event. Nucleation occurs at a discrete number of nucleation sites on the wetted solid substrate. After nucleation, a thin ice layer spreads along the solid surface with a constant velocity, just depending on the liquid supercooling and the thermal properties of the substrate (Kong & Liu Reference Kong and Liu2015; Schremb & Tropea Reference Schremb and Tropea2016; Schremb et al. Reference Schremb, Campbell, Christenson and Tropea2017b ). Depending on the supercooling of the liquid, the ice layer becomes unstable and results in dendritic solidification of the bulk liquid (Kong & Liu Reference Kong and Liu2015; Schremb & Tropea Reference Schremb and Tropea2016; Schremb et al. Reference Schremb, Campbell, Christenson and Tropea2017b ), as exemplarily shown in the side view of a freezing supercooled sessile water drop in figure 2.
Two-dimensional visualization of the dendritic solidification of a supercooled water drop at
 $-15.8\,^{\circ }\text{C}$
trapped in a Hele-Shaw cell. The initial ice layer as the base for the second freezing phase is observable as a bright layer at the substrate. The thickness of this ice layer is small compared to the size of the drop. Time
 $t=0$
corresponds to the end of the dendritic freezing phase. Photographs are taken from Schremb & Tropea (Reference Schremb and Tropea2016).

The dendrite cloud can be identified as a dark region radially expanding in the top view images in figure 3 showing a normal impact of a supercooled water drop onto a flat sandblasted aluminium surface. When the thickness of the dendrite cloud equals the thickness of the liquid film on the substrate, the current shape of the deformed liquid is fixed, as shown in figure 3 for
 $t>8.00\,\text{ms}$
. While the solidification along the solid substrate depends on the initial temperature and the substrate’s thermal properties (Kong & Liu Reference Kong and Liu2015; Schremb & Tropea Reference Schremb and Tropea2016; Schremb et al.
Reference Schremb, Campbell, Christenson and Tropea2017b
), the dendritic solidification of the bulk liquid mainly depends on the initial liquid temperature. After dendritic solidification of the liquid, the initial supercooling is exhausted, i.e. the drop is in thermodynamic equilibrium at the melting temperature. Only a portion of the liquid, which is proportional to the liquid’s supercooling, is frozen. A further removal of heat results in the solidification of the remaining liquid, accompanied by an increase of the final ice layer thickness due to the volume expansion during further freezing (not shown in figure 3).
Top view observation of a normal impact of a water drop at
 $-16.6\,^{\circ }\text{C}$
onto a sandblasted aluminium surface at
 $-16.6\,^{\circ }\text{C}$
. Nucleation at a single nucleation site is followed by the radial expansion of a thin ice layer along the solid substrate (not visible in the images) and dendritic freezing of the bulk liquid above the ice layer (dark region in the images), fixing the shape of the deformed drop.

Nucleation does not necessarily take place at the impact position, as can be seen in figure 3. However, for simplicity the radial spreading of both the spreading initial ice layer and the drop are assumed axisymmetric in the schematic illustration of the process in figure 4(a). As indicated in figure 3 and in figure 4(a), the radial growth of the ice layer of radius
 $r_{i}(t)$
is independent of the radial expansion of the spreading drop,
 $r_{w}(t)$
. The initial temperatures and thermal properties of both the drop and the substrate determine the contact temperature at the wetted surface. It is the characteristic temperature for heterogeneous nucleation. However, the thermal properties of the substrate also influence the radial spreading of the initial ice layer parallel to the wall by determining the dissipation of latent heat into the substrate (Kong & Liu Reference Kong and Liu2015; Schremb et al.
Reference Schremb, Campbell, Christenson and Tropea2017b
). Therefore, the tangential expansion of the initial ice layer along the solid substrate only depends on the supercooling of the impinging drop and on the initial temperature and thermal properties of the substrate; thus, it is independent of the radial spreading of the impacting drop.
Two-dimensional schematic of the solidification during impact of a supercooled drop onto a dry solid surface (a) and onto an ice surface (b).

Bringing an ice crystal into contact with supercooled water results in immediate freezing of the supercooled water, since a solid–liquid interface to which water molecules may attach already exists. Accordingly, when a supercooled water drop impacts onto an ice surface, the ice impact surface induces immediate freezing of the liquid. The formation of the new ice layer does not start at a single nucleation site, but starts immediately when the supercooled liquid makes contact with the ice surface; i.e. at the moving three-phase contact line of the spreading drop, where liquid makes contact with the impact surface by a rolling motion. Therefore, the radial expansion of the newly formed ice layer and the spreading of the drop are directly connected to each other: the radius of the new ice layer,
 $r_{i}(t)$
, equals the spreading radius of the drop,
 $r_{w}(t)$
, at every moment, as illustrated in figure 4(b). Hence, in contrast to a drop impact onto a dry solid surface, the radial spreading of the ice layer during the impact onto a ice surface mainly depends on the spreading of the impacting drop. It only indirectly depends on the initial temperatures and thermal properties, which may affect the hydrodynamic spreading process. Similar to the case of a drop impact onto a dry solid substrate, the propagation of the dendrite cloud through the spreading drop after the initial ice layer becomes unstable, mainly depends on the liquid temperature.
Figure 5 exemplarily shows the impact process of a supercooled water drop at
 $-14.0\,^{\circ }\text{C}$
onto the ice impact target at
 $-14.0\,^{\circ }\text{C}$
. At time
 $t=0$
the drop makes contact with the ice impact surface and begins to spread over the surface. Simultaneously, freezing of the supercooled liquid starts at the solid–liquid interface. The moving contact line reaches the edge of the ice surface at
 $t\approx 0.36~\text{ms}$
and for
 $t>0.36~\text{ms}$
, the spreading liquid is ejected from the edge of the ice surface. It forms a free expanding lamella around the impact target while the lamella continues thinning above the impact target. Since the drop diameter is comparable to the diameter of the ice impact target, the lamella is not ejected horizontally but under a certain angle to the horizontal (Rozhkov et al.
Reference Rozhkov, Prunet-Foch and Vignes-Adler2002).
Dynamics during impact of a water drop supercooled to
 $-14.0\,^{\circ }\text{C}$
onto a small ice impact target at
 $-14.0\,^{\circ }\text{C}$
. The red horizontal lines indicate the surface of the ice impact surface. The red circle in the fifth frame marks a position of freezing in the free liquid lamella, causing rupturing of the thin liquid film. Photographs are taken from Tropea, Schremb & Roisman (Reference Tropea, Schremb and Roisman2017). Movies of the impact process at these conditions are found as supplementary material of the online version of the present manuscript https://doi.org/10.1017/jfm.2017.797.
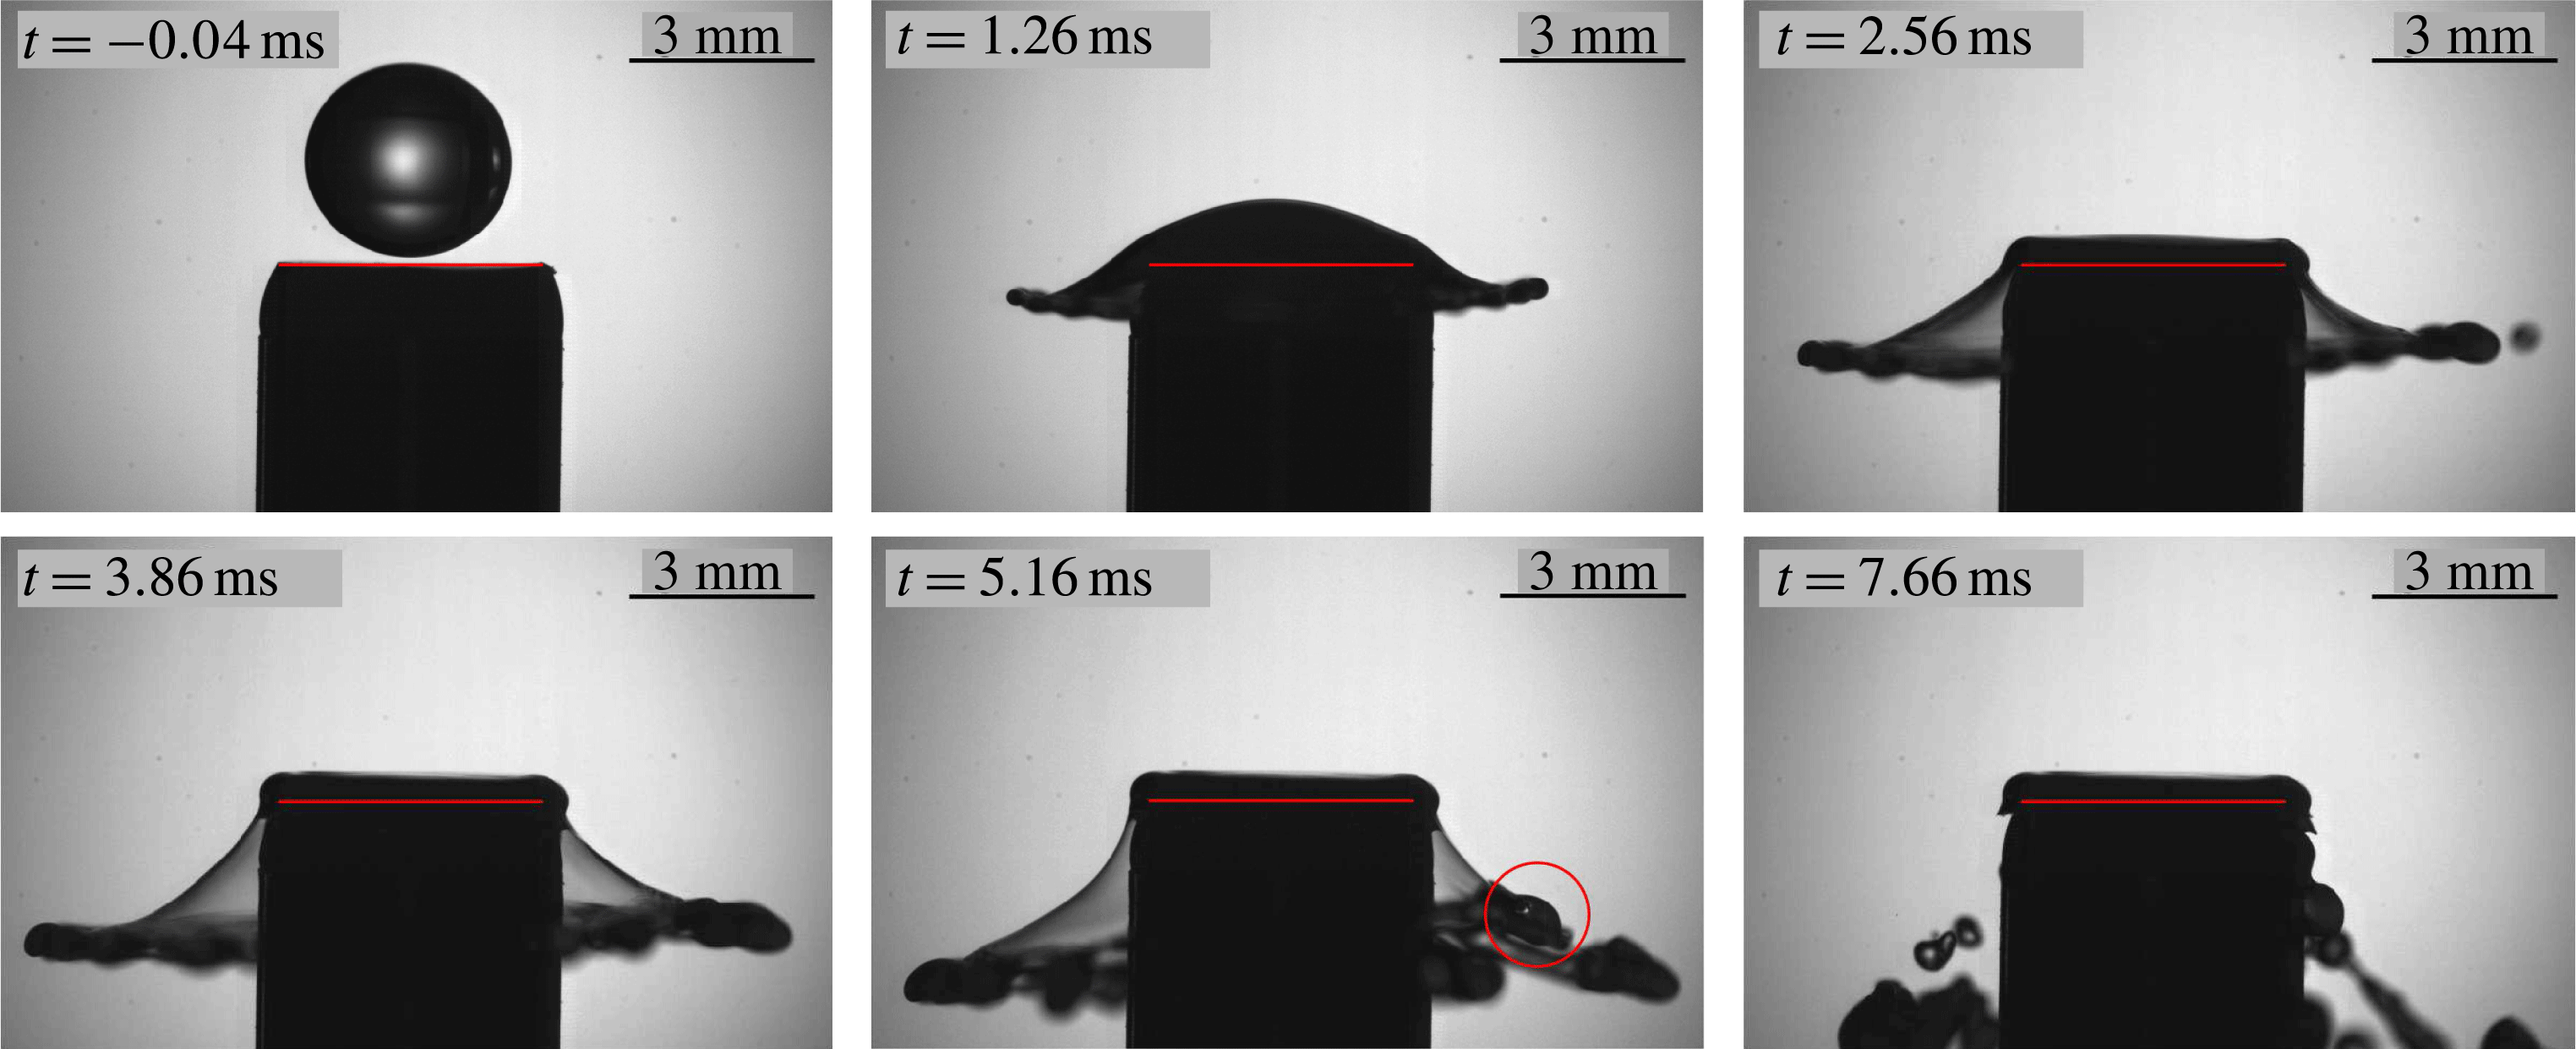
For the illustrated case, the minimum thickness of the lamella is reached when the height of the dendrite cloud equals the thickness of the thinning lamella at
 $t\approx 3.36~\text{ms}$
. The new layer on top of the ice impact surface consists of an array of dendrites surrounded by liquid water, both at the melting temperature
 $T_{m}$
.
At
 $t\approx 5.16~\text{ms}$
, the ejected lamella ruptures and detaches from the newly formed layer. Rupturing begins at the location marked with a red circle in the fifth frame of figure 5, which was previously located at the rim surrounding the lamella. At this position freezing of the free liquid film can be observed in the high-speed video. It is probably caused by a seeding ice crystal transported from the ice impact surface into the ejected lamella. As shown in the last frame of the figure, freezing is not only observed at the marked position in the fifth frame, but at almost every part of the rim around the free lamella. While most of the secondary droplets generated from the rupturing sheet are liquid, the major part of the rim in the last frame of figure 5 is frozen, which can be identified by means of the shape, clarity and translucence of the different parts. A reason for the predominance of freezing in the rim are seeding ice crystals which are detached from the ice impact surface by the high shear rate, especially during the beginning of the spreading process. During this stage relatively more seeding crystals are detached and carried away from the ice impact surface than in later stages of spreading. The initially spreading liquid later forms the rim surrounding the free lamella and its freezing is initiated by the transported seeding crystals.
For small propagation velocities of the dendrite cloud, i.e. for high liquid temperatures, the lamella reaches its minimum without being filled out completely by the dendrite cloud. In this case, a capillary wave propagates along the upper free surface of the liquid lamella. The wave influences the measurement of the lamella thickness in the centre of drop impact, as will be shown later. However, for increasing growth rates of the dendrite cloud, i.e. for lower temperatures, the influence of capillary waves on the thickness measurement is negligible.
After the first phase of solidification of the newly formed layer, the remaining liquid water freezes on a time scale of several seconds, resulting in an increasing layer thickness due to the volume expansion during solidification. Although the ultimate ice layer thickness is reached just after this second phase of solidification, the processes during the first dendritic phase of solidification (
 $t<3.36~\text{ms}$
for the case in figure 5) are the focus of the present work.
Note that the images in figure 5 serve only for illustration of the process and the measurements shown in the present study have been performed with a spatial resolution approximately three times higher than that in figure 5.
4 Experimental results
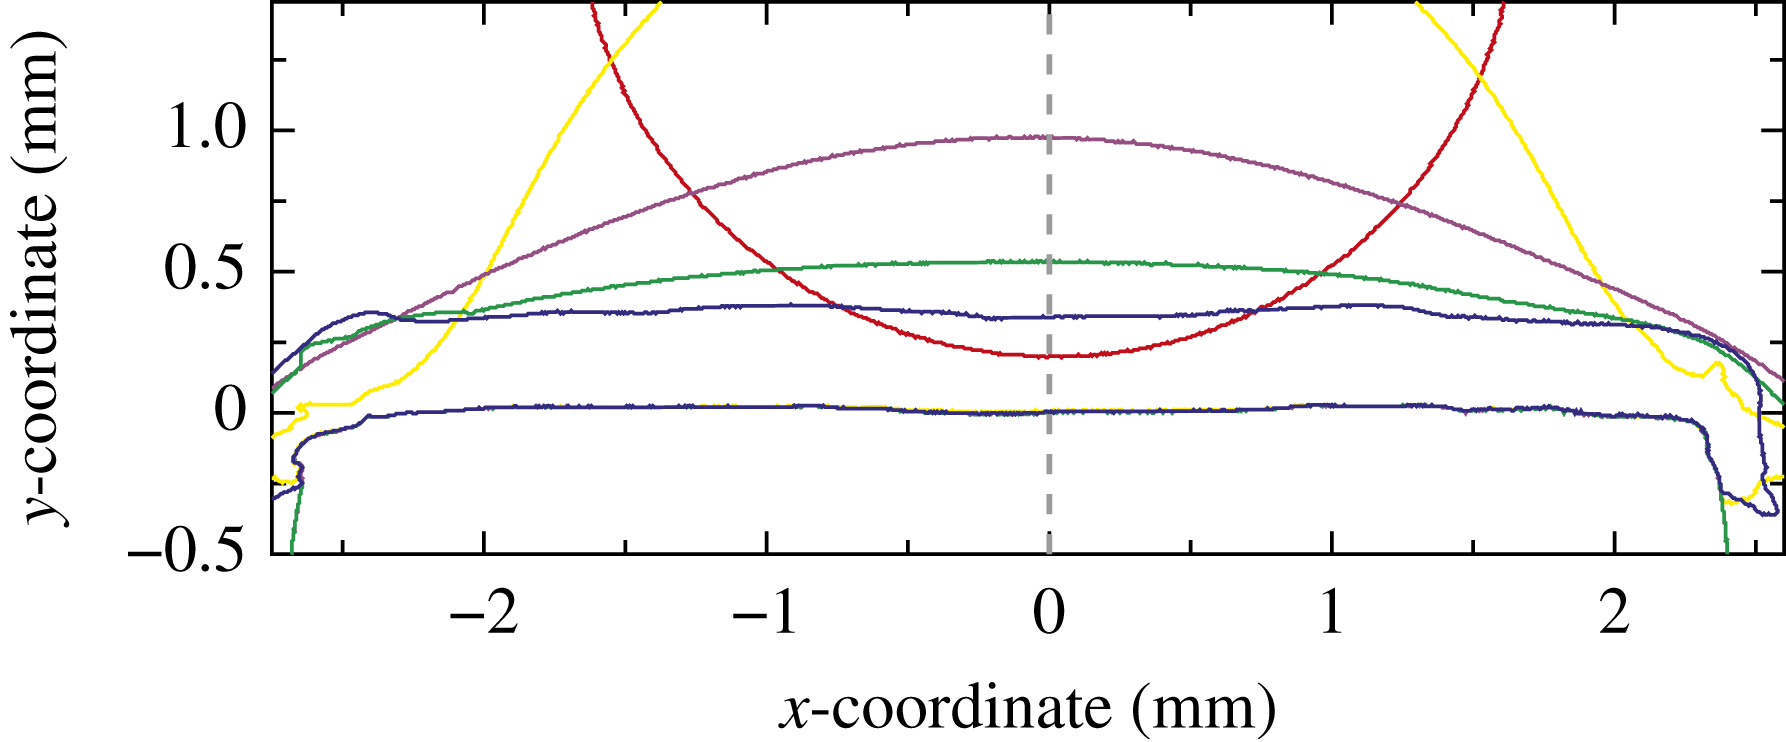
The temporal evolution of the entire lamella profile is obtained from the post-processing of the experimental video data, as exemplarily shown in figure 6. However, all following data concerning the lamella thinning refer to the lamella thickness in the centre of drop impact, along the dashed grey line in figure 6. This is assumed to be a representative measure for the entire icing process.
Exemplary temporal evolution of the lamella profile during impact onto the small ice impact surface. With respect to the first contact between the drop and the surface at
 $t=0$
, the profile is shown for
 $t=-0.06~\text{ms}$
(red),
 $t=0.44~\text{ms}$
(yellow),
 $t=0.94~\text{ms}$
(violet),
 $t=1.44~\text{ms}$
(green) and
 $t=5.94~\text{ms}$
(blue).
For each set of impact conditions, the experiment has been repeated at least 6 times to verify the repeatability, and to increase the statistical significance of the experimental results. Figure 7 exemplarily shows the temporal evolution of the lamella thickness measured for the 8 repetitions with a drop and surface temperature of
 $T=-14.0\,^{\circ }\text{C}$
(figure 7
a) and with a drop and surface temperature of
 $T=-6.0\,^{\circ }\text{C}$
(figure 7
b) as dashed lines; in both cases for an impact velocity of
 $v_{d}=2.2\pm 0.02~\text{m}~\text{s}^{-1}$
. Moreover, the averaged data of the repetitions are also depicted in figure 7 as solid lines. As mentioned earlier, to increase the spatial resolution of the high-speed videos, only a portion of an impacting drop is visible at the instant of first contact between the drop and the surface. Hence, the measurement of the lamella thickness is only possible for
 $t>0.81~\text{ms}$
, when the north pole of the impacting drop is in the field of view of the camera. The averaged data shown for
 $0<t<0.81~\text{ms}$
are interpolated using a third-order polynomial, and the measured data for
 $t>0.81~\text{ms}$
and
 $h_{lam}(t=0)=d_{d}$
. As shown in figure 7(a) for the case of
 $T=-14.0\,^{\circ }\text{C}$
, the lamella thickness is in very good agreement for all experiments during the entire time of lamella thinning. The relative variation between the largest and the smallest measured lamella thickness is at all times below 4.6 %. Thus, the experimental results are in general highly reproducible and unaffected by any variations which would result from stochastic nucleation.
Exemplary measurement and averaging of the temporal evolution of the lamella thickness for the eight experiments with a drop and surface temperature of (a)
 $T=-14.0\,^{\circ }\text{C}$
and (b)
 $T=-6.0\,^{\circ }\text{C}$
; in both cases for an impact velocity of
 $v_{d}=2.2\pm 0.02~\text{m}~\text{s}^{-1}$
. The measurements and averaging begin at
 $t\approx 0.81~\text{ms}$
. The evolution of the averaged data for
 $0<t<0.81~\text{ms}$
is based on a cubic interpolation of the measured data for
 $t>0.81~\text{ms}$
and
 $h_{lam}(t=0)=d_{d}$
. Data are taken from Tropea et al. (Reference Tropea, Schremb and Roisman2017).
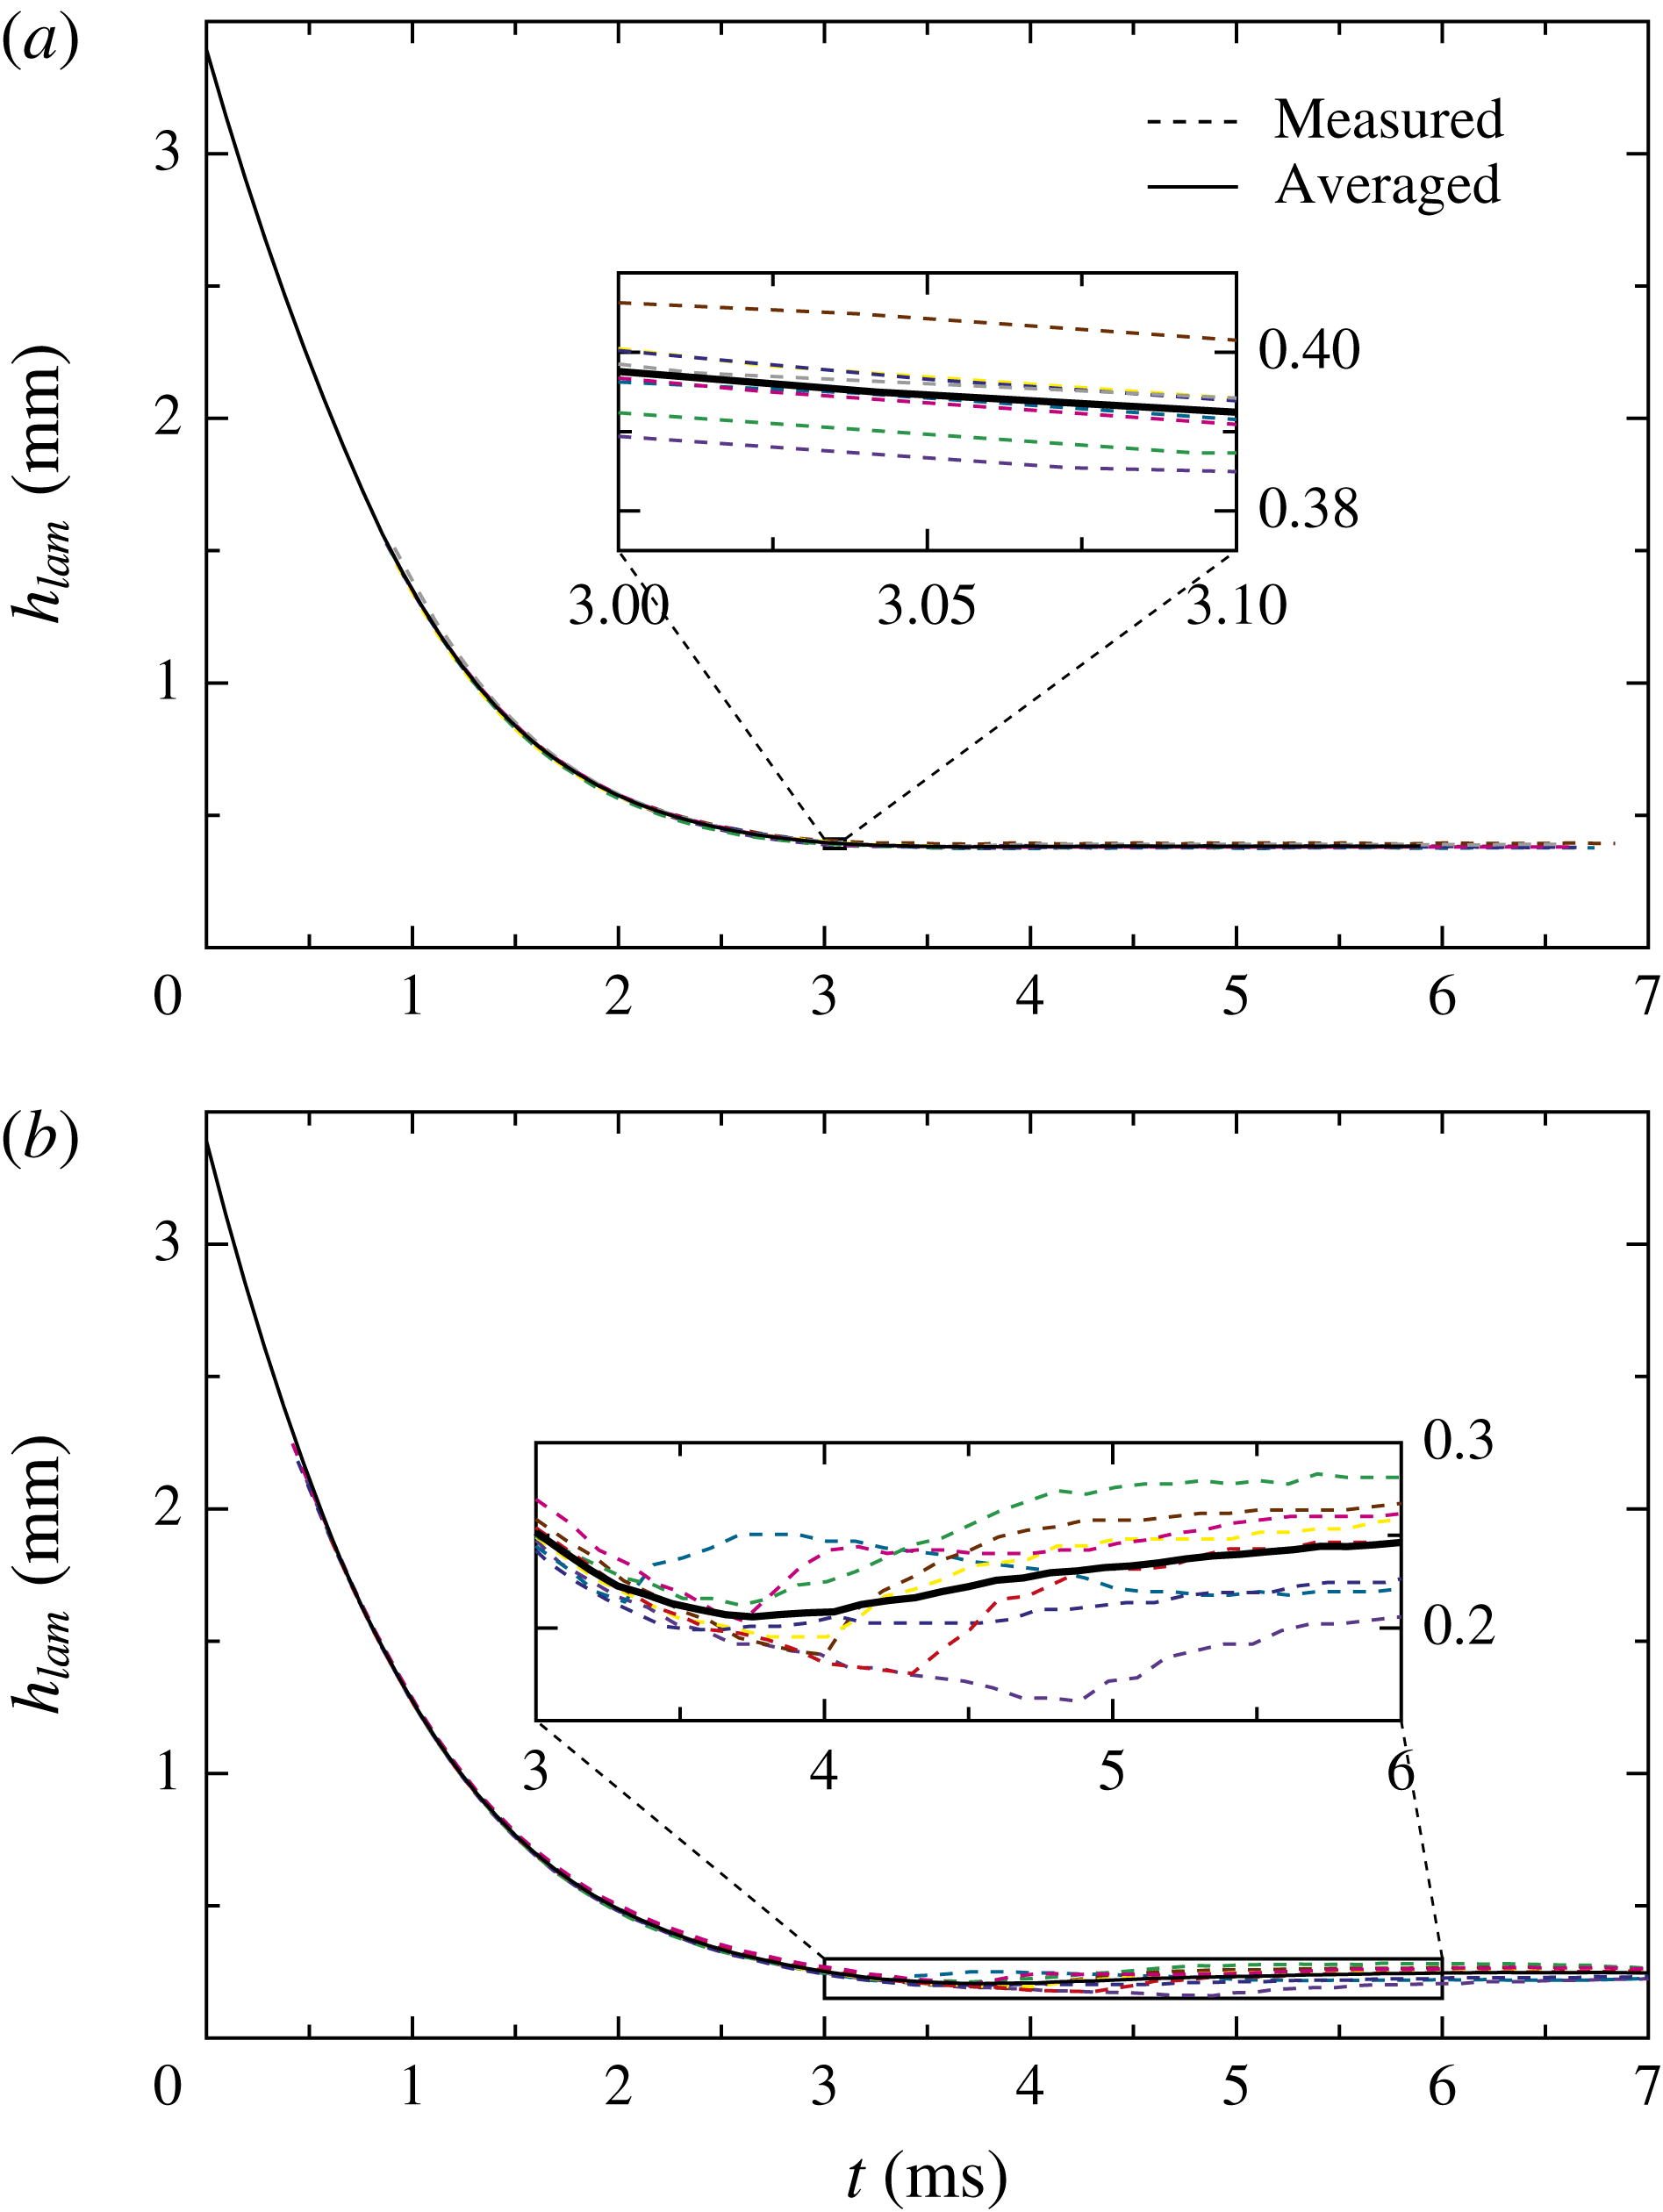
In the case of smaller liquid supercooling,
 $\unicode[STIX]{x0394}T<8~\text{K}$
, the small propagation velocity of the dendrite cloud and resulting capillary waves along the liquid interface cause a higher variation of the lamella thickness measurements, as indicated in figure 7(b). Due to small variations of the morphology of the ice impact surface, the propagation of the capillary wave is not reproducible in the present experiments, as shown in the inset in figure 7(b). The largest variation of the maximum and minimum measured lamella thickness between two different experiments during the propagation of the capillary wave is observed for the smallest investigated supercooling of
 $\unicode[STIX]{x0394}T=6~\text{K}$
and is approximately 56 %. However, the measurement of the final ice layer thickness varies by only 17.4 % for these conditions; which is the maximum relative variation of the final ice layer thickness observed for all experimental conditions. The absolute variation of the measurement of the final thickness is almost constant and in all cases below
 $\pm 21.5~\unicode[STIX]{x03BC}\text{m}$
. Therefore, the measurement of the final ice layer thickness is highly repeatable for all temperatures and the averaged data can be considered as representative of the respective conditions.
4.1 Isothermal drop impact
Without consideration of the phase change process, for impact Reynolds and Weber numbers of
 $Re\gg 25$
and
 $We\gg 2.5$
, the flow in the spreading lamella of an impacting drop is dominated by inertia; viscous and surface tension effects do not play a role (Roisman et al.
Reference Roisman, Berberović and Tropea2009). Thus, for a certain time during the initial impact period, the rear part of the impacting drop moves similar to a rigid body with the initial impact velocity. Accordingly, the lamella thickness at the centre of impact, i.e. at the radial position
 $r=0$
, in the period
 $t<0.4\,d_{d}/v_{d}$
can be described as
 $$\begin{eqnarray}\displaystyle h_{lam}(t,r=0)=d_{d}-v_{d}t. & & \displaystyle\end{eqnarray}$$
For later times
 $t>0.7d_{d}/v_{d}$
, the inviscid solution for the flow in a spreading drop (Yarin & Weiss Reference Yarin and Weiss1995; Roisman et al.
Reference Roisman, Berberović and Tropea2009) results in expressions for the radial velocity of the lamella flow and the lamella thickness as
 $$\begin{eqnarray}\displaystyle u_{r}(t,r)=r\left(\frac{d_{d}}{v_{d}}\unicode[STIX]{x1D70F}+t\right)^{-1},\quad h_{lam}(t,r=0)=\unicode[STIX]{x1D702}d_{d}\left(\unicode[STIX]{x1D70F}+\frac{v_{d}}{d_{d}}t\right)^{-2}, & & \displaystyle\end{eqnarray}$$
where the dimensionless constants have been obtained in Roisman et al. (Reference Roisman, Berberović and Tropea2009) as
 $\unicode[STIX]{x1D702}\approx 0.39$
and
 $\unicode[STIX]{x1D70F}\approx 0.25$
. Later, these expressions were modified to account for the influence of the expanding viscous boundary layer on the flow in the thinning lamella (Roisman Reference Roisman2009). Equations (4.1) and (4.2) are part of a universal solution for the flow in the lamella of a spreading drop, which is valid for all impact conditions in the aforementioned ranges of
 $Re$
and
 $We$
. Both the Reynolds and Weber number in the present study are well above these thresholds and therefore, equation (4.1) and (4.2) serve as a reference for the experimental results concerning lamella thinning.
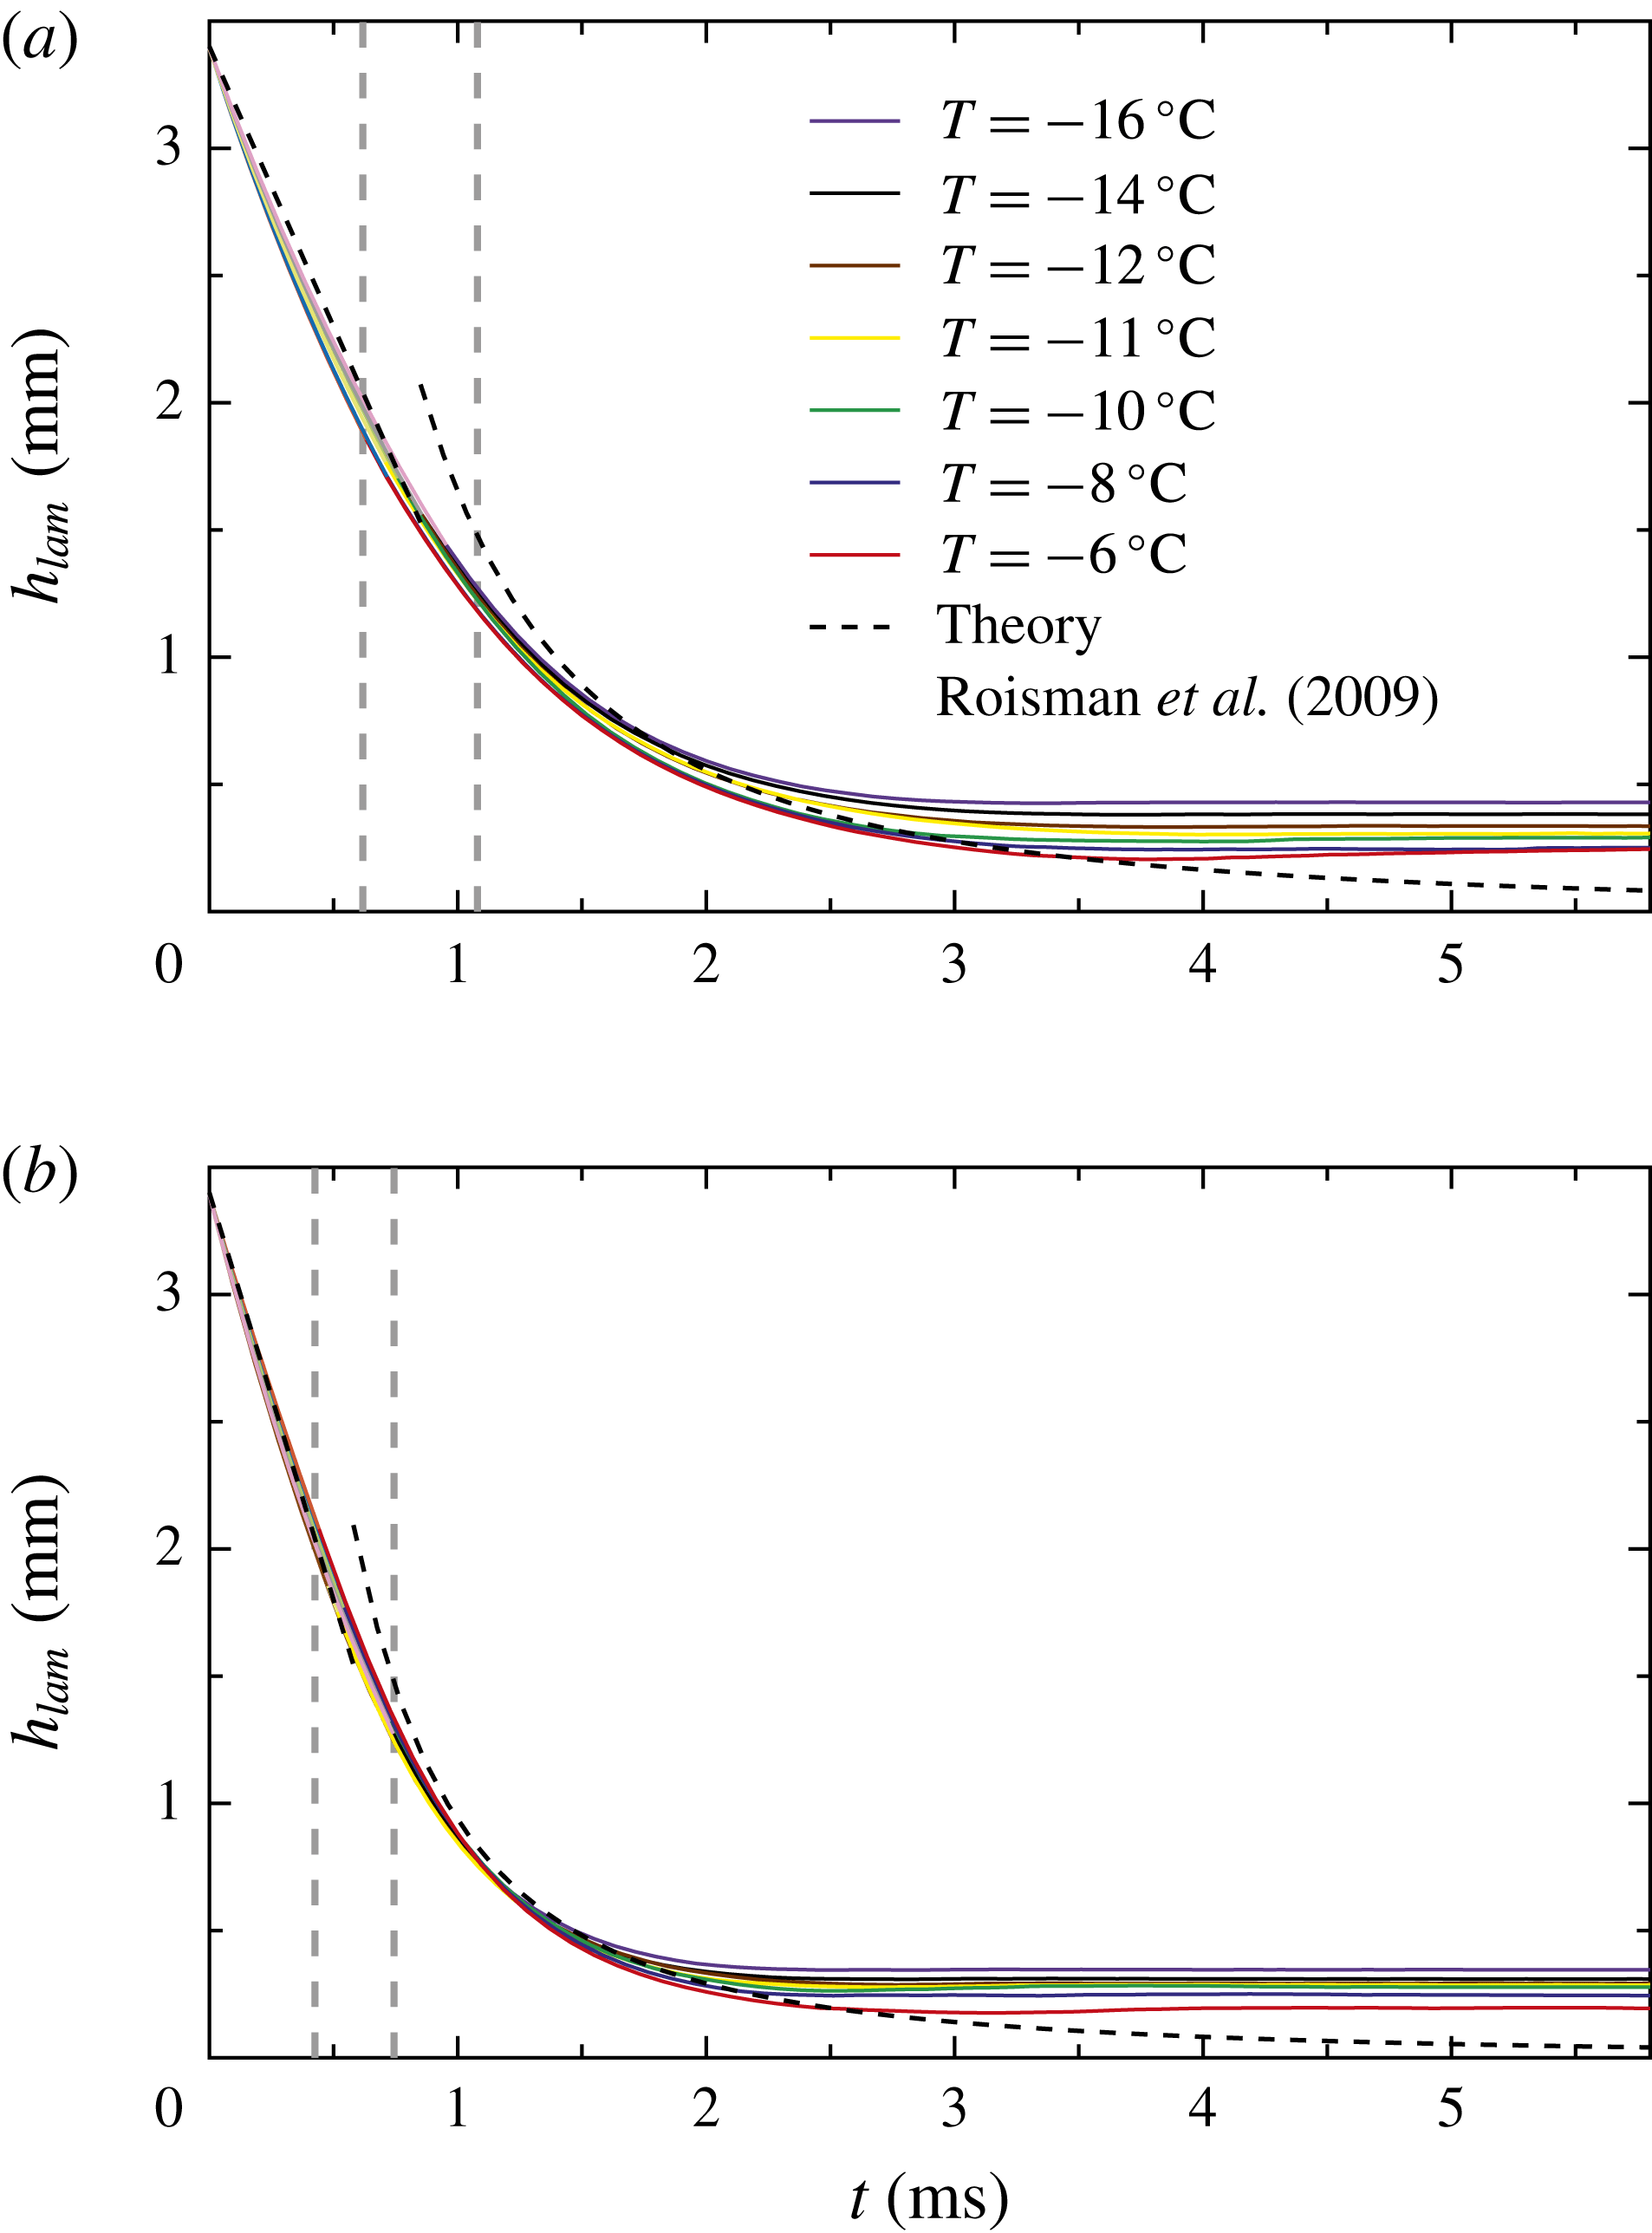
Figure 8 shows the temporal evolution of the lamella thickness for the low (figure 8
a) and the high impact velocity (figure 8
b), where the initial drop and surface temperature are equal in all cases. For comparison, the evolution of the lamella thickness calculated with (4.1) and (4.2) is also shown in the figures. These relations are valid in the ranges
 $t<0.62~\text{ms}$
and
 $t>1.08~\text{ms}$
for the small impact velocity, and
 $t<0.43~\text{ms}$
and
 $t>0.74~\text{ms}$
for the high impact velocity, respectively, which is indicated by means of the dashed vertical lines in the figures.
Temporal evolution of the lamella thickness during isothermal drop impact with an impact velocity of (a)
 $v_{d}=2.2~\text{m}~\text{s}^{-1}$
and (b)
 $v_{d}=3.2~\text{m}~\text{s}^{-1}$
. The dashed black lines are theoretical predictions according to (4.1) and (4.2), with the corresponding limits of validity represented by vertical dashed grey lines (Roisman et al.
Reference Roisman, Berberović and Tropea2009). Data are taken from Tropea et al. (Reference Tropea, Schremb and Roisman2017).
It should be mentioned here that the data shown for the early phase of drop impact have been interpolated from the measured data using a cubic polynomial and
 $h_{lam}(t=0)=d_{d}$
. Nevertheless, the model assuming a constant decrease of the lamella thickness (4.1) is in good agreement with the interpolated data, indicating that the velocity of the rear part of the impacting drops does not significantly change during this phase.
The viscosity of water varies in the range
 $\unicode[STIX]{x1D708}=2.25\ldots 3.51~\text{m}^{2}~\text{s}^{-1}$
in the investigated temperature range, which potentially could influence the impact process. However, for the ranges of the Reynolds and Weber numbers in the present study, inertia dominates the impact process; viscous and surface tension effects can be neglected. Accordingly, the lamella thickness is only slightly influenced by the different temperatures for
 $t<1.5~\text{ms}$
. Moreover, up to
 $t\approx 3.5~\text{ms}$
for the small impact velocity and up to
 $t\approx 2.5~\text{ms}$
for the high impact velocity, the theoretical prediction is in good agreement with the experimental data for the smallest supercooling. For this temperature no propagation of a cloud of dendrites, but the growth of single dendrites has been observed in earlier studies (Schremb & Tropea Reference Schremb and Tropea2016; Schremb et al.
Reference Schremb, Campbell, Christenson and Tropea2017b
). Due to the small supercooling, their growth rate is rather small and therefore, the lamella thinning is almost unaffected by the growing dendrites as implied by the good agreement between the theory and the experimental results. For the smallest supercooling, the capillary wave propagating along the upper lamella interface leads to a temporary rise of the measured lamella thickness for
 $t>3.7~\text{ms}$
in the case of the small impact velocity and for
 $t>3.0~\text{ms}$
in the case of the high impact velocity. However, the thickness increase due to the capillary wave is less pronounced in the case of the higher impact velocity.
For long times after impact, when the thickness of the lamella is of the order of the viscous boundary layer thickness in a spreading drop without phase change, equation (4.2) is no longer valid since viscosity damps the flow in the lamella. In the absence of solidification, the residual lamella thickness after drop impact is (Roisman Reference Roisman2009)
 $$\begin{eqnarray}\displaystyle h_{lam}(t\rightarrow \infty ,r=0)=0.79d_{d}\,\text{Re}^{-2/5}. & & \displaystyle\end{eqnarray}$$
For the present study, equation (4.3) predicts a residual lamella thickness of approximately 100
 $\unicode[STIX]{x03BC}$
m. This is much smaller than the residual thicknesses experimentally observed, indicating the dominant influence of solidification on the flow in the spreading lamella. As shown in figure 8 for both impact velocities, a decreasing temperature causes a decreasing speed of lamella thinning and results in a larger final ice layer thickness. The growth rate of the dendrite cloud increases with lower temperatures and causes an increasing influence of the phase change on the flow in the spreading drop due to a faster decrease of the flow cross section in the lamella.
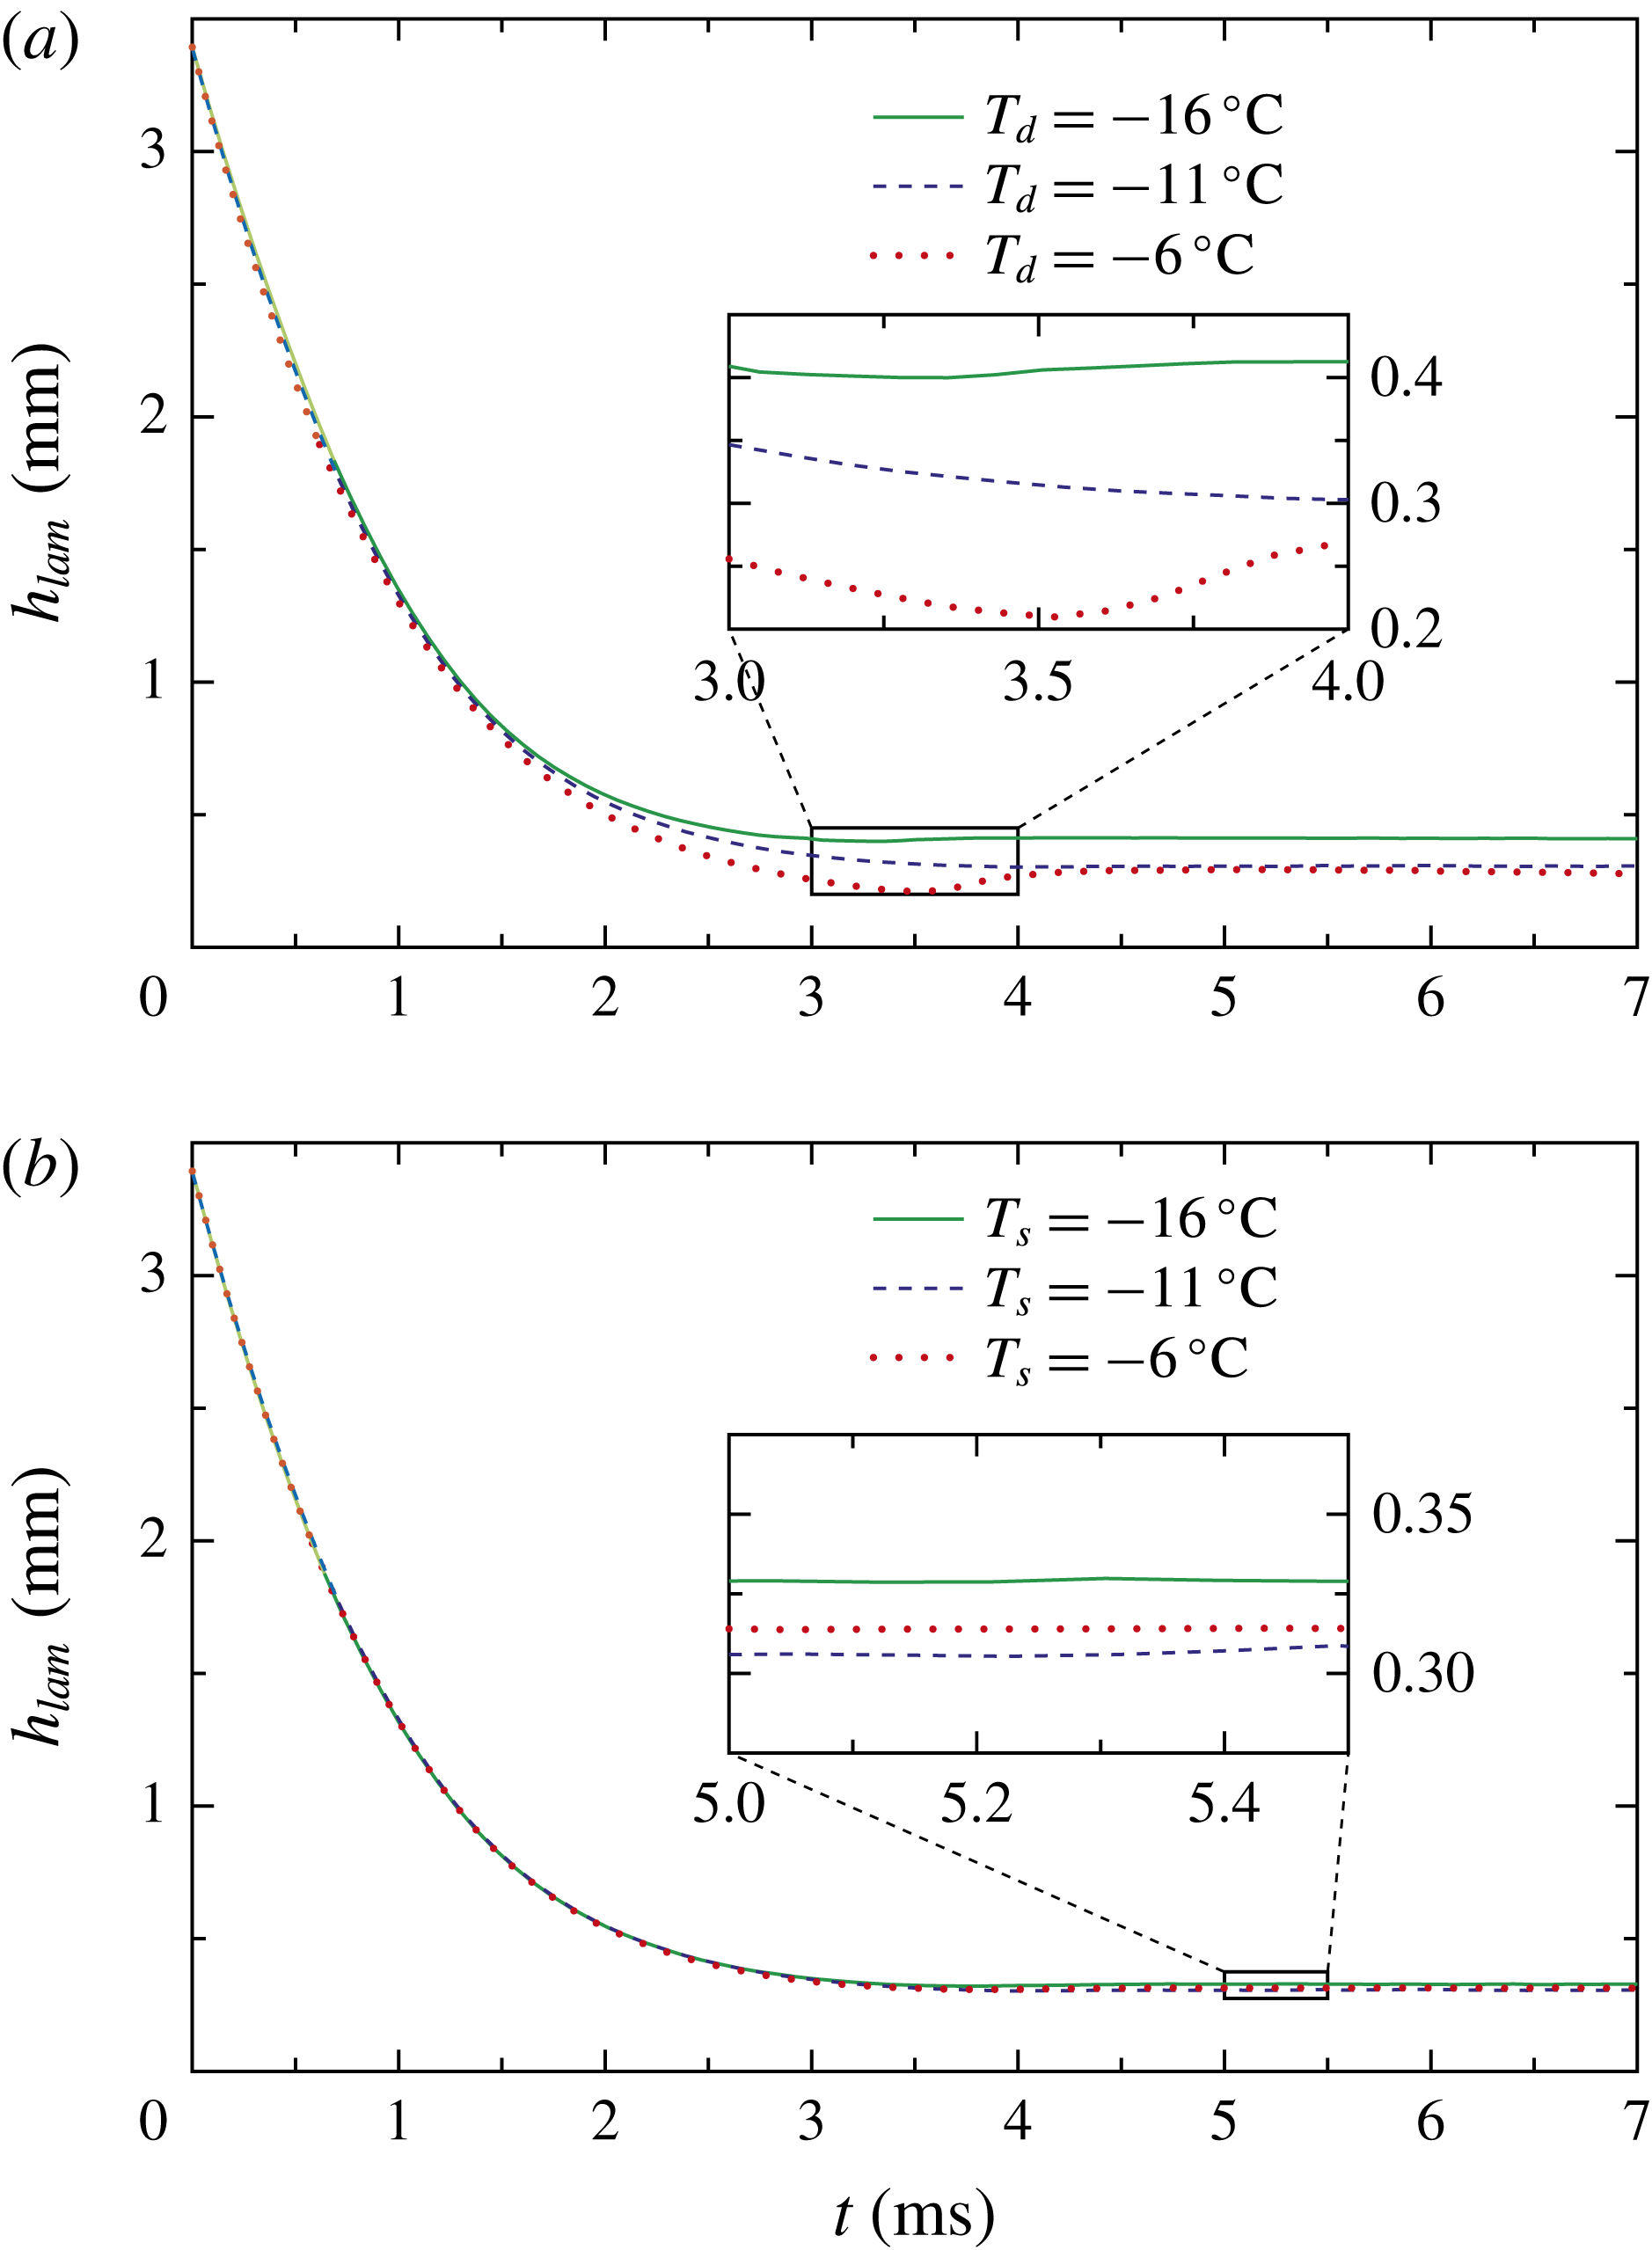
Temporal evolution of the lamella thickness during drop impact depending on the initial drop temperature and surface temperature. The drop impact velocity is
 $v_{d}=2.2~\text{m}~\text{s}^{-1}$
in all cases. (a) Varying initial drop temperature and
 $T_{s}=-11\,^{\circ }\text{C}$
. (b) Varying initial substrate temperature and
 $T_{d}=-11\,^{\circ }\text{C}$
.
4.2 Non-isothermal drop impact
During non-isothermal drop impact, heat is transferred between the impacting drop and the impact surface, resulting in a temporal change of the liquid temperature during impact. By affecting the solidification process, the heat transfer could also influence the fluid flow in the spreading lamella. The temporal evolution of the lamella thickness depending on the initial drop and surface temperature is shown in figure 9. While figure 9(a) shows the influence of a varying drop temperature for the case of a constant surface temperature of
 $T_{s}=-11\,^{\circ }\text{C}$
, the influence of a varying surface temperature in the case of a constant drop temperature of
 $T_{d}=-11\,^{\circ }\text{C}$
is shown in figure 9(b).
As shown in figure 9(a), the initial drop temperature has a strong influence on the lamella thinning, which is comparable to the influence of temperature during isothermal drop impact (see figure 8). A capillary wave again results in a pronounced increase of the lamella thickness for
 $T_{d}=-6\,^{\circ }\text{C}$
, as already observed for isothermal drop impact.
As indicated in figure 9(b), no clear correlation can be observed between the temperature of the ice impact surface and the resulting lamella thinning. Moreover, the variation of the lamella thinning is of the order of the measurement accuracy of the present experiments. Concluding, the temperature of the ice impact surface only weakly influences the propagation of the dendrite cloud and, if at all, has a minor influence on the temporal lamella thinning and the resulting ice layer thickness. This fact becomes clear after comparing the physics during non-isothermal drop impact. Thermal boundary layers develop in both the ice impact surface and the impinging liquid. The solidification process of the supercooled liquid may only be influenced by the substrate during the time, when the thickness of the dendrite cloud is of the order of the thickness of the thermal boundary layer in the spreading drop. While the thickness of the dendrite cloud may be estimated as
 $h_{ice}\sim v_{f}t$
, the thickness of the thermal boundary layer in the liquid is
 $h_{bl}\sim \sqrt{\unicode[STIX]{x1D6FC}t}$
. With the propagation velocity of the front of dendrites,
 $v_{f}\sim 10^{-1}~\text{m}~\text{s}^{-1}$
(Schremb & Tropea Reference Schremb and Tropea2016), and the thermal diffusivity of water,
 $\unicode[STIX]{x1D6FC}\sim 10^{-7}~\text{m}^{2}~\text{s}^{-1}$
, the typical time for thermal influences from the substrate on the propagation of the dendrite cloud is very short with
 $t\sim 10^{-2}~\text{ms}$
. Therefore, the thermal influence of the ice impact surface on the dendritic solidification of the spreading drop is negligible over a wide range of impact conditions; especially for those of the present study, where the typical time of drop impact is
 $t^{\ast }=d_{d}/v_{d}\sim 10^{0}~\text{ms}$
. The liquid temperature dominates the solidification process and the thermal influence of the impact surface on the propagation of the dendrite cloud may be neglected. Thus, also the lamella thinning and the resulting ice layer thickness are unaffected by the temperature of the ice impact surface.
5 Theoretical modelling
As shown in the previous sections, the solidification of the spreading drop, which depends on the liquid temperature, drastically influences the lamella thinning and the ice layer thickness resulting from a single drop impact. Taking into account the propagation of the dendrite cloud and the viscous boundary layer developing in the spreading lamella, an upper bound for the final ice layer thickness after the first phase of solidification is derived utilizing the axisymmetry of the problem. The model is based on the assumption that the dendrites in the cloud are strong enough not to be damaged by the flow in the lamella. This assumption is supported by the fact that the yield stress of ice (
 $Y\sim 10$
MPa) is much higher than the stresses associated with drop impact (
 $p\sim \unicode[STIX]{x1D70C}v_{d}^{2}\sim 10^{-3}\ldots 10^{-1}$
MPa).
Furthermore, in this model the thin initial ice layer which grows into the bulk liquid prior to dendritic formation is neglected. This ice layer is very small compared to the drop size (Kong & Liu Reference Kong and Liu2015; Schremb et al. Reference Schremb, Campbell, Christenson and Tropea2017b ) and, from the results of the present study, the thickness of the initial ice layer can also be estimated as very small compared to the resulting final ice layer thickness. Therefore, the contribution of the initial ice layer growth to the final ice layer thickness is negligible and dendritic solidification is assumed as the dominating mechanism for the lamella freezing.
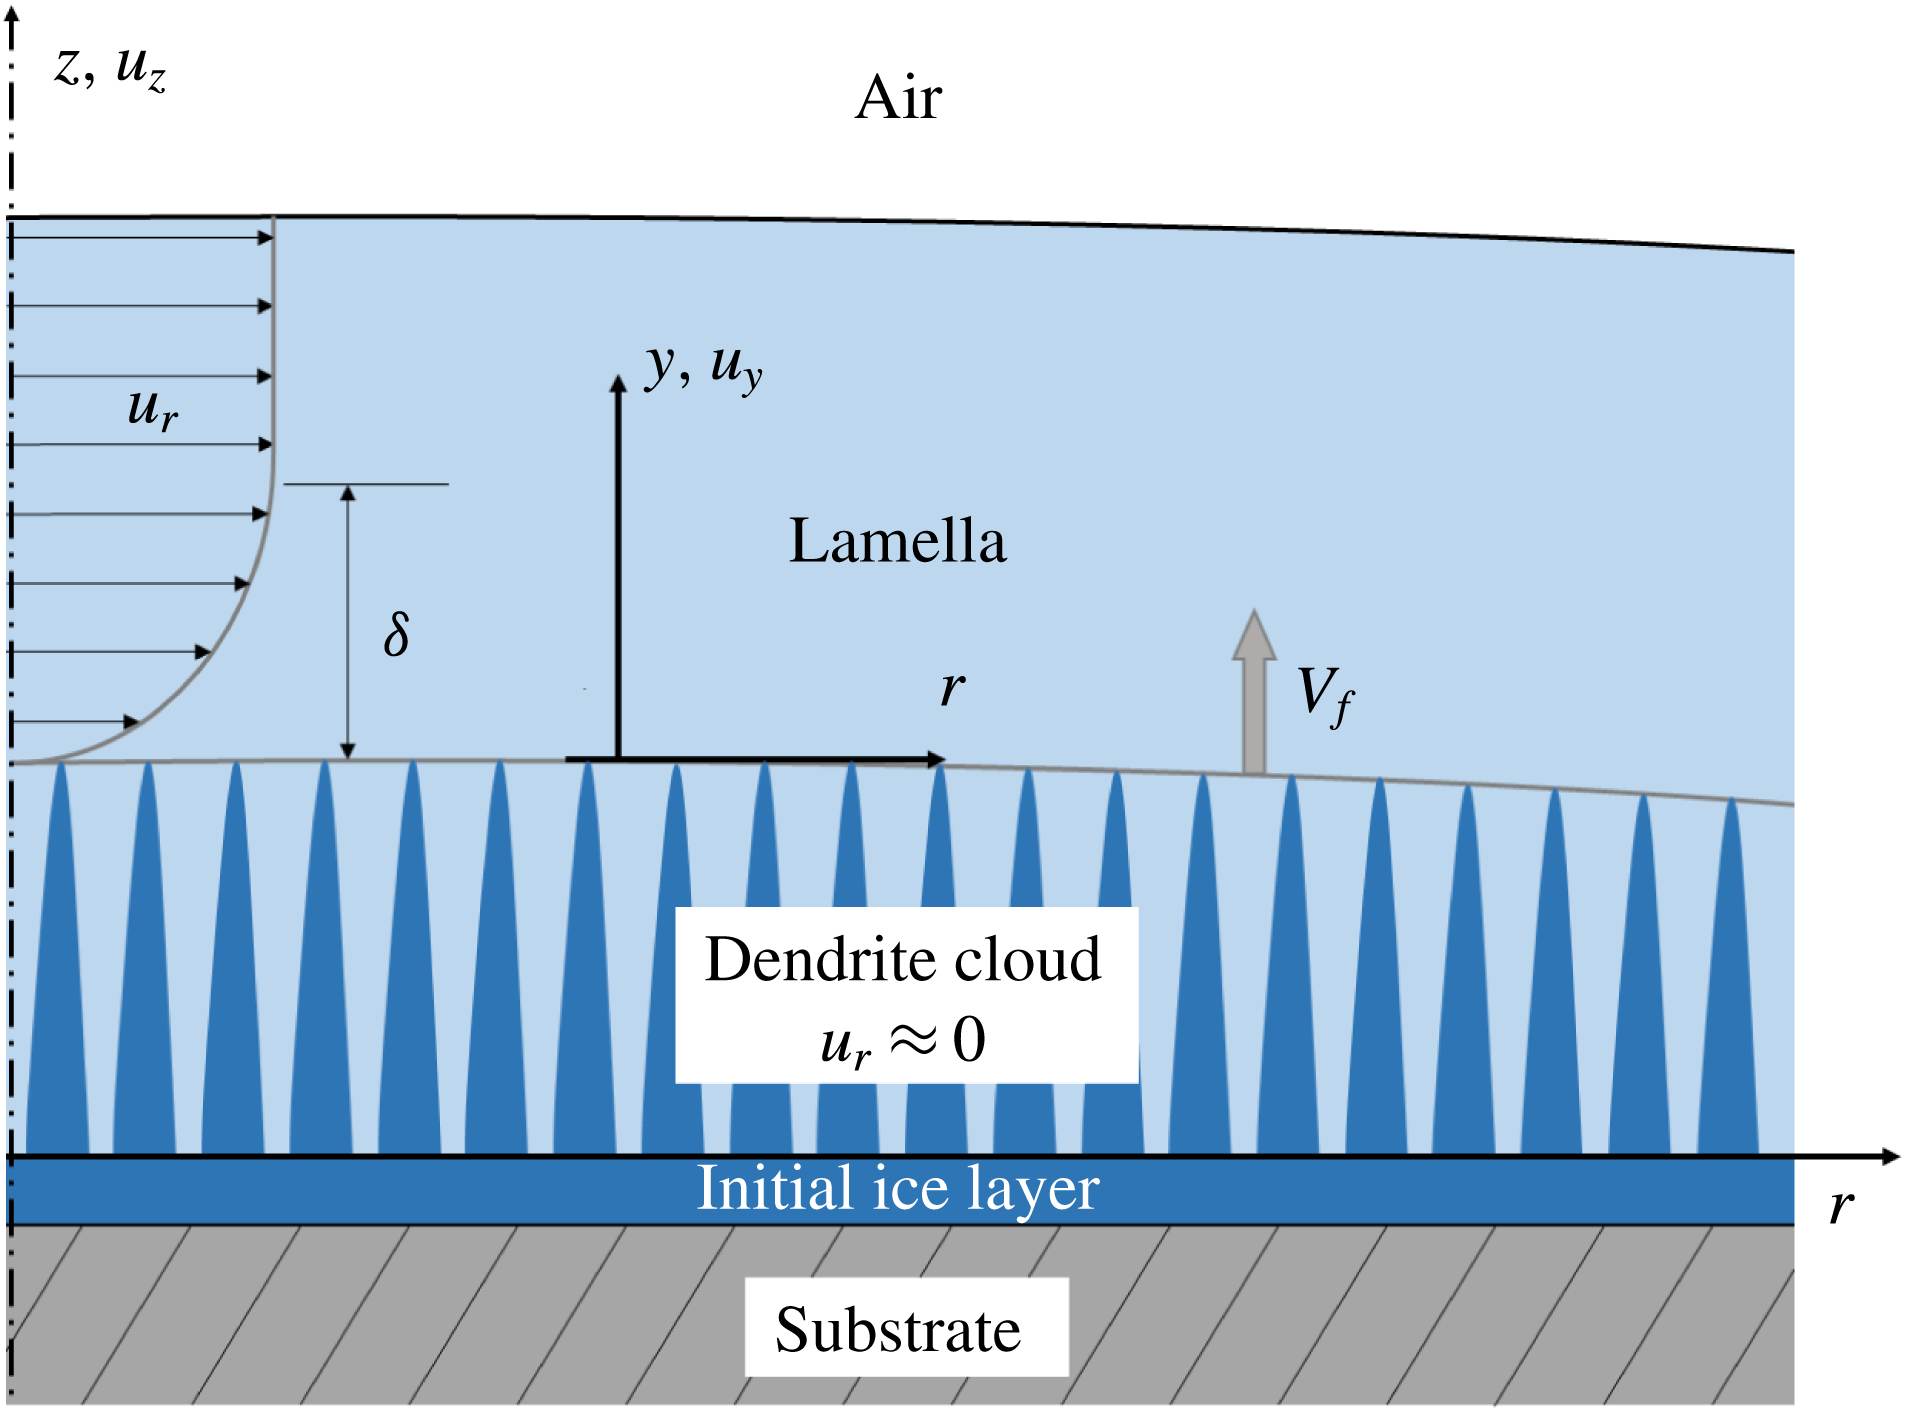
The upper bound for the lamella thickness in this situation can be evaluated assuming that the velocity of the liquid flow in the porous dendrite/liquid cloud is much smaller than the flow in the lamella above the cloud. Moreover, a viscous boundary layer develops at the upper envelope of the expanding dendrite cloud,
 $z=v_{f,z}(t-t^{\prime }(r))$
, where
 $v_{f,z}$
is the
 $z$
-component of the front velocity of the dendrite cloud and
 $t^{\prime }(r)$
denotes the instant when freezing begins at the radial coordinate
 $r$
, i.e. when the contact line reaches position
 $r$
.
As shown in figure 2, for the case of heterogeneous nucleation on a solid substrate, the cloud of dendrites propagates through the supercooled liquid under a certain angle. According to the explanations in § 3, this angle depends on the ratio between the normal propagation velocity of the dendrite cloud,
 $v_{f}$
, and the horizontal velocity of the initial ice layer,
 $v_{l}$
, which initiates freezing of the bulk liquid. It can be estimated as
 $\sin ^{-1}(v_{f}/v_{l})$
. However, in the case of the present experiments, nucleation does not take place at a single nucleation site. Freezing of the bulk liquid is not initiated by a spreading initial ice layer but by the spreading of the liquid itself. Therefore, the angle between the front of dendrites and the ice impact surface depends on the ratio of the propagation velocity of the dendrite cloud and the contact line velocity of the spreading drop,
 $v_{cl}$
. The mean contact line velocity during spreading on the ice impact target, is estimated from figure 5 to be of the order of
 $10~\text{m}~\text{s}^{-1}$
and the front velocity of the dendrite cloud is of the order of
 $10^{-1}~\text{m}~\text{s}^{-1}$
(Schremb & Tropea Reference Schremb and Tropea2016). Accordingly, the spreading of the impinging drop is much larger than the dendrite cloud velocity and the angle between the dendrite front and the impact surface is negligible small,
 $\sin ^{-1}(v_{f}/v_{cl})\approx 0.57^{\circ }$
. This justifies neglecting the exact orientation of the dendrite cloud and to assume that the cloud propagates normally to the impact surface,
 $v_{f,z}\approx v_{f}$
.
The velocity field in the liquid lamella above the dendrite cloud satisfies the continuity equation, the momentum equation and the boundary conditions
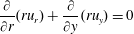 $$\begin{eqnarray}\displaystyle & \displaystyle \frac{\unicode[STIX]{x2202}}{\unicode[STIX]{x2202}r}(ru_{r})+\frac{\unicode[STIX]{x2202}}{\unicode[STIX]{x2202}y}(ru_{y})=0 & \displaystyle\end{eqnarray}$$
 $$\begin{eqnarray}\displaystyle & \displaystyle r\frac{\unicode[STIX]{x2202}u_{r}(r,y,t)}{\unicode[STIX]{x2202}t}+\frac{\unicode[STIX]{x2202}}{\unicode[STIX]{x2202}r}(ru_{r}^{2})+\frac{\unicode[STIX]{x2202}}{\unicode[STIX]{x2202}y}(ru_{r}u_{y})=r\unicode[STIX]{x1D708}\frac{\unicode[STIX]{x2202}^{2}u_{r}}{\unicode[STIX]{x2202}y^{2}} & \displaystyle\end{eqnarray}$$
 $$\begin{eqnarray}\displaystyle u_{r}=0,\quad u_{y}=-\unicode[STIX]{x1D710}_{f},\quad \text{at}~y=0, & & \displaystyle\end{eqnarray}$$
where
 $y=z-\unicode[STIX]{x1D710}_{f}(t-t^{\prime }(r))$
is the vertical coordinate in a moving coordinate system fixed at the envelope of the dendrite cloud and
 $u_{y}=u_{z}-v_{f}$
is the normal component of the velocity relative to the propagating dendrite front. The situation is pictured in figure 10, showing also the
 $y$
-coordinate with respect to the laboratory coordinate system fixed at the surface of the initial ice layer (
 $r,z$
).
Schematic illustration of the axisymmetric lamella spreading during propagation of the dendrite cloud, and the coordinate systems used for modelling the boundary layer development above the dendrite cloud.
The momentum equation (5.2) can be written in the integral form
 $$\begin{eqnarray}\lim _{\unicode[STIX]{x1D712}\rightarrow \infty }\left\{\int _{0}^{\unicode[STIX]{x1D712}}\left[r\frac{\unicode[STIX]{x2202}u_{r}(r,y,t)}{\unicode[STIX]{x2202}t}+\frac{\unicode[STIX]{x2202}}{\unicode[STIX]{x2202}r}(ru_{r}^{2})\right]\text{d}y+ru_{r}(r,\unicode[STIX]{x1D712},t)u_{y}(r,\unicode[STIX]{x1D712},t)\right\}+r\unicode[STIX]{x1D708}\frac{\unicode[STIX]{x2202}u_{r}}{\unicode[STIX]{x2202}y}_{|y\rightarrow 0}=0.\end{eqnarray}$$
In order to find an approximate solution which satisfies the momentum equation in an integral sense the radial component of the flow velocity is assumed to take the form
 $$\begin{eqnarray}\displaystyle u_{r}=\frac{r}{t}\left(1-\exp \left[-\frac{y}{s(t)}\right]\right), & & \displaystyle\end{eqnarray}$$
which fulfils the no-slip conditions at the dendrite front and approaches the inviscid solution (4.2) at large distances
 $y\gg s(t)$
. The function
 $s(t)$
is associated with the temporal evolution of the viscous boundary layer thickness, and is determined below. The exponential form (5.5) is associated with the exact steady solution valid for very large times.
We assume that the constant
 $\unicode[STIX]{x1D70F}$
in (4.2) can be neglected for large times after impact. The corresponding axial component of the relative velocity is found from the continuity equation as
 $$\begin{eqnarray}\displaystyle u_{y}=2\frac{s(t)}{t}\left(-\frac{y}{s(t)}+1-\exp \left[-\frac{y}{s(t)}\right]\right)-\unicode[STIX]{x1D710}_{f}. & & \displaystyle\end{eqnarray}$$
Substituting the assumed components of the velocity field (5.5) and (5.6) into (5.4) yields an ordinary differential equation for the function
 $s(t)$
as
 $$\begin{eqnarray}\displaystyle 2ts(s^{\prime }+\unicode[STIX]{x1D710}_{f})+3s^{2}-2\unicode[STIX]{x1D708}t=0. & & \displaystyle\end{eqnarray}$$
This equation can be rewritten in dimensionless form
 $$\begin{eqnarray}\displaystyle 2\unicode[STIX]{x1D709}\unicode[STIX]{x1D6FF}(\unicode[STIX]{x1D6FF}^{\prime }+1)+3\unicode[STIX]{x1D6FF}^{2}-2\unicode[STIX]{x1D709}=0, & & \displaystyle\end{eqnarray}$$
where the dimensionless time and dimensionless boundary layer thickness are defined as
 $$\begin{eqnarray}\displaystyle \unicode[STIX]{x1D709}=\frac{tv_{f}^{2}}{\unicode[STIX]{x1D708}},\quad \unicode[STIX]{x1D6FF}(\unicode[STIX]{x1D709})=\frac{sv_{f}}{\unicode[STIX]{x1D708}}, & & \displaystyle\end{eqnarray}$$
respectively. The ordinary differential equation (5.8) can be solved numerically. The solution is then used for the description of the flow field in the spreading lamella and the derivation of the expression for the evolution of the lamella height above the rising dendrite cloud.
Since the spreading velocity of a drop is usually much larger than the velocity of solidification, the term
 $t^{\prime }(r)$
, which is the inverse function of the spreading radius
 $R(t)$
, influences the solution only in a small region near the spreading rim. This assumption is confirmed by a nearly flat ice layer, observed in the experiments. Therefore, in the major area of the wetted spot,
 $r\ll R$
, the term
 $t^{\prime }(r)$
can be neglected and the axial velocity can be assumed to be only a function of the axial coordinate.
The axial velocity of the liquid, excluding the region in the vicinity of the rim, outside the boundary layer (in the limit
 $y\gg s$
) in the reference frame fixed at the wall can be approximated from (5.6) as
 $$\begin{eqnarray}\displaystyle u_{z}=2\frac{s(t)}{t}\left(-\frac{z-v_{f}t}{s(t)}+1\right). & & \displaystyle\end{eqnarray}$$
Now the evolution of the lamella thickness in the presence of the growing ice layer is obtained as a root of the ordinary differential equation
 $u_{z}=\text{d}h_{lam}/\text{d}t$
to
 $$\begin{eqnarray}\displaystyle h_{lam}=\frac{\unicode[STIX]{x1D702}d_{d}^{3}}{v_{d}^{2}t^{2}}+\frac{2v_{f}t}{3}+\frac{2}{t^{2}}\int _{0}^{t}\unicode[STIX]{x1D701}s(\unicode[STIX]{x1D701})\,\text{d}\unicode[STIX]{x1D701}. & & \displaystyle\end{eqnarray}$$
The instant
 $t^{\ast }$
at which the boundary layer of thickness
 $y\sim 3s$
reaches the upper free surface of the lamella is determined from the condition
 $h_{lam}(t^{\ast })=v_{f}t^{\ast }+3s(t^{\ast })$
, which can be rewritten in the dimensionless form
 $$\begin{eqnarray}\displaystyle \frac{\unicode[STIX]{x1D709}^{\ast 3}}{3}+3\unicode[STIX]{x1D709}^{\ast 2}\unicode[STIX]{x1D6FF}(\unicode[STIX]{x1D709}^{\ast })-2\int _{0}^{\unicode[STIX]{x1D709}^{\ast }}\unicode[STIX]{x1D709}\unicode[STIX]{x1D6FF}(\unicode[STIX]{x1D709})\,\text{d}\unicode[STIX]{x1D709}=P,\quad P\equiv \frac{d_{d}^{3}\unicode[STIX]{x1D702}v_{f}^{5}}{\unicode[STIX]{x1D708}^{3}v_{d}^{2}}. & & \displaystyle\end{eqnarray}$$
The factor 3 is chosen as the condition for which the boundary layer reaches the upper surface of the lamella, i.e. the
 $y$
position where the velocity attains
 $1-\exp (-3)\approx 0.95$
of the outer flow velocity. This represents an upper bound for the residual ice layer thickness. At times
 $t>t^{\ast }$
the flow in the lamella is quickly damped by viscosity, resulting in only minor further lamella thinning. Therefore, the thickness
 $$\begin{eqnarray}\displaystyle h^{\ast }\approx [\unicode[STIX]{x1D709}^{\ast }+3\unicode[STIX]{x1D6FF}(\unicode[STIX]{x1D709}^{\ast })]\frac{\unicode[STIX]{x1D708}}{v_{f}} & & \displaystyle\end{eqnarray}$$
can be considered as an upper bound for the final ice layer thickness, where
 $\unicode[STIX]{x1D709}^{\ast }(P)$
can be computed from (5.12) using the solution for
 $\unicode[STIX]{x1D6FF}(\unicode[STIX]{x1D709})$
from (5.8).
Theoretical predictions for the dimensionless lamella thickness resulting from a single drop impact,
 $h^{\ast }v_{f,z}/\unicode[STIX]{x1D708}=\unicode[STIX]{x1D709}^{\ast }+3\unicode[STIX]{x1D6FF}(\unicode[STIX]{x1D709}^{\ast })$
, at the time instant
 $t^{\ast }$
when the viscous boundary layer thickness is equal to the lamella thickness above the dendrite cloud. The dimensionless parameter
 $P$
is defined in (5.12). Comparison of experimental results (symbols) with theoretical predictions (solid line).
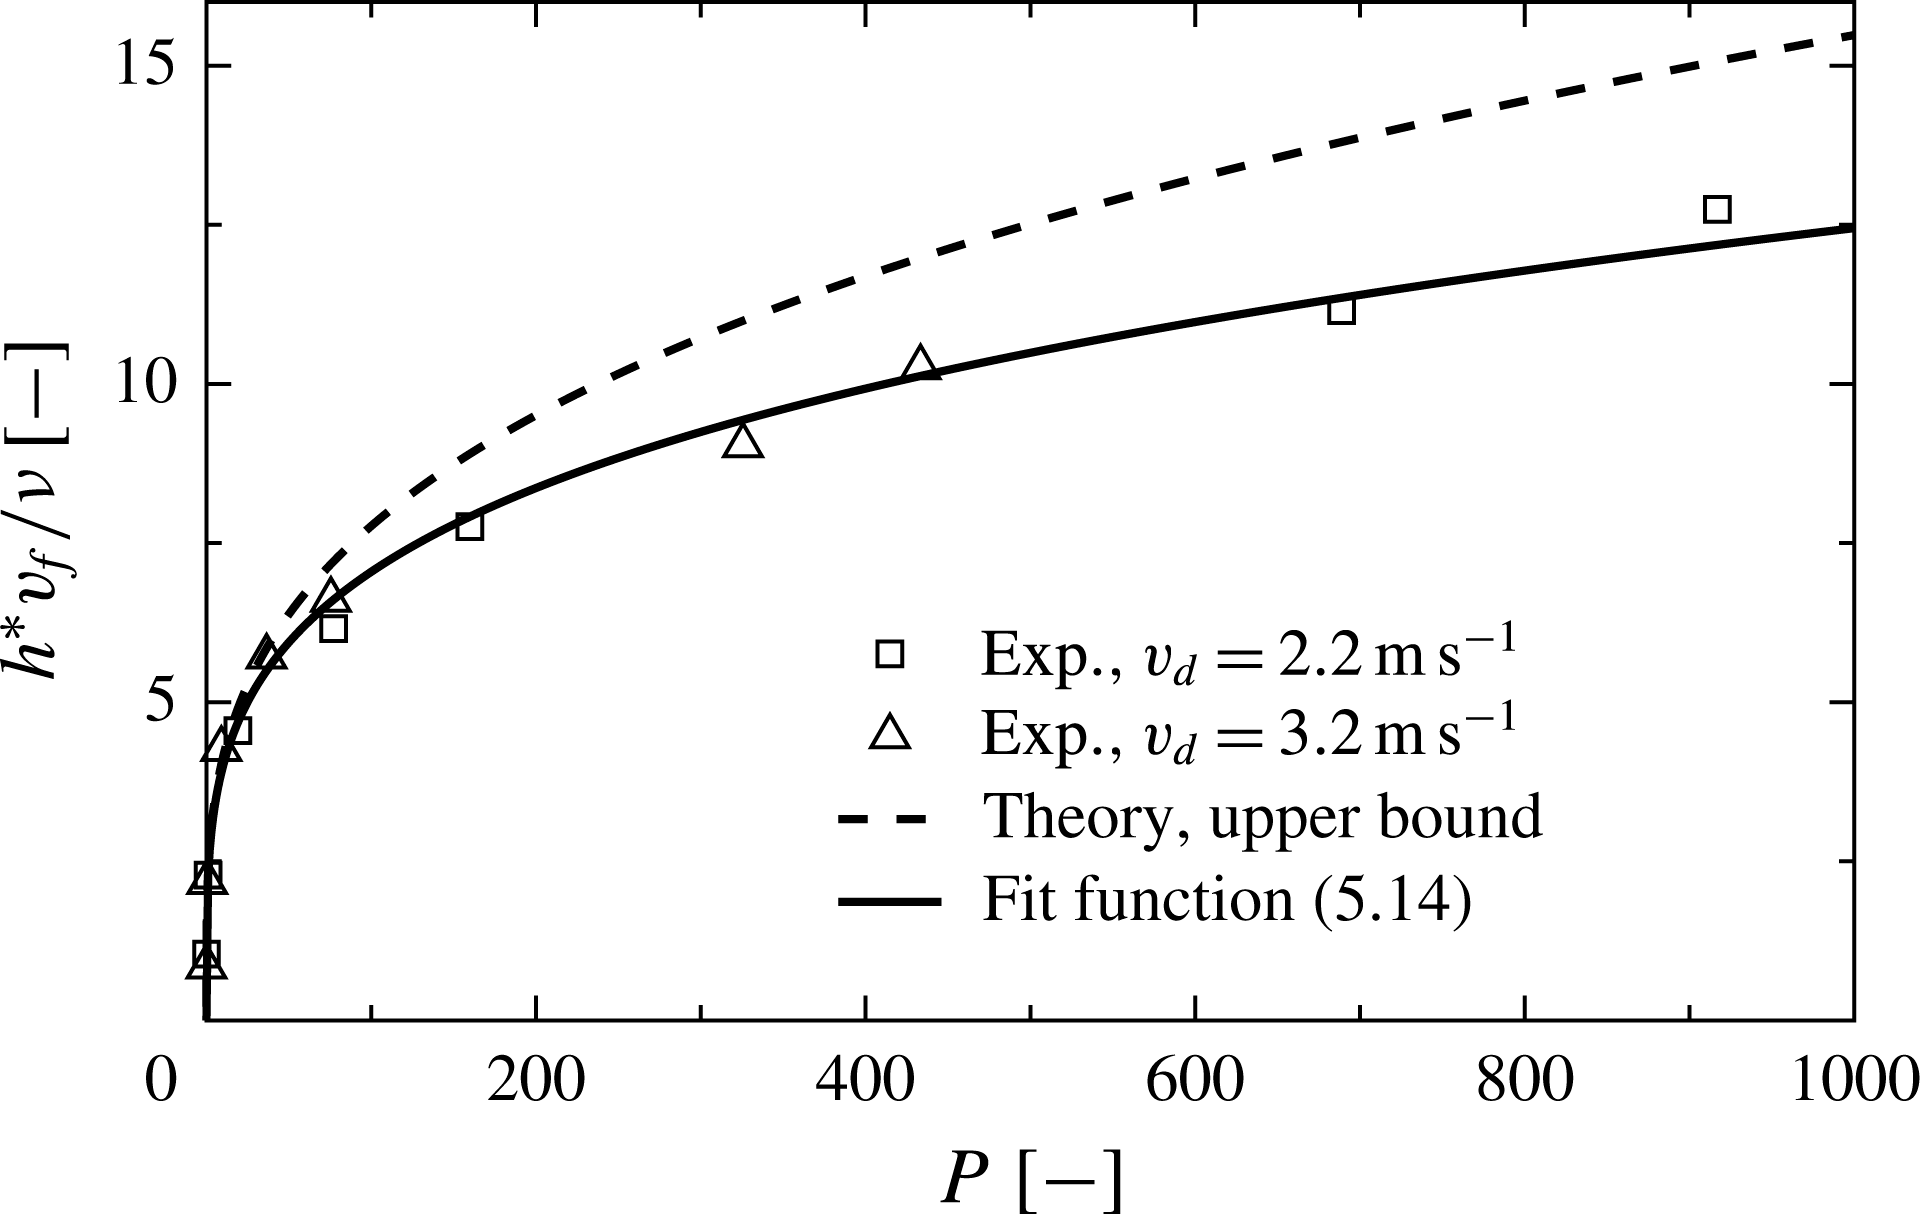
The computed values of the dimensionless thickness
 $h^{\ast }v_{f}/\unicode[STIX]{x1D708}$
are shown in figure 11 as a function of the parameter
 $P$
. For comparison, the experimental results for the final ice layer thickness obtained in the present study are also shown in figure 11. For the calculation of the parameter
 $P$
for the respective impact conditions, the temperature dependence of the kinematic viscosity is taken into account, using literature values (VDI Reference VDI2006). The viscous boundary layer thickness in the spreading drop,
 ${\sim}\sqrt{\unicode[STIX]{x1D708}t}$
, is much larger than the thermal boundary layer thickness,
 ${\sim}\sqrt{\unicode[STIX]{x1D6FC}t}$
, where
 $\unicode[STIX]{x1D6FC}$
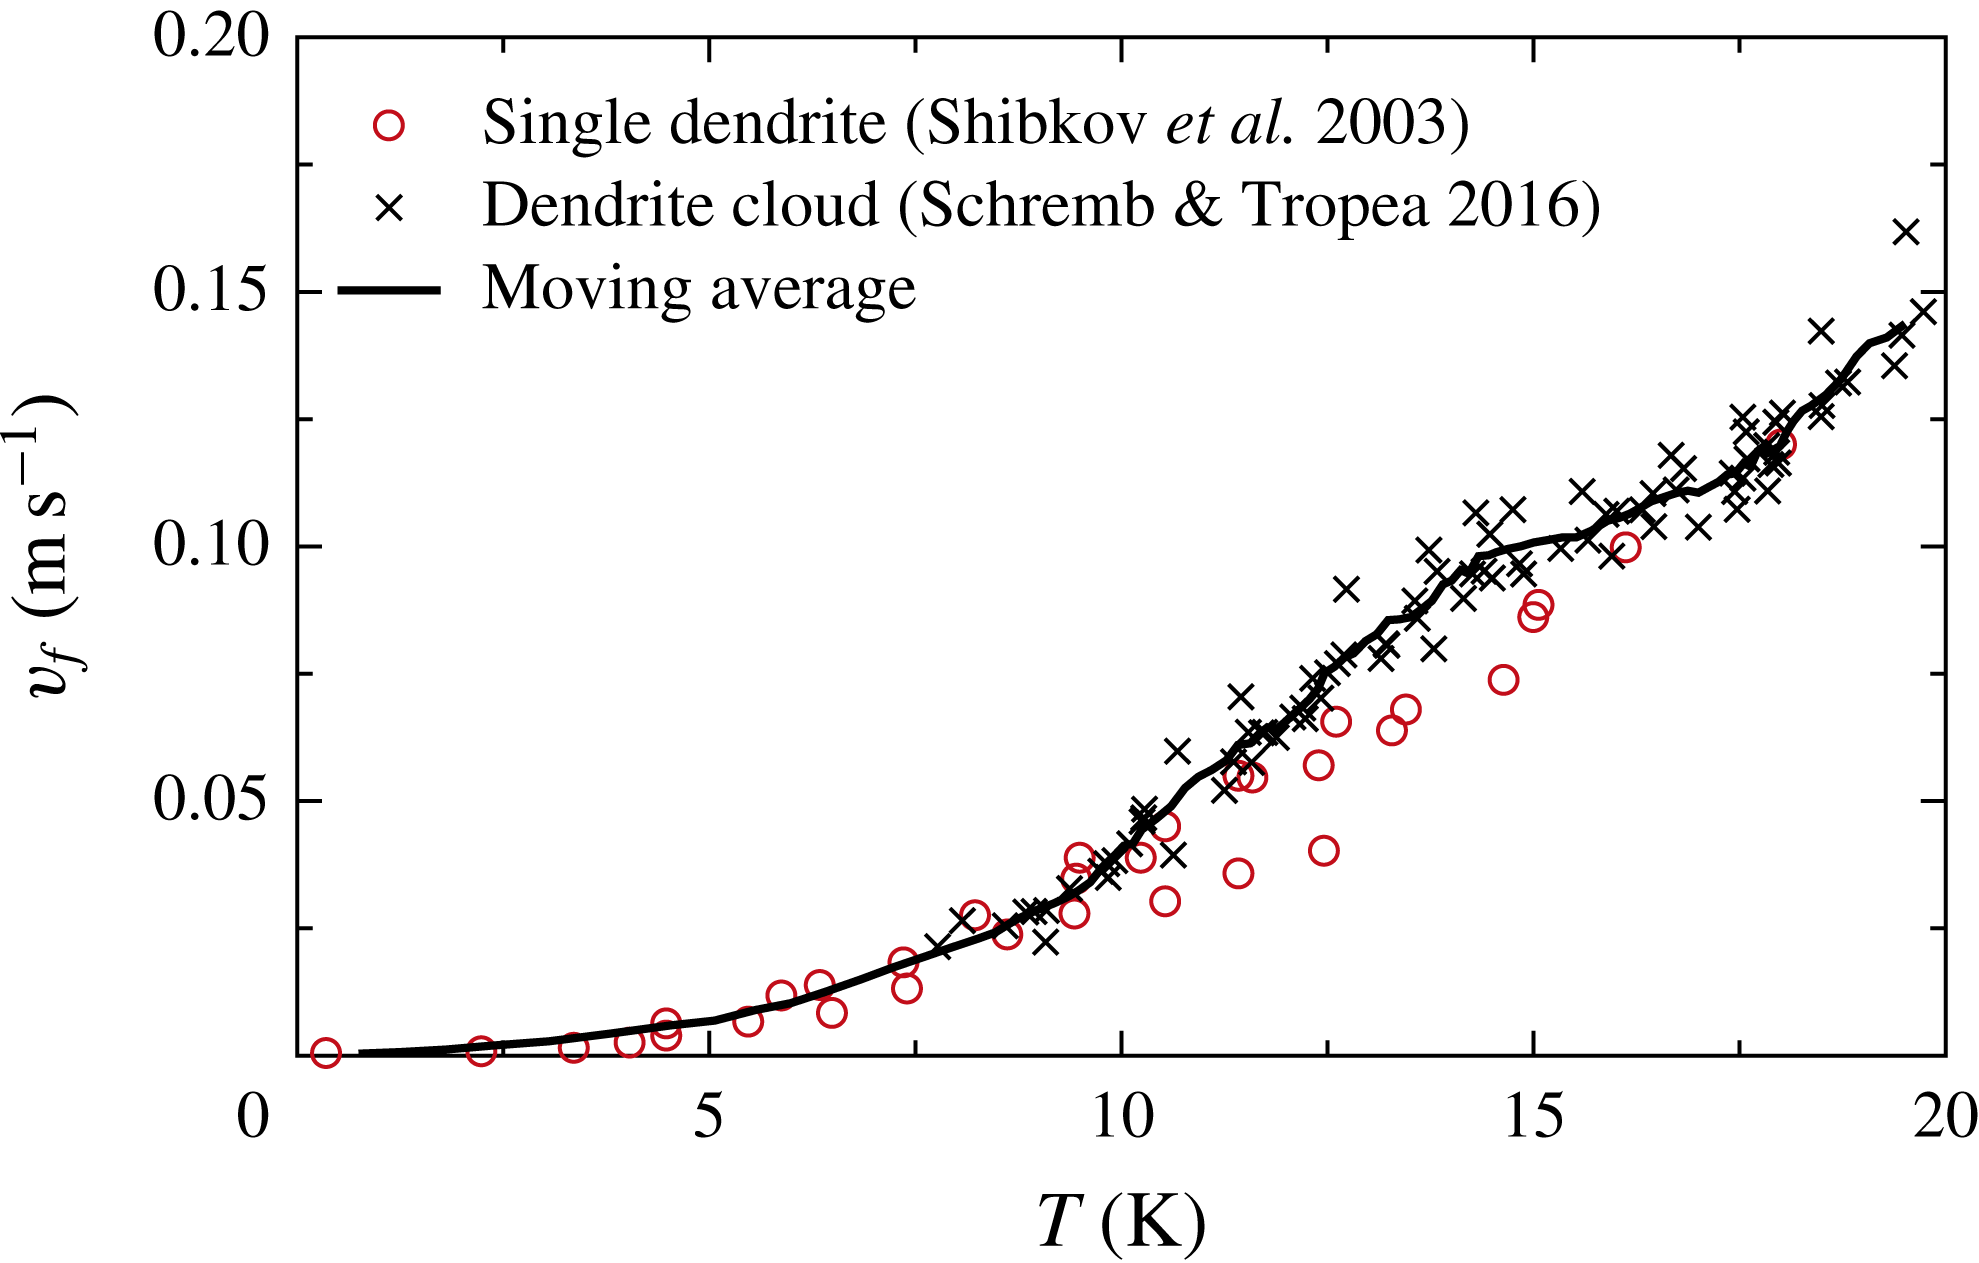
is the thermal diffusivity of the liquid. Therefore, the initial drop temperature is used to determine the liquid viscosity for the respective calculation. Experimental results for the front velocity of a dendrite cloud,
 $v_{f}$
, shown in figure 12 are used for the calculations. Since no functional relation for an adequate description of the data in figure 12 can be found, the calculations are performed using an interpolation of the moving average of the experimental data for
 $v_{f}$
. The moving average is obtained from the data of the velocity of a single dendrite (
 $\unicode[STIX]{x0394}T<9.9~\text{K}$
) and the front velocity of a dendrite cloud (
 $\unicode[STIX]{x0394}T>9.9~\text{K}$
).
Freezing velocity of water depending on supercooling for a single dendrite tip (red circles) and a cloud of dendrites (black crosses). The solid line represents the moving average of the data of the dendrite velocity for
 $\unicode[STIX]{x0394}T<9.9~\text{K}$
from Shibkov et al. (Reference Shibkov, Golovin, Zheltov, Korolev and Leonov2003) and the dendrite cloud velocity for
 $\unicode[STIX]{x0394}T>9.9~\text{K}$
from Schremb & Tropea (Reference Schremb and Tropea2016).
As shown in figure 11, the theoretical predictions for the upper bound of the ice layer thickness are in very good agreement with the experimental results for all impact conditions. However, for larger values of the parameter
 $P$
, representative for larger values of
 $d_{d}$
and
 $v_{f}$
, and smaller values of
 $v_{d}$
, an increasing overestimation of the experimental data can be observed. More important is the fact that the functional scaling of the model is correct, implying that the model accounts for all physical mechanisms taking place during the process. Therefore, it can be concluded that the fluid flow does not affect the propagation of the dendrite cloud; neither by means of breaking of the dendrites due to shear nor by any direct influence on the solidification process. Thus, the experimental data scaled in the proposed way represent a master curve and may be used for the derivation of a semi-empirical relation for the resulting ice layer thickness depending on the impact conditions. Using a power function as the ansatz function, a least squares fit of the experimental data shown in figure 11 results in
 $$\begin{eqnarray}\displaystyle h^{\ast }v_{f,z}/\unicode[STIX]{x1D708}=2.26\left(\frac{d_{d}^{3}\unicode[STIX]{x1D702}v_{f}^{5}}{\unicode[STIX]{x1D708}^{3}v_{d}^{2}}\right)^{0.247}. & & \displaystyle\end{eqnarray}$$
The fit of the experimental data according to the found relation is also shown in figure 11. As shown in the figure the experimental data are well described by the power function for all impact conditions. The good agreement between the theoretical and experimental results confirms the model’s capabilities in predicting the final ice layer thickness after an impact of a supercooled water drop by means of (5.14).
6 Conclusions
In the present study, the normal impact of supercooled water drops on an ice impact surface has been experimentally investigated for the first time. The most important difference between the impact of a supercooled water drop onto a dry solid surface and onto an ice surface is the instant when freezing begins. Nucleation is stochastic in the case of an impact onto a dry solid surface, resulting in varying outcomes of such a drop impact. However, solidification starts simultaneously with the impact process in the case of a drop impact onto ice, which allows reproducible investigation of the mutual influences between fluid flow and solidification during the impact of a supercooled water drop. Beginning at the ice surface, a dendrite cloud grows through the spreading drop in the normal direction to the impact surface. It fixes the momentary shape of the deformed liquid and results in the formation of an ice layer on top of the initial ice surface.
Water drops with temperatures varying between
 $-16$
and
 $-6\,^{\circ }\text{C}$
impinge onto an ice impact surface varying in the same temperature range. Experiments are performed for the case of an equal drop and surface temperature as well as for the case of an initial temperature difference between the drop and the surface. The water drops impact onto an ice surface prepared on top of a small cylindrical target and the impact process is observed in a side view using a high-speed video system. Liquid is ejected from the edge of the ice surface during spreading, preventing the formation of a pronounced rim which would disturb the measurements in the high-speed videos. The temporal evolution of the lamella thinning at the axis of symmetry of the impact has been determined as a representative quantity of the fluid flow in the spreading drop.
The experimental results have been compared with theoretical predictions for the lamella thinning without phase change. It has been shown that the lamella thinning is almost unaffected by temperature during the first phase of drop impact. During later stages of the process, a decreasing liquid temperature causes a decreasing speed of lamella thinning. The larger growth rate of the dendritic layer for lower temperatures results in a faster reduction of the flow cross-section in the lamella, which slows down the lamella spreading due to increased viscous damping. Together with the faster dendritic freezing, which fixes the shape of the spreading liquid, the decreased speed of lamella thinning results in a larger final ice layer thickness for higher supercoolings. It has been shown that the temperature of the ice impact surface has only a negligible influence on lamella thinning and the final ice layer thickness, since it affects the solidification process only in a short period during the begin of spreading. Therefore, the liquid temperature is the dominating parameter determining the final ice layer thickness. A larger impact velocity results in a smaller final ice layer thickness due to an increased speed of lamella thinning.
Based on a mathematical description of the flow in the spreading lamella, a theoretical model for the prediction of the upper bound for the resulting ice layer thickness after a single drop impact has been derived. It accounts for both the increasing thickness of the dendrite cloud and the viscous boundary layer developing in the spreading lamella. A comparison with the present experimental results exhibits very good agreement of the theoretical model for the entire range of the experimental conditions, implying that the model accounts for all relevant mechanisms during the process. By means of the theoretical model, a scaling for the physics during impact and solidification is found, resulting in a unique relation between the impact parameters and the residual ice layer thickness after impact. Therefore, using this scaling, the present experimental results may serve as a master curve for the prediction of the final ice layer thickness depending on the impact parameters. The experimental data are fitted to a power function, allowing an accurate a priori prediction of the final ice layer thickness depending on the impact conditions and liquid temperature. This is therefore useful for the improvement of existing ice accretion models.
Acknowledgements
The authors gratefully acknowledge financial support from the Deutsche Forschungsgemeinschaft within the Collaborative Research Project SFB-TRR 75 (TP-C3). Furthermore, the authors thank T. Webert for his contribution to the experiments.
Supplementary movies
Supplementary movies are available at https://doi.org/10.1017/jfm.2017.797.



