


1. Introduction
Attitudes are central to political life. Individuals hold attitudes—summary evaluations—about policies, candidates, politicians, parties, world views, modes of participation, correct behavior, and even groups of people. Because these attitudes can translate into political behavior (Campbell et al., Reference Campbell, Converse, Miller and Stokes1960; Druckman et al., Reference Druckman, Klar, Krupnikov, Levendusky and Ryan2021; Lewis-Beck et al., Reference Lewis-Beck, Jacoby, Norpoth and Weisberg2008), understanding how they can be changed is especially important.
Attempts to change attitudes can be found across a wide variety of political domains. Campaigns seek to move attitudes in favor of particular candidates to sway election outcomes (Jacobson, Reference Jacobson2015). Interventions designed to reduce partisan animosity seek to foster more positive attitudes toward opposing political parties, thereby supporting democratic engagement (Hartman et al., Reference Hartman, Blakey, Womick, Bail, Finkel, Han, Sarrouf, Schroeder, Sheeran and Van Bavel2022; Voelkel et al., Reference Voelkel, Stagnaro, Chu, Pink, Mernyk, Redekopp, Ghezae, Cashman, Adjodah and Allen2024). Other interventions targeting prejudice aim to warm attitudes toward out-groups, supporting fairer treatment and even reducing inter-group conflict (Broockman and Kalla, Reference Broockman and Kalla2016, Kalla and Broockman, Reference Kalla and Broockman2020, Reference Kalla and Broockman2023; Larson and Lewis, Reference Larson and Lewis2025).
A key feature of attitudes is that they are held socially. Individuals tend to care what attitudes others hold, and they also care what others think of the attitudes that they hold (Cialdini and Goldstein, Reference Cialdini and Goldstein2004). Moreover, people are embedded in rich social networks that structure interactions, provide support, share information, pass judgment, and ultimately influence the attitudes people hold (Granovetter, Reference Granovetter1973; Wellman and Wortley, Reference Wellman and Wortley1990). Consequently, understanding how a person’s attitude might change requires zooming out to the network in which the person is embedded. After a person’s immediate, individual response to a treatment, others in the network can react to her new attitude. These reactions in the network may push against, reinforce, or even spread the new attitude more widely. It is possible, then, that longer-term responses to individual interventions may depend crucially on the social networks in which the targets of the interventions are embedded.
While existing evidence supports the broad view that networks are relevant to the formation of political attitudes (Lazer et al., Reference Lazer, Rubineau, Chetkovich, Katz and Neblo2010; Sinclair, Reference Sinclair2012) and that attitude change does have a social component (Levitan and Verhulst, Reference Levitan and Verhulst2016; Mallinson and Hatemi, Reference Mallinson and Hatemi2018), opportunities to investigate the precise role of networks in attitude change have been rare. Detailed social network information is onerous to collect (Larson and Lewis, Reference Larson and Lewis2020). Online data sources do ease the burden but capture just one slice of a person’s social interactions and for potentially unrepresentative samples (Berinsky et al., Reference Berinsky, Huber and Lenz2012; Bisbee and Larson, Reference Bisbee and Larson2017; Macy and Golder, Reference Macy and Golder2014).
We conducted a field experiment that offers a rare, direct view of the role that networks play in political attitude change. Building on Larson and Lewis (Reference Larson and Lewis2025), we implemented a perspective-taking treatment in the style of Broockman and Kalla (Reference Broockman and Kalla2016) that aimed to warm host attitudes toward refugees. Our study takes place in 16 villages in rural Uganda, an ideal setting for studying attitude change in networks. Attitudes toward refugees are politically salient there and important to study in their own right. A vast majority of the world’s refugees settle in developing countries, Uganda hosts the largest number of refugees in Africa, and the villages were selected to be near refugee-sending borders with South Sudan and the Democratic Republic of Congo (DRC).
Additionally, because daily life is highly localized in villages such as these, we are able to include as respondents a substantial set of the social ties relevant to each person in our study. In other words, we have relatively complete views of the in-person, word-of-mouth networks that are potentially relevant to attitude change. Relatedly, response rates are high and attrition is low, so we have nearly complete measures of the household networks in each village, avoiding issues with sampling subsets of nodes in networks (Kossinets, Reference Kossinets2006). This setting offers the chance to study attitude change on a salient topic in a place where word-of-mouth networks are important and can be measured in full.
In each village, the study begins with a baseline survey that elicits networks and measures attitudes toward refugees. A subset of respondents is randomly selected to be treated with a perspective-taking intervention. This is a non-judgmental conversation that shares a narrative about a refugee and invites the respondent to imagine being in a similar situation. It is designed to have the respondent learn about what it would be like to be a refugee and to actively consider themselves in that position, ideally evoking compassion and a reconsideration of negative attitudes (Adida et al., Reference Adida, Lo and Platas2018; Kalla and Broockman, Reference Kalla and Broockman2020). Attitudes are measured immediately after this intervention for the treated, allowing us to measure a short-term change in attitudes in response to the intervention. This allows us to identify people who reacted particularly strongly on their own.
At the conclusion of baseline, the research team leaves the village and allows respondents to live their lives as usual. Two to three weeks later, the team returns to survey everyone at endline, once again measuring attitudes. Treated respondents were encouraged to discuss what they had learned with others, and we find that indeed discussion was rampant. Villages were abuzz with conversations about refugees in the interim while the research team was away. Conversations continued to move attitudes throughout the interim, resulting in large changes in attitudes by the end of the study throughout the village.
We use the data generated by this study to examine the role of networks in attitude change. We first characterize the relationship between networks and attitudes in the villages at baseline. We show that baseline political attitudes are uncorrelated with measures of centrality in village social networks—those who have higher degree, closeness centrality, betweenness centrality, and eigenvector centrality in their village networks do not hold attitudes detectably different from those less central. One network feature that does relate to attitudes is transitivity. Individuals embedded in more close-knit, interconnected pockets of their village networks hold colder attitudes toward refugees at baseline.
Next, we show that social networks exhibit some homophily with respect to political attitudes at baseline, but the extent of attitude similarity increases substantially by the end of the study. Network neighbors hold substantially more similar attitudes to one another at the end of our study than at the start. The increase in attitude similarity is much larger than the mechanical increase we would expect if attitudes warmed the same amount but independent of the network.
We then exploit the timing of our study to explore how attitudes changed. Treatment generates a shock to the attitudes of the treated right away. We show that treatment spilled over, warming the attitudes of network neighbors as well. Those who had more network neighbors receive treatment than would have been expected given their degree and the treatment assignment probability had even warmer attitudes at endline.
To explore the role of networks beyond immediate neighbors, we zoom in on those who were treated and reacted most strongly. In each village we identify the three people whose immediate reaction to treatment was the largest positive shift in attitudes and the three whose reaction was the largest negative shift. We then calculate everyone’s network distance to these extreme reactors. We find that network distance to these strong reactors is related to endline attitudes in the expected direction—being closer to the positive responders but farther from the negative ones is associated with warmer attitudes.
Our design allows us to verify these patterns with a placebo test that uses end of baseline attitudes as the outcome. Consistent with the view that networks play an active role in shaping attitudes, these network features do not predict immediate reactions, just those after two to three weeks of conversing with network neighbors. Whatever selection generated the network initially, attitudes are related to the network above and beyond this after people in the village have had weeks to use their networks to update their attitudes.
We find that not only did attitudes change substantially by the end of the study, but the patterns of change are consistent with social processing in networks—people vetting, discussing, and updating perspectives with their social ties. This intervention designed to warm attitudes did do so initially on average, but its more lasting effects were determined by the subsequent reactions of others in the village networks.
2. Study design
Our study examines social networks and over-time attitude change in 16 villages. These villages were selected from two regions of Uganda, West Nile and Western. West Nile borders South Sudan and the DRC; most of the 900,000 South Sudanese refugees in Uganda live in settlements there, along with a minority of refugees from DRC. The western region borders DRC, and most of the roughly 500,000 refugees it hosts are Congolese. The vast majority (over 90%) of refugees in Uganda live in settlements, separate from the host population.
Data collection occurred in two waves: villages 1–4 in 2021 and villages 5–16 in 2023. The study included a field experiment to test the efficacy and reactions to perspective-taking conversations held either one-on-one or in groups. Households were randomized to receive treatment within a village using household lists and assignment probability of 0.4 (with somewhat higher probability in Villages 1–4, see appendix). Elsewhere we examine the direct and indirect effect of treatment in the short- and long-term, document the spillover mechanism of chatter in the interim, and compare the one-on-one and group modes (Kamwesigye et al., Reference Kamwesigye, Larson and Lewis2026). We find that the treatment not only warmed self-reported attitudes of the treated, but kicked off an abundance of chatter that ultimately also warmed attitudes of the control over time in both the one-on-one and group versions of the treatment.
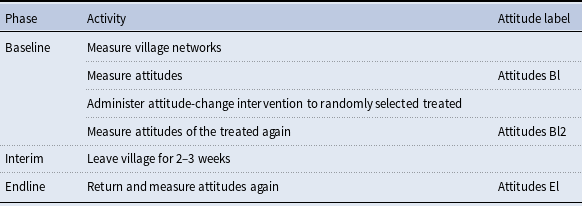
Here we focus on role that networks played in the evolution of attitudes of both the treated and the control that took place in study villages as a result of the study. Within each village, the order of activities is shown in Table 1. Attitudes were first measured during baseline, after networks were elicited. Then, the treatment serves as an exogenous shock to the attitudes of about 40% of households, on average resulting in a positive immediate shift but with variation. Attitudes were measured again immediately, registering the short-term response of the treated. Then, after an interim long enough for daily life to return to normal and social interactions to present opportunities for chatting about new views, attitudes were measured a final time.
Study flow

Table 1 Long description
A table detailing the study flow with three columns: Phase, Activity, and Attitude label. The table has four rows under the Baseline phase, one row under the Interim phase, and one row under the Endline phase. Row 1: Phase, Baseline; Activity, Measure village networks; Attitude label, empty. Row 2: Phase, Baseline; Activity, Measure attitudes; Attitude label, Attitudes Bl. Row 3: Phase, Baseline; Activity, Administer attitude-change intervention to randomly selected treated; Attitude label, empty. Row 4: Phase, Baseline; Activity, Measure attitudes of the treated again; Attitude label, Attitudes Bl2. Row 5: Phase, Interim; Activity, Leave village for 2-3 weeks; Attitude label, empty. Row 6: Phase, Endline; Activity, Return and measure attitudes again; Attitude label, Attitudes El.
2.1 Measuring attitudes
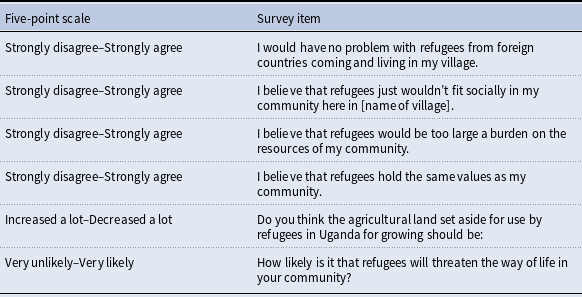
Our measure of attitudes toward refugees is a preregistered index that aggregates responses to six survey questions used in Larson and Lewis (Reference Larson and Lewis2025). The questions were designed to replicate survey instruments in Hopkins et al. (Reference Hopkins, Sides and Citrin2019) and Kalla and Broockman (Reference Kalla and Broockman2020), lightly modified to suit the Ugandan refugee context. Each asked the respondent to use a five-point scale to react to the statements in Table 2.
Survey items measuring social networks

Table 2 Long description
A table with six rows and two columns. The first column lists survey items, and the second column shows the five-point scale used for responses. Row 1: Survey item: I would have no problem with refugees from foreign countries coming and living in my village. Five-point scale: Strongly disagree-Strongly agree. Row 2: Survey item: I believe that refugees just wouldn’t fit socially in my community here in [name of village]. Five-point scale: Strongly disagree-Strongly agree. Row 3: Survey item: I believe that refugees would be too large a burden on the resources of my community. Five-point scale: Strongly disagree-Strongly agree. Row 4: Survey item: I believe that refugees hold the same values as my community. Five-point scale: Strongly disagree-Strongly agree. Row 5: Survey item: Do you think the agricultural land set aside for use by refugees in Uganda for growing should be. Five-point scale: Increased a lot-Decreased a lot. Row 6: Survey item: How likely is it that refugees will threaten the way of life in your community? Five-point scale: Very unlikely-Very likely.
Our attitude index rescales responses so that larger numbers always correspond to more pro-refugee positions and then aggregates them. It ranges from 6 (selecting the least pro-refugee response to all six questions) to 30 (selecting the most pro-refugee response to all 6 questions). This index is measured for respondents at the start of baseline (Attitudes Bl), for the treated a second time during baseline after treatment (Attitudes Bl2), and a final time in endline for everyone (Attitudes El).
Figure 1 shows the distribution of attitudes across villages measured on this 6–30 point scale at the start of the study (Attitudes Bl) and the end of the study (Attitudes El). There is substantial heterogeneity in attitudes at baseline both within and across villages. By the end of the study, attitudes shift to be substantially warmer. The extent to which attitudes change also clearly varies across villages. Some see a substantial spike at the maximum value of the index by endline (for instance Villages 8 and 9), while others do not.
Attitudes at baseline and endline in all sixteen study villages. Attitudes shifted considerably in the pro-refugee direction by endline.

Our study led to changes in self-reported attitudes in all 16 villages. On average, attitudes ended warmer toward refugees, though with large variation in the extent (and sometimes even the direction) of attitude change. Did the networks play a role in shaping the ultimate attitudes of individuals in these villages, and if so, how?
2.2 Measuring networks
If attitudes are held and changed socially, then we need to measure the networks that are relevant to this process. The relationships should not only be capable of transmitting information about who holds what attitude, but they should also be the relevant reference set for passing judgment about correct attitudes (see, e.g., Paluck and Shepherd (Reference Paluck and Shepherd2012)).
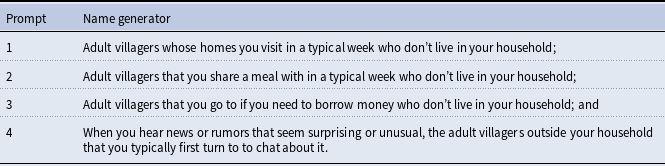
Through a combination of prior work (Larson and Lewis, Reference Larson and Lewis2017), qualitative probing before the start of the study, pretesting, and validation between waves, we arrived at a set of activities that indicate the kinds of trusting relationships through which information and norm enforcement should spread. We measure these with four name generators that inquire about concrete instances of the activities relevant to the local context (Larson, Reference Larson2024). Specifically, at the start of baseline respondents were asked to name up to five names (a number optimized from pretesting, see appendix) in response to each of the prompts in Table 3.
Survey items measuring attitudes toward refugees

Table 3 Long description
A table with four rows and two columns. The columns are labeled ’Prompt’ and ’Name generator’. Row 1: Prompt 1, Adult villagers whose homes you visit in a typical week who don’t live in your household. Row 2: Prompt 2, Adult villagers that you share a meal with in a typical week who don’t live in your household. Row 3: Prompt 3, Adult villagers that you go to if you need to borrow money who don’t live in your household. Row 4: Prompt 4, When you hear news or rumors that seem surprising or unusual, the adult villagers outside your household that you typically first turn to to chat about it.
We also ask respondents to list all adults in their household. We then use the household lists to identify the households of the alters listed in response to the name generators. While each of these activities could have a direction—a borrower and lender, a visitor and a host—any instance of the activity would be an opportunity for both parties to learn something about the attitudes the other holds. Perhaps during a visit, the topic comes up in conversation and each gets a sense of the other’s views. For this reason we take these links to be undirected for the purposes of transmitting information relevant to attitudes.
We construct the undirected village social network as a union of the four prompts using or-links. Specifically, we consider an undirected link to be present between two households in a village’s social network if a member of one household listed a member of the other household in response to at least one of the four name generator questions. All households were selected for inclusion in the study; at most 5% were unreachable in any village. The measured networks are then approximately complete views of the true village social networks. See the appendix for additional detail.
Below we also perform analyses using the subset of ties that are strong, measured as multiplex links in this network. A household has a strong tie to another in our network if one household names someone in the other household in response to two or more of the four prompts.
2.3 Empirical approach
We use evidence from the field experiment to assess the possibility that social networks shape the ultimate attitude change that was initiated by our study but continued through the interim in which community members chatted with one another. Our approach triangulates from a variety of analyses to separate incidental correlation in a network from evidence that the network was actively used in the process as community members assessed new views.
We begin by characterizing whether and to what extent baseline attitudes relate to village social networks. Network positions, in part due to the way the network was formed in the first place, can be correlated with personality traits (Burt et al., Reference Burt, Jannotta and Mahoney1998), views (Dannals et al., Reference Dannals, Reit and Miller2020), and behavior (Atwell and Nathan, Reference Atwell and Nathan2022). We first ask whether structural positions in village networks predict attitudes toward refugees. The answer is largely no: in our study villages, there is no clear relationship between attitudes toward refugees and centrality measured a variety of ways, though individuals with higher local clustering hold colder attitudes.
We then quantify the extent of attitude homophily at baseline. Homophily tends to be abundant in social networks (McPherson et al., Reference McPherson, Smith-Lovin and Cook2001), including with respect to political views (Huber and Malhotra, Reference Huber and Malhotra2017). We assess the extent to which people’s attitudes measured on our 6–30 point scale differ from the attitudes of their network neighbors. Baseline attitude are somewhat correlated within network neighborhoods before our study.
With these views of political attitudes in village networks in hand, we turn to our analyses of attitude change. The study was designed to change attitudes of those who participated in the perspective-taking treatment. During a 2–3 week interim, all people throughout these communities had the opportunity to continue to revise their attitudes as they spoke with one another in daily life. We examine whether attitudes at endline show evidence that social networks were an important part of this process. We do so in three steps.
-
1. Increase in attitude similarity
First, we assess the extent to which people throughout the study communities, both the treated and the control, become more similar to one another in attitudes by the end of the study. In other words, we measure the change in attitude homophily due to the study. For comparison, we also calculate the change in attitude homophily we would expect if attitudes shifted as much but fully individually, without the use of networks.
We find that people’s attitudes change to become more similar to their network neighbors’ attitudes. Attitudes converge within neighborhoods, substantially more than would be expected to mechanically occur if everyone experienced an independent shift in attitudes due to the study.
-
2. Influence of network neighbors
Second, we zoom in on the role of network neighbors in the formation of new endline atittudes. Here we exploit the exogenous shock to attitudes that our treatment delivered to the treated after baseline and take our network to be a map of indirect exposure to treatment (Aronow and Samii, Reference Aronow and Samii2017; Aronow et al., Reference Aronow, Eckles, Samii and Zonszein2021; Borusyak and Hull, Reference Borusyak and Hull2023). We show that a person’s endline attitude can be explained in part by the treatment received by their network neighbors, above and beyond whether they were themselves treated. People who happen to have more network neighbors treated than would be expected given the probability of treatment and their degree have warmer attitudes at endline.
Moreover, network ties’ immediate reactions to the treatment predict endline attitudes. People whose neighbors’ immediate reaction to treatment was positive end the study with warmer attitudes, while those with neighbors who reacted negatively end with colder attitudes. Placebo tests show that these same network measures do not predict immediate posttreatment attitudes of the treated, only endline attitudes, those formed after a chance to consult with network ties during the interim.
-
3. Influence beyond network neighbors
Finally, we zoom out and ask whether influence extends farther into the networks, beyond immediate network neighbors. The diameter of these networks is small (between 5 and 8) and so k-neighborhoods quickly become too large to speak to this question. Instead, we pick particular nodes who may have been especially influential in the social process that occurred during the interim and explore whether distance to them is related to endline attitudes.
We focus on strong reactors to the treatment. These nodes were especially moved and so may have had a lot to say when the topic came up in subsequent conversations. For each village, we identify the three treated people who reacted to treatment with the largest positive attitude change and the three who reacted with the largest negative attitude change. We show that distance to these strong reactors predicts endline attitudes and in the expected direction: being closer to the positive (negative) strong reactors predicts warmer (colder) endline attitudes. A placebo test again confirms that this pattern only appears for endline attitudes, not attitudes measured before the interim.
Village social networks visualized with a Fruchterman–Reingold force-directed layout and nodes colored by baseline attitudes.

3. Results
3.1 Networks as maps of baseline attitudes
We first examine differences in network structures across villages and explore whether individual-level network features are related to baseline attitudes toward refugees.
Figure 2 shows the social networks for each of the 16 villages using a Fruchterman–Reingold force-directed layout. Networks vary considerably from one village to another. While some feature most nodes highly interconnected to one another with high density (see villages 7 and 9), others show greater fragmentation into subcommunities (see villages 10 and 14) and some contain isolates (see villages 1 and 16). Isolates here most likely indicate that that node’s primary relationships are not within the village.
With complete views of the networks at the village level, we can explore the relationship between node-level positions and baseline attitudes. Since network structure can be correlated with other traits and behaviors (Atwell and Nathan, Reference Atwell and Nathan2022; Burt et al., Reference Burt, Jannotta and Mahoney1998), it is possible that network positions would also predict attitudes toward an out-group such as refugees.
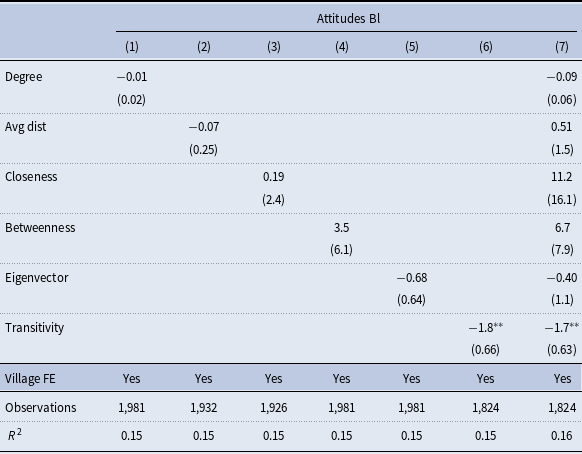
Node-level network correlates of attitudes at baseline. Only transitivity is statistically significantly related to attitudes, with higher transitivity associated with colder attitudes

Table 4 Long description
A table with seven columns and eight rows, including a header row. The columns are labeled (1), (2), (3), (4), (5), (6), (7), and the rows are labeled Degree, Avg dist, Closeness, Betweenness, Eigenvector, Transitivity, Village FE, Observations, and R squared. Each cell contains numerical values or text. The table presents OLS regressions and village-clustered standard errors in parentheses. Notable values include significant transitivity values of 1.8 and 1.7 with standard errors of 0.66 and 0.63, respectively. The table also includes observations ranging from 1,824 to 1,981 and R squared values around 0.15 to 0.16.
OLS regressions and village-clustered standard errors are in parentheses. Signif. Codes: ***0.01, **0.05, *0.1.
We calculate a node’s degree, average distance to all other nodes in the same component, closeness centrality, betweenness centrality, eigenvector centrality, and transitivity. We regress baseline attitudes (range of 6–30) on these measures one at a time, including village fixed effects (since we observe substantial cross-network variation). As shown in Table 4, the only feature that is statistically significantly related to baseline attitudes is transitivity. On average, the more that a node’s social ties are linked to one another, the lower is that node’s baseline attitude toward refugees. The same relationship holds when we include subsets of the network features or, as shown in column 7, all other network features at once. Transitivity is consistently related to lower baseline attitudes.
This pattern is consistent with foundational ideas about the value of bridging structural holes (Burt, Reference Burt1992) and weak ties (Granovetter, Reference Granovetter1973), which hold that tight-knit pockets within a network can be isolated from new ideas. People in especially tight-knit pockets of their network with few ties outside of it can sustain more prejudicial views about outsiders.
3.2 Attitude homophily increases
Next, we zoom in on the extent to which nodes that are linked to one another hold similar views. Similarity in linked nodes—homophily—is common in social networks with respect to lots of attributes (Jackson et al., Reference Jackson, Nei, Snowberg and Yariv2023; McPherson et al., Reference McPherson, Smith-Lovin and Cook2001), including explicitly political ones (Bond and Sweitzer, Reference Bond and Sweitzer2022; Huber and Malhotra, Reference Huber and Malhotra2017). We might expect homophily on attitudes toward refugees if people have deliberated the issue with their social ties, or if their ties were formed due to their shared views on refugees, or even if their ties were formed because of other attributes in common that lead them to react to common events with similar perspectives.
We measure homophily on attitudes in terms of the absolute differences in attitude index scores between a node and her network neighborhood. Specifically, for node
 $i$
we calculate
 \begin{eqnarray*} NW Dif_{i}^{Bl} = \frac {1}{\#N_{i}}\sum _{j \in N_{i}} |AttitudeBl_{i} - AttitudeBl_{j}| \end{eqnarray*}
where
 $N_{i}$
is the set of
 $i$
’s neighbors in the network,
 $N_{i} = \{j \, : \, ij = 1\}$
for
 $j \neq i$
, and
 $\#N_{i}$
is the number of these neighbors.
 $NW Dif_{i}^{Bl}$
is then the average absolute difference between
 $i$
and her network neighbors’ attitudes on the 6–30 scale at baseline. While this value on its own is not very meaningful, we can calculate the same for node
 $i$
at endline,
 \begin{eqnarray*} NW Dif_{i}^{El} = \frac {1}{\#N_{i}}\sum _{j \in N_{i}} |AttitudeEl_{i} - AttitudeEl_{j}|, \end{eqnarray*}
which allows us to compare the extent of network difference in attitudes between the start and the end of the study for a particular village’s network. Figure 3 shows the distribution of
 $NWDif^{Bl}$
and
 $NWDif^{El}$
, the network differences throughout a village at baseline and endline for all sixteen study villages.
Absolute differences in attitudes between network neighbors at baseline and endline in each of the sixteen study villages. These differences shrink considerably by endline.

The plots in Figure 3 show that in all villages, the extent to which nodes hold different attitudes from their network neighbors decreases between baseline and endline. In other words, homophily on attitudes increases. It also shows that the extent to which homophily increases varies across villages, with some ending the study with attitudes that are substantially more similar to one another than at the start.
Of course, this increase in homophily does not tell us that people became more similar to their network neighbors because of the network. An intervention that shifts attitudes in a common direction on a scale that is capped would mechanically induce greater homophiliy. In the extreme case where everyone ended the study with attitudes maxed out at 30, everyone would hold the same attitudes as their neighbors and
 $NWDif^{El}$
would be 0 for everyone, regardless of whether anyone was compelled by anything their network neighbor said on the matter.
To explore whether these shifts in homophily are consistent with people actively moving their attitudes toward those of their network neighbors, we perform two tests. The first is a placebo test that benchmarks what the average
 $NWDif^{El}$
would be if everyone in the village simply experienced a level shift in their attitudes the size of the mean observed change in the village, subject to the capped scale. In other words, for all people in a village, their placebo endline attitudes are taken to be their own baseline attitudes plus a level shift the size of the village mean increase. If that would make their placebo endline exceed 30, the score is replaced with 30. This mimics the situation where everyone warms independently of the network and attitudes can be compressed by the cap.
Table 5 shows the results of this exercise. It first reports the average
 $NWDif^{Bl}$
and
 $NWDif^{El}$
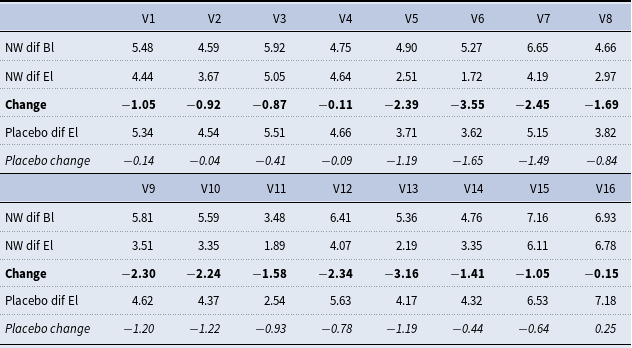
in each of the 16 villages, quantifying the observed change over time in the bold. It then reports the average network difference that would be observed at endline under the placebo test. In all 16 villages, the amount of incidental change we would see from a level shift in attitudes that occurs absent any network influence is smaller (in most cases much smaller) than the change we do observe.
Change in network differences by study villages. In all villages, individuals hold attitudes that are more similar to their network neighbors at endline than they did at baseline, and this change is much larger than would be observed under a placebo level shift in attitudes

Table 5 Long description
The table presents data on network differences in 16 study villages, comparing baseline (Bl) and endline (El) values. It includes columns for V1 to V16, with rows for NW dif Bl, NW dif El, Change, Placebo dif El, and Placebo change. Each row provides specific values for each village. Notable trends include varying changes in network differences across villages, with some villages showing significant changes while others show minimal changes. The placebo change values are generally smaller than the observed changes.
While this is reassuring that the increase in homophily is not simply mechanical, we perform an additional test that provides a better sense of expected variation in homophily. For each village, we take the network and baseline attitudes as given. We also take the set of observed attitude changes—the extent to which a person’s attitude changed by the end of the study—as given, but not their attribution. Instead, we shuffle these changes on the network, reassigning attitude changes to nodes at random. For example, in a three person village if between baseline and endline someone’s attitude increased by 3 points, someone else’s increased by 5 points, and someone’s decreased by 2 points, we would have a set of attitude changes
 $\{3,5,-2\}$
. Randomly reassigning these would lead to a new set of simulated endline attitudes for people on the observed network and a new average value of
 $NWDif^{El}$
for the village.
Iteratively shuffling the attitude changes and recalculating the network similarity that would be observed at endline results in a sampling distribution of a village’s mean
 $NWDif^{El}$
. Figure 4 shows these for all 16 villages. Vertical lines indicate the actual
 $NWDif^{El}$
that we observe for that village. In all cases, the observed network difference is substantially smaller than would be expected by chance under this permutation test. In fact, the implied p-values in all 16 villages are less than
 $.001$
.
Sampling distribution of the mean network difference at endline when the observed distribution of long-term changes in the village are shuffled across the network. The observed reduction in network differences (equivalently, the observed increase in homophily) is too large to be expected by chance.

Figure 4 Long description
The image contains sixteen density plots, each representing a different village. Each plot shows the density distribution of mean endline network differences. The x-axis is labeled Value, and the y-axis is labeled Density. Each plot includes a blue density curve and an orange dashed vertical line. The values on the x-axis range from 2.5 to 10.0. The density curves vary in shape and position across the villages, indicating different distributions of network differences. The orange dashed lines represent specific values within each distribution.
Putting these pieces together, it seems that however homophilous a village’s network was in terms of attitudes toward refugees at the start of the study, it became much more so by the end. Attitudes changed to be more similar to network neighbors. The differences are larger than would be expected if all respondents were simply individually reacting to the study with warmer attitudes independent of their network neighbors and are also larger than would be expected if the study generated the same set of reactions within the village but independent of network position.
3.3 Attitudes respond to the treatment of network neighbors
Next, we leverage the study design, which tracks attitudes over time and exogenously induces attitude change by randomly treating approximately 40% of individuals in each village following the baseline survey.
The treatment consisted of a perspective-taking conversation about refugees conducted at the end of the baseline interview. During this conversation, an enumerator presented a narrative about a specific refugee and guided respondents through an exercise designed to encourage them to imagine themselves in a similar situation. Respondents were also given the opportunity to express concerns or reservations, which the enumerator addressed respectfully. Immediately following the intervention, attitudes among treated respondents were measured again.
We focus on the immediate role of treatment and network neighbors’ responses in shaping individuals’ endline attitudes. To the extent that respondents discussed refugees after the intervention, treatment may have generated spillovers that influenced the attitudes of their social contacts. Following Borusyak and Hull (Reference Borusyak and Hull2023), we construct a measure of indirect exposure to treatment through social ties. Specifically, we compare the observed number of treated network neighbors to the number expected under random assignment, given an individual’s number of ties and the probability of treatment assignment (see the Appendix for details).
Extra Trt captures the number of “extra” treated neighbors relative to this expectation. The measure is positive when an individual has more treated neighbors than expected by chance and negative when they have fewer. Extra Trt Strong Tie is defined analogously but is restricted to strong ties, where tie strength is measured using multiplexity (Granovetter, Reference Granovetter1973).
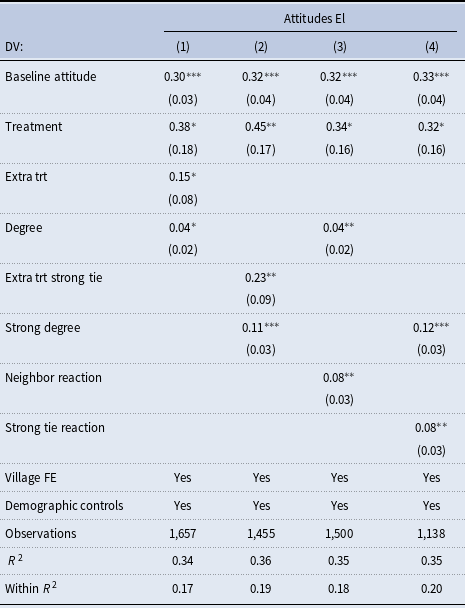
The first two columns of Table 6 suggest that the treatment of network neighbors is indeed related to a respondent’s endline attitudes. Respondents with more (fewer) treated ties than would have been expected by chance end with warmer (colder) endline attitudes, even when accounting for their own treatment status and their number of ties. The same is true when restricting attention to strong ties. Each extra treated tie is associated with endline attitudes 0.15 warmer on the 6–30 attitude scale; the increase is 0.23 for each extra treated strong tie.
Spillover analyses. OLS regressions with village fixed effects and controls that include gender, age, education, religion, economic precarity, experience as and contact with refugees. Full coefficient table and other specifications can be found in the appendix

Table 6 Long description
A table titled ’Attitudes El’ with four columns and twelve rows. The table presents OLS regression results with village fixed effects and demographic controls. The columns are labeled (1), (2), (3), and (4). The rows include Baseline attitude, Treatment, Extra trt, Degree, Extra trt strong tie, Strong degree, Neighbor reaction, Strong tie reaction, Village FE, Demographic controls, Observations, R squared, and Within R squared. Each cell contains regression coefficients and standard errors in parentheses. Notable values include Baseline attitude with coefficients around 0.30 to 0.33, Treatment with coefficients ranging from 0.32 to 0.45, Extra trt with a coefficient of 0.15, and Extra trt strong tie with a coefficient of 0.23. The table also includes significance codes and observations for each column.
Village-clustered standard errors are in parentheses. Signif. Codes: ***0.01, **0.05, *0.1.
These analyses have focused on the treatment status of neighbors. Next we consider not just whether neighbors received treatment, but how neighbors reacted to any treatment they received. Neighbor Reaction is the average attitudes of any treated network neighbors measured right after treatment, in Bl2. Strong Tie Reaction is the average attitudes of any treated strong tie neighbors in Bl2. Columns (3) and (4) of Table 6 show that the reactions are also related to endline attitudes. People whose neighbors reacted positively to treatment right away have warmer attitudes by endline, while people whose neighbors reacted negatively right away have colder endline attitudes. The scale of these variables is also 6–30. A one standard deviation increase in Neighbor Reaction (3.2 points on this scale) is associated with endline attitudes that are 0.26 warmer. Someone whose neighbors’ reaction is at the maximum of the scale has endline attitudes about 2 full points warmer than someone whose neighbors’ reaction is at the minimum. Reactions of strong ties are similarly impactful.
In the appendix we show that these findings are robust to other specifications. Importantly, we also show that they pass a placebo test in which we use as the dependent variable the immediate posttreatment attitudes rather than endline attitudes. Because the respondent would not have had a chance to consult with any of her network neighbors before forming these attitudes, the network neighbors’ treatment status and reactions could not have affected attitudes by this point in time. Any relationships that would appear in these regressions would mean that something spurious is connecting network reactions to attitudes. Reassuringly, we find no such relationships.
In short, long-term attitude change seemed to be actively shaped by the attitudes of network neighbors.
3.4 Attitudes change in response to strong reactors farther away
Finally, we broaden our focus beyond immediate neighbors and ask whether individuals’ attitudes are shaped by others elsewhere in the network.
These analyses exploit substantial heterogeneity in responses to the intervention. Although respondents reacted positively on average, treatment effects varied considerably across individuals. A minority of respondents reported attitudes immediately after the intervention that were less favorable than their baseline attitudes. Among those who responded positively, the magnitude of attitude change also varied widely: some respondents’ attitudes shifted only slightly, while others exhibited much larger changes.
If individuals who reacted most strongly to the intervention were also more likely to participate in subsequent village discussions, their influence may have extended beyond their immediate social contacts. Put differently, respondents who experienced the largest immediate attitude changes may have played a disproportionate role in shaping attitudes throughout the broader village network over time.
To explore evidence for this possibility, we identify the strongest reactors in each village in each direction. Specifically, we identify the three people whose immediate reaction to the intervention was the largest positive attitude change (MostPersuaded) and the three whose immediate reaction to the intervention was the largest negative attitude change (MostBacklashed). Then we calculate the length of the shortest path between each person and their nearest MostPersuaded strong reactor (DistPersuaded) and their nearest MostBacklashed strong reactor (DistBacklashed).
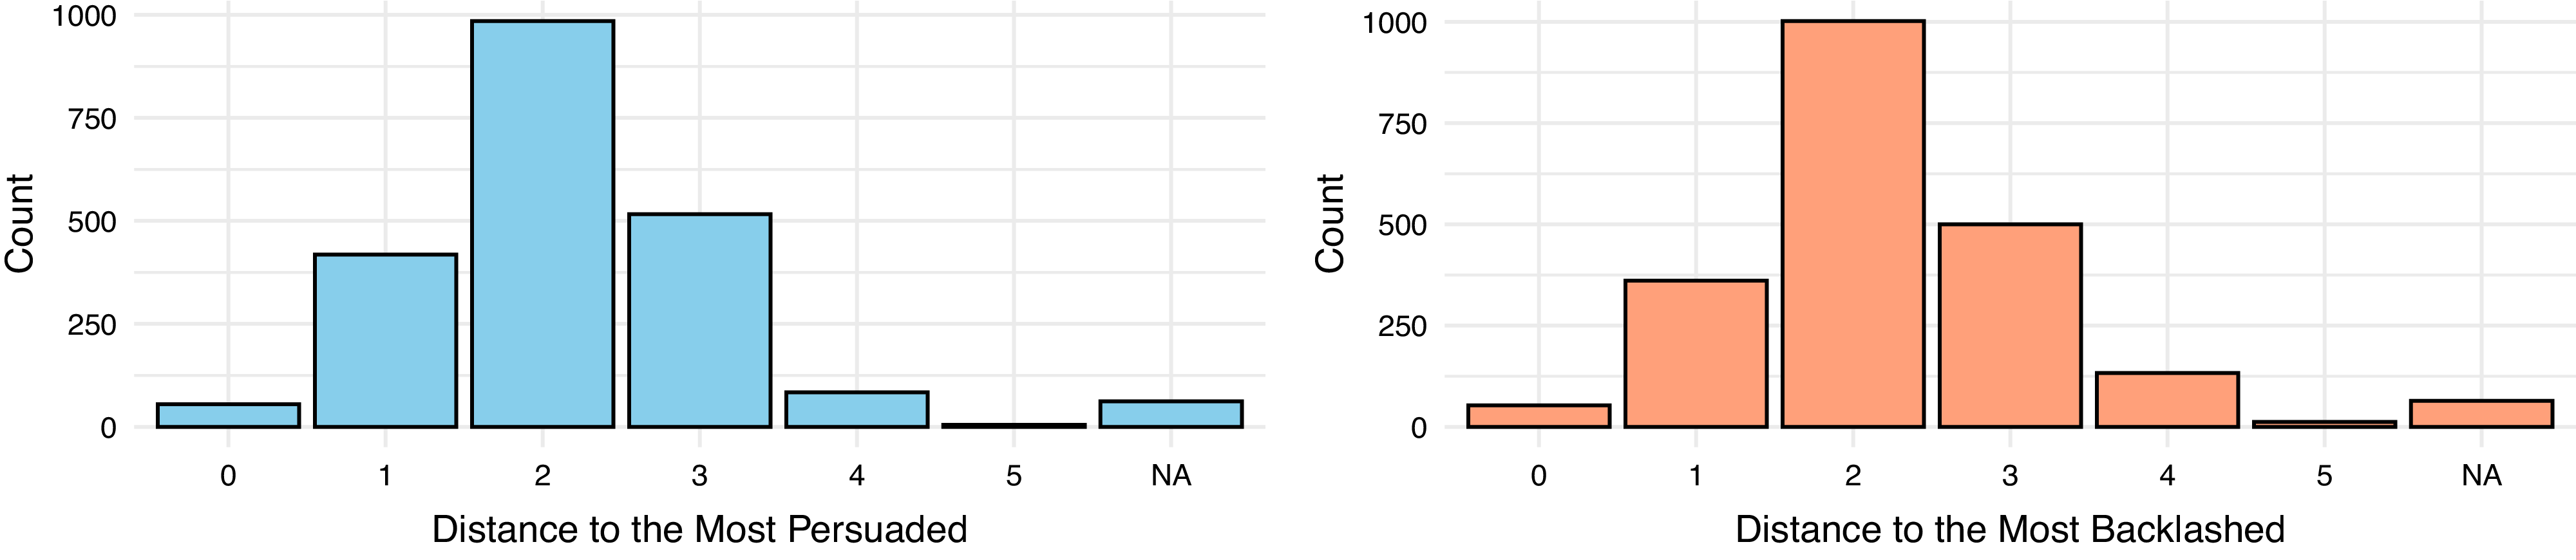
Figure 5 shows the distribution of these distance variables. Someone who is in the set MostBacklashed would have DistBacklashed = 0. Someone who is the immediate neighbor of someone in that set would have DistBacklashed = 1. The largest finite distance away from a member of either set is 5.
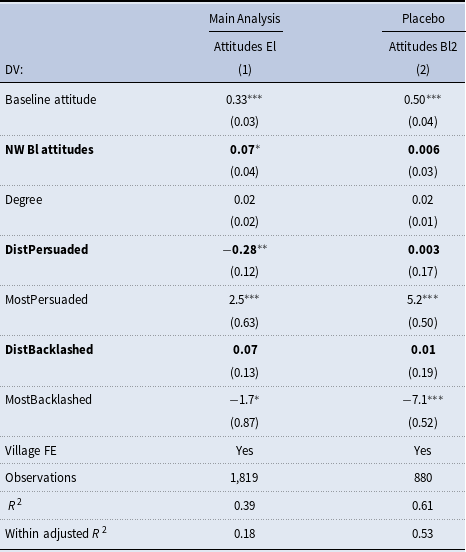
Now we regress attitudes at endline on these network distances to strong immediate reactors. The results are shown in column (1) of Table 7. A few results stand out. First, even when controlling for one’s own baseline attitudes and neighborhood size, network neighbors’ baseline attitudes are related to endline attitudes. By the end of the study, a person is drawn closer to her network neighbors’ attitudes.
Above and beyond one’s own and one’s network neighbors’ baseline attitudes, distance to strong reactors is related to endline attitudes. Greater distance from the strong positive reactors predicts more negative baseline attitudes, while greater distance from strong negative reactors (weakly) predicts more positive endline attitudes. Using the immediate posttreatment attitudes measured for the treated as a placebo, none of these factors is related to attitudes at that point in time (before any socializing could take place)

Table 7 Long description
The table has two columns labeled Placebo Attitudes El and Attitudes Bl2, and it includes various rows with corresponding values. Row 1: Baseline attitude, 0.33, 0.50. Row 2: NW Bl attitudes, 0.07, 0.006. Row 3: Degree, 0.02, 0.02. Row 4: DistPersuaded, -0.28, 0.003. Row 5: MostPersuaded, 2.5, 5.2. Row 6: DistBacklashed, 0.07, 0.01. Row 7: MostBacklashed, -1.7, -7.1. Row 8: Village FE, Yes, Yes. Row 9: Observations, 1,819, 880. Row 10: R squared, 0.39, 0.61. Row 11: Within adjusted R squared, 0.18, 0.53.
Village-clustered standard errors are in parentheses. Signif. Codes: ***0.01, **0.05, *0.1.
Distribution of network distances to those who immediately responded most positively (DistPersuaded, left) and most negatively (DistBacklashed, right). Respondents with distance 0 are members of the reference category (MostPersuaded and MostBacklashed, respectively).

Second, extreme reactions have persistence. Being one of the people with the strongest immediate reactions positively or negatively—MostPersuaded and MostBacklashed—is associated with endline attitudes that are more strongly positive or negative. Strong negative reactions predict negative endline scores and strong positive reactions predict much more positive endline scores.
Finally, distance to strong reactors predicts endline attitudes in the expected direction. For positive reactors, this is estimated precisely. The greater the network distance to a strong positive reactor, the more negative one’s endline scores. That is, being farther from strong positive reactors is associated with more negative attitudes while being closer to strong positive reactors is associated with more positive attitudes.
Strong reactions were not randomly assigned. Those who reacted most strongly to their treatment may be different in other ways, and this difference could induce a spurious correlation between distance to these people and attitude change. We once again turn to a placebo test that takes the attitude measurement that happened right after treatment as the dependent variable to assess this possibility. Importantly for our strategy, this measurement occurred before a respondent would have had a chance to go and talk to their network neighbors to learn how they reacted to our study.
Column (2) of Table 7 reports the results of this placebo test. Reassuringly, none of the measures intended to capture active network influence are associated with the immediate posttreatment attitude outcome. The two variables that do emerge as strongly significant, MostPersuaded and MostBacklashed, are expected to do so because they are defined using extreme values of
 $Attitudes Bl2$
and are therefore mechanically related to the placebo outcome.
The key results are those highlighted in the table. These coefficients are substantively small—indeed, effectively zero—and statistically indistinguishable from zero. Their lack of association with the placebo outcome strengthens the interpretation that the corresponding relationships with endline attitudes reflect the active use of social networks in shaping attitudes during the intervening period, rather than preexisting correlations present immediately after treatment.
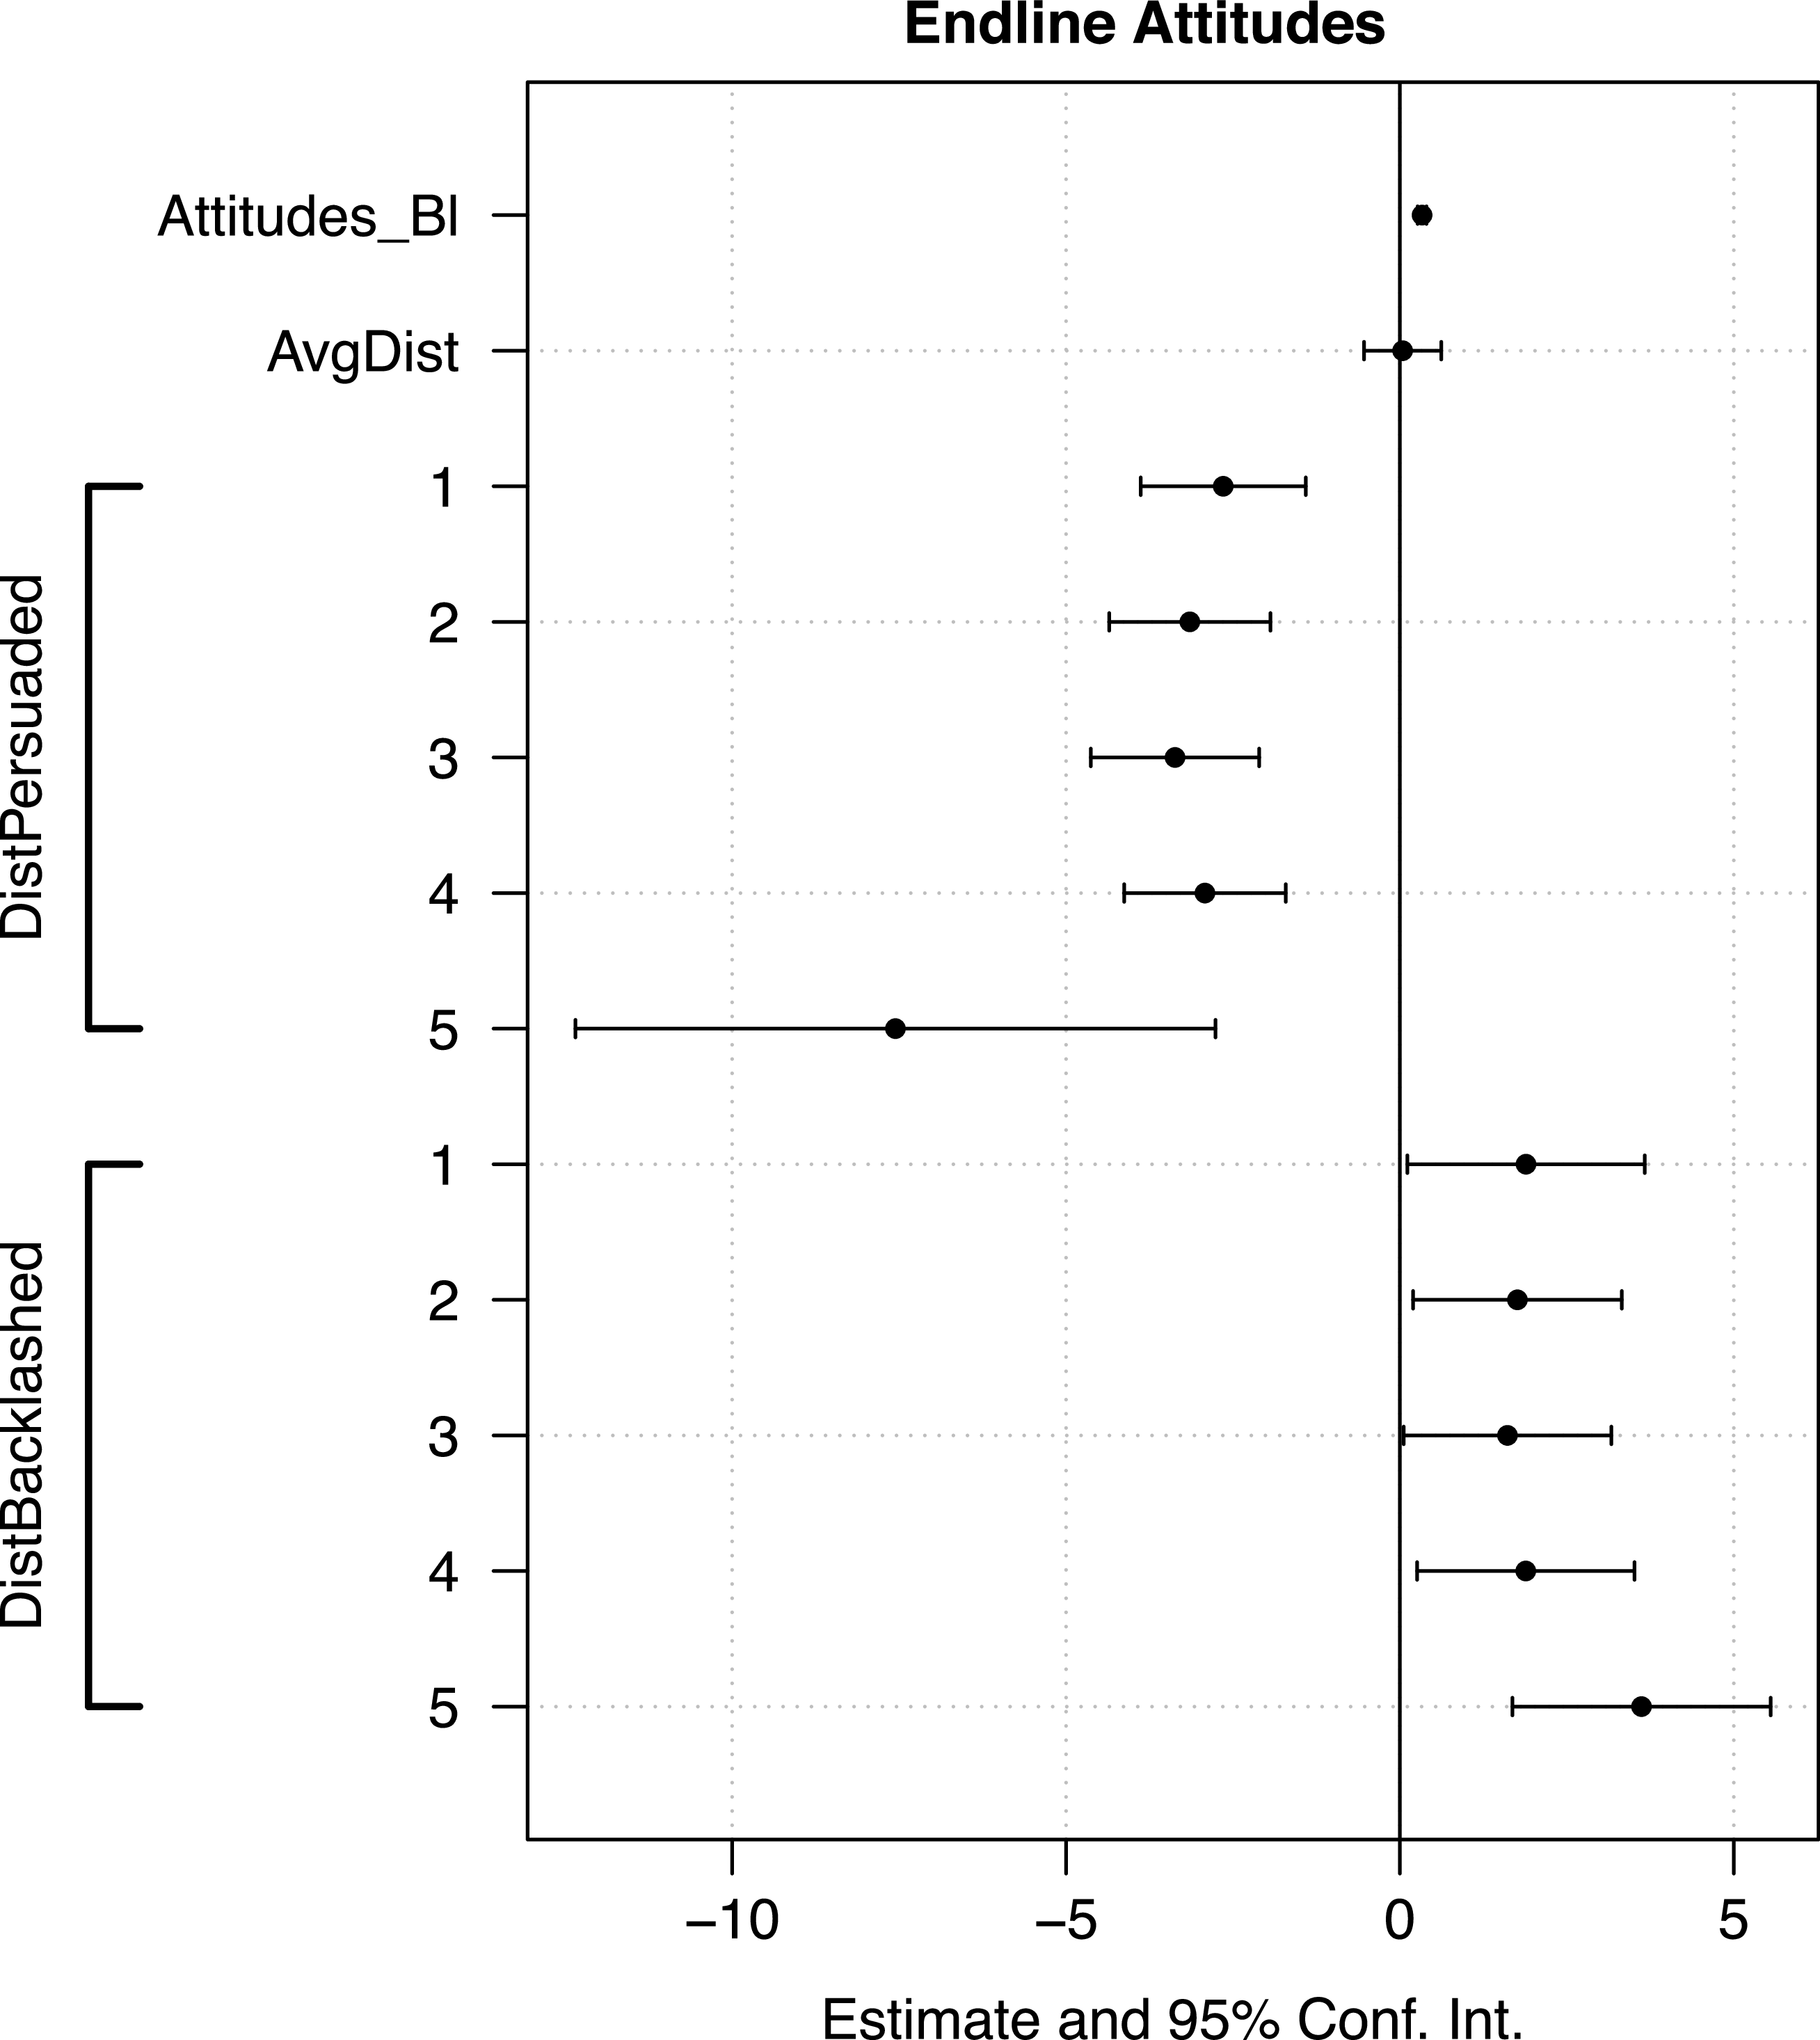
Finally, we include distance from strong reactors as a set of indicator variables, allowing the relationship between distance and attitudes to be estimated flexibly. Specifically, we enter separate indicators for each network distance from an extreme reactor, with distance 0 serving as the omitted reference category.
 \begin{align*} Attitudes\_El_{i} &= \beta_{1} \, DistPers=1_{i} + \beta _{2}DistPers=2_{i} + \beta _{3}DistPers \\[4pt] &=3_{i} + \beta _{4} \, DistPers=4_{i} + \beta _{5}DistPers=5_{i} + \ldots + \epsilon _{i}. \end{align*}
We also control for respondents’ average network distance to all other individuals in their village and for baseline attitudes.
Coefficient plot showing relationship between each distance away from a strong reactor and endline attitudes, controlling for baseline attitudes, average network distance, village fixed effects, and standard errors clustered by village. Being close (low distance) to those who reacted positively and far (high distance) from those who reacted with backlash are associated with warmer endline attitudes.

Figure 6 presents the resulting coefficient estimates. The pattern is broadly consistent with the hypothesized role of network proximity. Attitudes are more favorable among respondents who are closer to strong positive reactors and farther from strong negative reactors. The largest effects appear at greater network distances from the reference category, although these estimates should be interpreted with caution given the smaller number of observations at longer distances (see Figure 5).
4. Discussion and conclusion
Our findings highlight the social foundations of political attitude change. Although individuals initially responded to the perspective-taking intervention in diverse ways—some warming toward refugees and others cooling—the longer-term evolution of attitudes depended not only on these individual reactions but also on the structure of social relationships within villages. In the weeks following treatment, attitudes became increasingly aligned among network neighbors, suggesting that respondents did not simply internalize the intervention in isolation. Rather, they continued to process, discuss, and reinterpret its message through ongoing social interaction. Attitude change, in short, unfolded through the network.
Taken together, these analyses suggest that social network ties were an active part of attitude change. An implication is that network ties can amplify, dampen, reshape, or even transmit the effects of persuasive interventions. As a result, focusing exclusively on an individual’s response may miss an important part of what determines whether attitude change endures. People’s attitudes are embedded in social environments populated by others who hold views of their own and who may reinforce, contest, or reinterpret new information. The ultimate effect of an intervention therefore depends not only on the message it delivers but also on the network through which that message subsequently travels. Recognizing the role of social networks in shaping attitude change may be essential both for understanding how political opinions evolve and for designing interventions capable of producing lasting change.
Acknowledgements
We are grateful to Joshua Blessing, Juliet Ajilong, Anthony Kamwesigye, and Innovations for Poverty Action (IPA)’s Uganda office for their critical role in carrying out data collection and to the study participants for generously giving their time.
Supplementary material
The supplementary material for this article can be found at https://doi.org/10.1017/nws.2026.10038.
Data availability statement
Upon publication, the data will be openly available in the Harvard Dataverse at https://doi.org/10.7910/DVN/RAHSVM.
Funding statement
We gratefully acknowledge funding for this project from the UK International Development awarded through Innovations for Poverty Action’s Peace & Recovery Program, George Washington University, and the National Science Foundation (Collaborative Grant 2215430, 2215494).
Competing interests
None.






 Open access

