1 Introduction
Measurement error poses a serious threat to the validity of survey research. This is especially true when studying sensitive questions, which present respondents with strong incentives to disguise the truth. Along with other methods such as the randomized response and endorsement experiments (e.g., Gingerich Reference Gingerich2010; Bullock, Imai, and Shapiro Reference Bullock, Imai and Shapiro2011; Blair, Imai, and Zhou Reference Blair, Imai and Zhou2015), the list experiment (a.k.a. the item count technique and the unmatched count technique) is an indirect questioning method that, by veiling individual responses, seeks to mitigate potential social desirability and nonresponse biases (Miller Reference Miller1984; Corstange Reference Corstange2009; Imai Reference Imai2011; Blair and Imai Reference Blair and Imai2012; Glynn Reference Glynn2013). While some studies have shown that list experiments can be effective for reducing bias, a well-known limitation of the method is that the extreme value responses perfectly reveal the sensitive trait, meaning that some respondents are still incentivized to disguise the truth. Blair and Imai (Reference Blair and Imai2012) show how to address such “floor and ceiling effects” within a regression framework.
While the literature has since provided additional tools for alleviating strategic measurement error in list experiments (e.g., Blair, Imai, and Lyall Reference Blair, Imai and Lyall2014; Aronow et al. Reference Aronow, Coppock, Crawford and Green2015), it has not yet addressed the consequences of nonstrategic measurement error, arising for example from “the usual problems of miscoding by administrators or enumerators as well as respondents misunderstanding or rushing through surveys” (Ahlquist Reference Ahlquist2018). Like floor and ceiling effects, these behaviors run against the assumptions of the standard maximum likelihood model (MLreg) for list experiments (Blair and Imai Reference Blair and Imai2012), and can induce severe model misspecification biases, especially when the underlying trait is rare (Ahlquist Reference Ahlquist2018). Of course, all forms of nonstrategic measurement error are best avoided through careful interviewer training, pilot surveys, and other best practices of survey research. Still, for some list experiments, a certain degree of careless responding and administrative errors may be unavoidable. We do not yet have the necessary tools for addressing nonstrategic measurement error in list experiments.
In this paper, we take up the challenge of providing new statistical methods for detecting such error and alleviating the resulting model misspecification bias. For concreteness, we consider two specific measurement error mechanisms, originally proposed in Ahlquist (Reference Ahlquist2018). First, top-biased error occurs when a random subset of respondents chooses the maximal (ceiling) response value, regardless of their truthful response. Such error can greatly bias MLreg, which achieves statistical efficiency by modeling each level of the response variable. However, as we argue in Section 2.2, top-biased error is also unlikely to be common for truly sensitive questions (unless respondents are not paying attention or survey implementation is poor), since choosing the ceiling response amounts to a confession that one possesses the supposedly sensitive trait. For this reason, we also consider a second, more plausible nonstrategic measurement error mechanism, uniform error, which occurs when a subset of respondents chooses their responses at random.
As a point of reference, we begin by showing that existing methods, in particular the standard difference-in-means (DiM) and nonlinear least squares regression (NLSreg) estimator, are more robust than MLreg to these measurement error mechanisms. Leveraging this fact, we propose a simple statistical test that gauges the difference between NLSreg and MLreg. Our test provides a principled approach to determining when the additional assumptions required by MLreg are justified. It can also be viewed as the formal and multivariate version of Ahlquist’s recommendation to compare the sensitive item prevalence estimated by DiM and MLreg, as NLSreg is a generalization of DiM.
Next, we show how to detect and adjust for top-biased and uniform error in a regression modeling framework (Section 2). Our new regression models occupy a valuable middle ground between existing approaches. On the one hand, they preserve the greater efficiency of MLreg, which can be invaluable when analyzing noisy methods such as the list experiment. On the other hand, they also contain the model without measurement error as a limiting case, thus improving robustness and providing another statistical test. We propose an additional method for improving the robustness of the standard regression estimators using the auxiliary information strategy of Chou, Imai, and Rosenfeld (Reference Chou, Imai and Rosenfeld2017). All of our proposed methods are implemented via the open-source R package list (Blair, Chou, and Imai Reference Blair, Chou and Imai2017).
We examine the performance of the proposed methodology through small scale simulation studies, which build on the simulations in Ahlquist (Reference Ahlquist2018) (Section 3). We show that our proposed test detects deviations from the modeling assumptions at a high rate. We also confirm the theoretical expectation that NLSreg is robust to nonstrategic measurement error and the forms of model misspecification contemplated in Ahlquist (Reference Ahlquist2018). Turning to uniform response error, we find that MLreg performs reasonably well despite this misspecification. Nevertheless, we show that the robust estimators proposed here and in Chou, Imai, and Rosenfeld (Reference Chou, Imai and Rosenfeld2017) can improve the performance of list experiment regression in the presence of both types of measurement error.
Finally, we apply the proposed methodology to the empirical study presented in Ahlquist (Reference Ahlquist2018) (Section 4). When analyzed via MLreg, the study shows that unrealistically large proportions of Americans engage in voter fraud and/or were abducted by aliens. By contrast, a list experiment on texting while driving did not reveal such problems. The most straightforward analysis of these data yields a negative estimate (a positive estimate that is statistically indistinguishable from zero) for the proportion of those who engage in voter fraud (were abducted by aliens). We caution that multivariate analysis of such list experiments is bound to be unreliable, as a trait needs to exist for it to covary with respondent characteristics. Nevertheless, we show that our methods yield more sensible estimates of the prevalence of these traits than MLreg. In particular, our uniform error model yields estimates of voter fraud and alien abduction that are statistically indistinguishable from zero with the narrowest confidence intervals among the estimators we consider.
We further demonstrate that for the list experiment on texting while driving, which is not an extremely rare event, MLreg yields reasonable results that agree with those of the other methods. Given that all three list experiments were conducted in the same survey on the same respondents, and so were likely subject to the same forms of nonstrategic measurement error, this finding indicates that researchers should primarily be concerned with the rarity of the sensitive traits when deciding whether multivariate regression analyses are appropriate. Building on this observation, we conclude this article by offering a set of practical recommendations for applied researchers conducting list experiments (Section 5).
2 The Proposed Methodology
In this section, we propose statistical methods for analyzing list experiments with measurement error. We begin by reviewing MLreg and NLSreg, introduced in Imai (Reference Imai2011) and extended in Blair and Imai (Reference Blair and Imai2012). We then propose a statistical test of model misspecification for detecting measurement error. Next, following Blair and Imai (Reference Blair and Imai2012), we show how to directly model measurement error mechanisms and apply this strategy to the top-biased and uniform error processes introduced in Ahlquist (Reference Ahlquist2018). Finally, we adopt another modeling strategy developed in Chou, Imai, and Rosenfeld (Reference Chou, Imai and Rosenfeld2017) to further improve the robustness of multivariate regression models.
2.1 Multivariate Regression Models: A Review
Suppose that we have a simple random sample of
 $N$
respondents from a population. In standard list experiments, we have a total of
 $J$
binary control questions and one binary sensitive question. Let
 $T_{i}$
be the randomized treatment assignment indicator. That is,
 $T_{i}=1$
indicates that respondent
 $i$
is assigned to the treatment group and is asked to report the total number of affirmative responses to the
 $J+1$
items (
 $J$
control items plus one sensitive item). In contrast,
 $T_{i}=0$
implies that the respondent is assigned to the control group and is asked to report the total number of affirmative answers to
 $J$
control questions. We use
 $X_{i}$
to represent the set of
 $K$
pretreatment covariates (including an intercept).
Let
 $Y_{i}$
denote the observed response. If respondent
 $i$
belongs to the treatment group, this variable can take any nonnegative integer less than or equal to
 $J+1$
, i.e.,
 $Y_{i}\in \{0,1,\ldots ,J+1\}$
. On the other hand, if the respondent is assigned to the control group, the maximal value is
 $J$
, i.e.,
 $Y_{i}\in \{0,1,\ldots ,J\}$
. Furthermore, let
 $Z_{i}$
represent the latent binary variable indicating the affirmative answer to the sensitive question. If we use
 $Y_{i}^{\ast }$
to represent the total number of affirmative answers to the
 $J$
control questions, the observed response can be written as,
 $$\begin{eqnarray}\displaystyle Y_{i}=T_{i}Z_{i}+Y_{i}^{\ast }. & & \displaystyle\end{eqnarray}$$
In the early literature on list experiments, researchers estimated the proportion of respondents with the affirmative answer to the sensitive item using DiM, but could not characterize the respondents most likely to have the affirmative response. To overcome this challenge, Imai (Reference Imai2011) considers the following multivariate regression model,
 $$\begin{eqnarray}\displaystyle \mathbb{E}(Y_{i}\mid T_{i},X_{i})=T_{i}\mathbb{E}(Z_{i}\mid X_{i})+\mathbb{E}(Y_{i}^{\ast }\mid X_{i}) & & \displaystyle\end{eqnarray}$$
where the randomization of treatment assignment guarantees the following statistical independence relationships:
 $T_{i}\bot \!\!\!\bot Z_{i}\mid X_{i}$
and
 $T_{i}\bot \!\!\!\bot Y_{i}^{\ast }\mid X_{i}$
.
Although this formulation can accommodate various regression models, one simple parametric model, considered in Imai (Reference Imai2011), is the following binomial logistic regression model,
 $$\begin{eqnarray}\displaystyle Z_{i}\mid X_{i} & \stackrel{\text{indep.}}{{\sim}} & \displaystyle \text{Binom}(1,g(X_{i};\unicode[STIX]{x1D6FD}))\end{eqnarray}$$
 $$\begin{eqnarray}\displaystyle Y_{i}^{\ast }\mid X_{i} & \stackrel{\text{indep.}}{{\sim}} & \displaystyle \text{Binom}(J,f(X_{i};\unicode[STIX]{x1D6FE}))\end{eqnarray}$$
where
 $f(X_{i};\unicode[STIX]{x1D6FE})=\text{logit}^{-1}(X_{i}^{\top }\unicode[STIX]{x1D6FE})$
and
 $g(X_{i};\unicode[STIX]{x1D6FD})=\text{logit}^{-1}(X_{i}^{\top }\unicode[STIX]{x1D6FD})$
, implying the following regression functions,
 $\mathbb{E}(Y_{i}^{\ast }\mid X_{i})=J\cdot f(X_{i};\unicode[STIX]{x1D6FE})$
and
 $\mathbb{E}(Z_{i}\mid X_{i})=g(X_{i};\unicode[STIX]{x1D6FD})$
. Note that
 $\unicode[STIX]{x1D6FD}$
and
 $\unicode[STIX]{x1D6FE}$
represent vectors of regression coefficients.
Imai (Reference Imai2011) proposes two ways to estimate this multivariate regression model: nonlinear least squares (NLSreg) and maximum likelihood (MLreg) estimation. NLSreg is obtained by minimizing the sum of squared residuals based on equation (2).
 $$\begin{eqnarray}\displaystyle (\hat{\unicode[STIX]{x1D6FD}}_{\mathsf{NLS}},\hat{\unicode[STIX]{x1D6FE}}_{\mathsf{NLS}})=\underset{(\unicode[STIX]{x1D6FD},\unicode[STIX]{x1D6FE})}{\operatorname{argmin}}\mathop{\sum }_{i=1}^{N}\{Y_{i}-T_{i}\cdot g(X_{i};\unicode[STIX]{x1D6FD})-f(X_{i};\unicode[STIX]{x1D6FE})\}^{2} & & \displaystyle\end{eqnarray}$$
where
 $\hat{\unicode[STIX]{x1D6FD}}_{\mathsf{NLS}}$
and
 $\hat{\unicode[STIX]{x1D6FE}}_{\mathsf{NLS}}$
are the nonlinear least squares (NLS) estimates of the coefficients. NLSreg is consistent so long as the regression functions are correctly specified and does not require the distributions to be binomial. One can obtain more efficient estimates by relying on distributional assumptions. In particular, MLreg is obtained by maximizing the following log-likelihood function,
 $$\begin{eqnarray}\displaystyle (\hat{\unicode[STIX]{x1D6FD}}_{\mathsf{ML}},\hat{\unicode[STIX]{x1D6FE}}_{\mathsf{ML}}) & = & \displaystyle \underset{(\unicode[STIX]{x1D6FD},\unicode[STIX]{x1D6FE})}{\operatorname{argmax}}\mathop{\sum }_{i\in {\mathcal{J}}(1,0)}[\log \{1-g(X_{i};\unicode[STIX]{x1D6FD})\}+J\cdot \log \{1-f(X_{i};\unicode[STIX]{x1D6FE})\}]\nonumber\\ \displaystyle & & \displaystyle +\,\mathop{\sum }_{y=0}^{J}\mathop{\sum }_{i\in {\mathcal{J}}(0,y)}y\log f(X_{i};\unicode[STIX]{x1D6FE})+(J-y)\log \{1-f(X_{i};\unicode[STIX]{x1D6FE})\}\nonumber\\ \displaystyle & & \displaystyle +\,\mathop{\sum }_{i\in {\mathcal{J}}(1,J+1)}\left\{\log g(X_{i};\unicode[STIX]{x1D6FD})+J\log f(X_{i};\unicode[STIX]{x1D6FE})\right\}\nonumber\\ \displaystyle & & \displaystyle +\,\mathop{\sum }_{y=1}^{J}\mathop{\sum }_{i\in {\mathcal{J}}(1,y)}\log \left[g(X_{i};\unicode[STIX]{x1D6FD})\binom{J}{y-1}f(X_{i};\unicode[STIX]{x1D6FE})^{y-1}\{1-f(X_{i};\unicode[STIX]{x1D6FE})\}^{J-y+1}\right.\nonumber\\ \displaystyle & & \displaystyle \left.+\,\{1-g(X_{i};\unicode[STIX]{x1D6FD})\}\binom{J}{y}f(X_{i};\unicode[STIX]{x1D6FE})^{y}\{1-f(X_{i};\unicode[STIX]{x1D6FE})\}^{J-y}\right]\end{eqnarray}$$
where
 $\hat{\unicode[STIX]{x1D6FD}}_{\mathsf{ML}}$
and
 $\hat{\unicode[STIX]{x1D6FE}}_{\mathsf{ML}}$
are the maximum likelihood (ML) estimates of the coefficients and
 ${\mathcal{J}}(t,y)$
represents the set of respondents who have
 $T_{i}=t$
and
 $Y_{i}=y$
.
The choice between NLSreg and MLreg involves a fundamental tradeoff between bias and variance. MLreg is more efficient than NLSreg because the former makes additional distributional assumptions. In particular, MLreg models each cell of the observed response, including the
 $Y_{i}=J+1$
and
 $Y_{i}=0$
cells in the treatment group, which can greatly affect parameter estimates (Ahlquist Reference Ahlquist2018). In contrast, NLSreg only makes an assumption about the conditional mean functions and hence is more robust to measurement errors in specific cells. In line with these theoretical expectations, simulations in Ahlquist (Reference Ahlquist2018) report that DiM, which is a special case of NLSreg without covariates, is more robust for estimating the proportion of the sensitive trait than MLreg.
Two identification assumptions are required for DiM, NLSreg, and MLreg. First, respondents in the treatment group are assumed not to lie about the sensitive item, i.e., no liars. Any other behavior implies misreporting, and any estimator based on mismeasured responses is likely to be biased. The second assumption is that respondents’ answers to the control items are not affected by the treatment, i.e., no design effect. Because list experiments rely upon the comparison of responses between the treatment and control groups, responses to the control items must remain identical in expectation between the two groups. The violation of this assumption also leads to mismeasured responses, yielding biased estimates. We emphasize that DiM is a special case of NLSreg and is not exempt from these assumptions. In Appendix A, we prove that DiM is biased under top-biased and uniform error. The bias is large when the prevalence of the sensitive trait is small. NLSreg adds an assumption about the correctly specified regression function and MLreg imposes an additional distributional assumption.
The main difficulty of multivariate regression analysis for list experiments stems from the fact that the response to the sensitive item is not observed except for the respondents in the treatment group who choose the maximal or minimal response. Regression analysis under this circumstance is more challenging than when the outcome is directly observed. If the sensitive trait of interest is a rare event, then MLreg is likely to suffer from bias. Such bias is known to exist even when the outcome variable is observed (King and Zeng Reference King and Zeng2001), and is likely to be amplified for list experiments. In addition, dealing with measurement error will also be more difficult when the outcome variable is not directly observed. Below, we consider several methodological strategies for addressing this issue.
2.2 Strategic and Nonstrategic Measurement Errors
Researchers most often use indirect questioning techniques to study sensitive topics, which present respondents with strong incentives to disguise the truth. For this reason, much of the existing literature on list experiments has been rightly concerned with mitigating strategic measurement error, particularly floor and ceiling effects (e.g., Blair and Imai Reference Blair and Imai2012; Glynn Reference Glynn2013). These errors arise because the list experiment fails to mask the sensitive trait for respondents whose truthful response under treatment occupies the floor or ceiling cells.
Although the literature has provided many tools for ameliorating such bias, much less attention has been paid to nonstrategic measurement error, arising for example from poor survey implementation or respondent inattention. Because these behaviors run against the assumptions of the estimators described in Section 2.1, it is no surprise that they can induce similar forms of bias. Illustrating this point, Ahlquist (Reference Ahlquist2018) examines a specific nonstrategic error mechanism—called top-biased error, where a random fraction of respondents provide the maximal response value regardless of their truthful answer to the sensitive question—and demonstrates that MLreg can be severely biased under this error mechanism.
Although we provide the tools to diagnose and correct this and other nonstrategic measurement error mechanisms below, we are skeptical that top-biased error is common in practice, at least for truly sensitive questions. The reason is that under the treatment condition, giving the maximal value reveals that the respondent answers the sensitive question affirmatively. This implies, for example, that respondents are willing to admit engaging in such sensitive behaviors as drug use and tax evasion or having socially undesirable attitudes such as gender and racial prejudice. This scenario is unlikely so long as the behavior or attitudes researchers are trying to measure are actually sensitive.
In our experience, when answering truly sensitive questions, respondents typically avoid reporting the extreme values (rather than gravitating toward them as assumed under the top-biased error mechanism). As an example of this phenomenon, we present a list experiment conducted by Lyall, Blair, and Imai (Reference Lyall, Blair and Imai2013) in the violent heart of Taliban-controlled Afghanistan, which was designed for estimating the level of support for the Taliban. The control group was given the following script (
 $J=3$
):
I’m going to read you a list with the names of different groups and individuals on it. After I read the entire list, I’d like you to tell me how many of these groups and individuals you broadly support, meaning that you generally agree with the goals and policies of the group or individual. Please don’t tell me which ones you generally agree with; only tell me how many groups or individuals you broadly support.
Karzai Government; National Solidarity Program; Local Farmers
For the treatment group, the sensitive actor, i.e., the Taliban, is added.
Karzai Government; National Solidarity Program; Local Farmers; Taliban
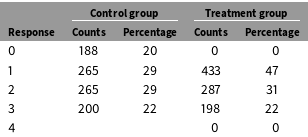
Table 1 presents descriptive information, which shows clear evidence of floor and ceiling effects. Indeed, no respondent gave an answer of 0 or 4. By avoiding the extreme responses of 0 and 4, respondents in the treatment group are able to remain ambiguous as to whether they support or oppose the Taliban. This strategic measurement error may have arisen in part because of the public nature of interview. As explained in Lyall, Blair, and Imai (Reference Lyall, Blair and Imai2013), interviewers are required to ask survey questions to respondents in public while village elders watch and listen. Under this circumstance, it is no surprise that respondents try to conceal their truthful answers. Because of this sensitivity, the authors of the original study used endorsement experiments (Bullock, Imai, and Shapiro Reference Bullock, Imai and Shapiro2011), which represent a more indirect questioning technique, in order to measure the level of support for the Taliban. On the other hand, Blair, Imai, and Lyall (Reference Blair, Imai and Lyall2014) find that in the same survey the list experiment works well for measuring the level of support for the coalition International Security Assistance Force, which is a less sensitive actor to admit support or lack thereof for than is the Taliban.
2.3 Detecting Measurement Error
Although researchers are unlikely to know the magnitude of measurement error, whether strategic or not, we can sometimes detect measurement error from data. In addition to the tests developed by Blair and Imai (Reference Blair and Imai2012) and Aronow et al. (Reference Aronow, Coppock, Crawford and Green2015), we extend and formalize the recommendation by Ahlquist (Reference Ahlquist2018) to compare the results of multiple models to assess their robustness to measurement error. We focus on comparisons between MLreg and NLSreg, in order to focus on comparisons of the quantity of interest most commonly used by applied researchers.
We employ a general specification test due to Hausman (Reference Hausman1978) as a formal means of comparison between MLreg and NLSreg, both of which are designed to examine the multivariate relationships between the sensitive trait and respondents’ characteristics. The idea is that if the regression modeling assumptions are correct, then NLSreg and MLreg should yield statistically indistinguishable results. If their differences are significant, we reject the null hypothesis of correct specification. Note that model misspecification can arise for various reasons, with measurement error being one possibility. Furthermore, the test assumes the linear regression specification shared across NLSreg and MLreg. Then the test statistic and its asymptotic distribution are given by,
 $$\begin{eqnarray}\displaystyle (\hat{\unicode[STIX]{x1D703}}_{\text{ML}}-\hat{\unicode[STIX]{x1D703}}_{\text{NLS}})^{\top }(\widehat{\mathbb{V}(\hat{\unicode[STIX]{x1D703}}_{\text{NLS}})}-\widehat{\mathbb{V}(\hat{\unicode[STIX]{x1D703}}_{\text{ML}})})^{-1}(\hat{\unicode[STIX]{x1D703}}_{\text{ML}}-\hat{\unicode[STIX]{x1D703}}_{\text{NLS}})^{\top }\stackrel{\text{approx.}}{{\sim}}\unicode[STIX]{x1D712}_{\text{dim}(\unicode[STIX]{x1D6FD})+\text{dim}(\unicode[STIX]{x1D6FE})}^{2} & & \displaystyle\end{eqnarray}$$
where
 $\hat{\unicode[STIX]{x1D703}}_{\text{NLS}}=(\hat{\unicode[STIX]{x1D6FD}}_{\text{NLS}},\hat{\unicode[STIX]{x1D6FE}}_{\text{NLS}})$
and
 $\hat{\unicode[STIX]{x1D703}}_{\text{ML}}=(\hat{\unicode[STIX]{x1D6FD}}_{\text{ML}},\hat{\unicode[STIX]{x1D6FE}}_{\text{ML}})$
are the NLS and ML estimators and
 $\widehat{\mathbb{V}(\hat{\unicode[STIX]{x1D703}}_{\text{NLS}})}$
and
 $\widehat{\mathbb{V}(\hat{\unicode[STIX]{x1D703}}_{\text{ML}})}$
are their estimated asymptotic variances. We view this test as a logical extension and formalization of the recommendation in Ahlquist (Reference Ahlquist2018) to compare the results from DiM and
MLreg.
An Example of Floor and Ceiling Effects from the List Experiment in Afghanistan Reported in Lyall, Blair, and Imai (Reference Lyall, Blair and Imai2013). No respondent in the treatment group gave an answer of 0 or 4, suggesting that the respondents were avoiding revealing whether they support the Taliban.

2.4 Modeling Measurement Error Mechanisms
One advantage of the multivariate regression framework proposed in Imai (Reference Imai2011) is its ability to directly model measurement error mechanisms, an approach which has demonstrated its value in a variety of contexts (see e.g., Carroll et al. Reference Carroll, Ruppert, Stefanski and Crainiceanu2006), including list experiments (Blair and Imai Reference Blair and Imai2012; Chou Reference Chou2018). Measurement error models strike a valuable middle ground between MLreg and NLSreg. First, these models include the model without measurement error as their limiting case, requiring fewer and weaker assumptions than standard models. As a result, we can apply the specification test as shown for NLSreg and MLreg above. Second, these models can be used to check the robustness of empirical results to measurement error. Third, researchers can use these models to test the mechanisms of survey misreporting in order to understand when list experiments do and do not work.
Although we believe that top-biased error is unlikely to obtain in applied settings, we show how to model this error process as an illustration of how our modeling framework can flexibly incorporate various measurement error mechanisms. We then show how to model uniform error in which “a respondent’s truthful response is replaced by a random uniform draw from the possible answers available to her, which in turn depends on her treatment status” (Ahlquist Reference Ahlquist2018, p. 5). We think that this uniform response error process is more realistic and hence the proposed uniform error model will be useful for applied researchers. As shown in Appendix A, DiM is biased under these error processes.
Top-biased error. Under top-biased error, for the NLS estimation, equation (2) becomes,
 $$\begin{eqnarray}\displaystyle \mathbb{E}(Y_{i}\mid T_{i},X_{i}) & = & \displaystyle pJ+T_{i}\{p+(1-p)\mathbb{E}(Z_{i}\mid X_{i})\}+(1-p)\mathbb{E}(Y_{i}^{\ast }\mid X_{i})\end{eqnarray}$$
where
 $p$
is the additional parameter representing the population proportion of respondents who give the maximal value as their answer. When
 $p=0$
the model reduces to the standard model given in equation (2). The NLS estimator is obtained by minimizing the sum of squared error,
 $$\begin{eqnarray}(\hat{\unicode[STIX]{x1D6FD}}_{\text{NLS}},\hat{\unicode[STIX]{x1D6FE}}_{\text{NLS}})=\underset{(\unicode[STIX]{x1D6FD},\unicode[STIX]{x1D6FE},p)}{\operatorname{argmin}}\mathop{\sum }_{i=1}^{N}[Y_{i}-pJ-T_{i}\{p+(1-p)\mathbb{E}(Z_{i}\mid X_{i})\}-(1-p)\mathbb{E}(Y_{i}^{\ast }\mid X_{i})]^{2}.\end{eqnarray}$$
We can also model top-biased error using the following likelihood function,
 $$\begin{eqnarray}\displaystyle & & \displaystyle \mathop{\prod }_{i\in {\mathcal{J}}(1,J+1)}[g(X_{i};\unicode[STIX]{x1D6FD})f(X_{i};\unicode[STIX]{x1D6FE})^{J}+p\{1-g(X_{i};\unicode[STIX]{x1D6FD})f(X_{i};\unicode[STIX]{x1D6FE})^{J}\}]\mathop{\prod }_{i\in {\mathcal{J}}(0,J)}[f(X_{i};\unicode[STIX]{x1D6FE})^{J}+p\{1-f(X_{i};\unicode[STIX]{x1D6FE})^{J}\}]\nonumber\\ \displaystyle & & \displaystyle \mathop{\prod }_{i\in {\mathcal{J}}(1,0)}(1-p)\{1-g(X_{i};\unicode[STIX]{x1D6FD})\}\{1-f(X_{i};\unicode[STIX]{x1D6FE})\}^{J}\mathop{\prod }_{y=0}^{J-1}\mathop{\prod }_{i\in {\mathcal{J}}(0,y)}(1-p)\binom{J}{y}f(X_{i};\unicode[STIX]{x1D6FE})^{y}\{1-f(X_{i};\unicode[STIX]{x1D6FE})\}^{J-y}\nonumber\\ \displaystyle & & \displaystyle \mathop{\prod }_{y=1}^{J}\mathop{\prod }_{i\in {\mathcal{J}}(1,y)}(1-p)\left[g(X_{i};\unicode[STIX]{x1D6FD})\binom{J}{y-1}f(X_{i};\unicode[STIX]{x1D6FE})^{y-1}\{1-f(X_{i};\unicode[STIX]{x1D6FE})\}^{J-y+1}\right.\nonumber\\ \displaystyle & & \displaystyle \left.\qquad +\,\{1-g(X_{i};\unicode[STIX]{x1D6FD})\}\binom{J}{y}f(X_{i};\unicode[STIX]{x1D6FE})^{y}\{1-f(X_{i};\unicode[STIX]{x1D6FE})\}^{J-y}\right].\end{eqnarray}$$
Again, when
 $p=0$
, this likelihood function reduces to the likelihood function of the original model, which is given on the logarithmic scale in equation (6). While this likelihood function is too complex to optimize, we can use the expectation–maximization (EM) algorithm (Dempster, Laird, and Rubin Reference Dempster, Laird and Rubin1977) to maximize it. The details of this algorithm are given in Appendix B.1.
Uniform error. Under the uniform error mechanism, we modify the regression model given in equation (2) to the following,
 $$\begin{eqnarray}\displaystyle \mathbb{E}(Y_{i}\mid T_{i},X_{i}) & = & \displaystyle \frac{p_{0}(1-T_{i})J}{2}+T_{i}\left\{\frac{p_{1}(J+1)}{2}+(1-p_{1})\mathbb{E}(Z_{i}\mid X_{i})\right\}\nonumber\\ \displaystyle & & \displaystyle +\,\{(1-T_{i})(1-p_{0})+T_{i}(1-p_{1})\}\mathbb{E}(Y_{i}^{\ast }\mid X_{i})\end{eqnarray}$$
where
 $p_{t}=\Pr (S_{i}\mid T_{i}=t)$
represents the proportion of misreporting individuals under the treatment condition
 $T_{i}=t$
. Again, when
 $p_{0}=p_{1}=0$
, this model reduces to the original model without measurement error. As before, we can obtain the NLS estimator by minimizing the sum of squared error. We can also formulate the ML estimator using the following likelihood function,
 $$\begin{eqnarray}\displaystyle & & \displaystyle \mathop{\prod }_{i\in {\mathcal{J}}(1,J+1)}\left\{(1-p_{1})g(X_{i};\unicode[STIX]{x1D6FD})f(X_{i};\unicode[STIX]{x1D6FE})^{J}+\frac{p_{1}}{J+2}\right\}\nonumber\\ \displaystyle & & \displaystyle \mathop{\prod }_{i\in {\mathcal{J}}(1,0)}\left\{(1-p_{1})\{1-g(X_{i};\unicode[STIX]{x1D6FD})\}\{1-f(X_{i};\unicode[STIX]{x1D6FE})\}^{J}+\frac{p_{1}}{J+2}\right\}\nonumber\\ \displaystyle & & \displaystyle \mathop{\prod }_{y=0}^{J}\mathop{\prod }_{i\in {\mathcal{J}}(0,y)}\left\{(1-p_{0})\binom{J}{y}f(X_{i};\unicode[STIX]{x1D6FE})^{y}\left\{1-f(X_{i};\unicode[STIX]{x1D6FE})\right\}^{J-y}+\frac{p_{0}}{J+1}\right\}\nonumber\\ \displaystyle & & \displaystyle \mathop{\prod }_{y=1}^{J}\mathop{\prod }_{i\in {\mathcal{J}}(1,y)}\left[(1-p_{1})\left\{g(X_{i};\unicode[STIX]{x1D6FD})\binom{J}{y-1}f(X_{i};\unicode[STIX]{x1D6FE})^{y-1}\left\{1-f(X_{i};\unicode[STIX]{x1D6FE})\right\}^{J-y+1}\right.\right.\nonumber\\ \displaystyle & & \displaystyle \left.\left.\qquad +\,\{1-g(X_{i};\unicode[STIX]{x1D6FD})\}\binom{J}{y}f(X_{i};\unicode[STIX]{x1D6FE})^{y}\left\{1-f(X_{i};\unicode[STIX]{x1D6FE})\right\}^{J-y}\right\}+\frac{p_{1}}{J+2}\right].\end{eqnarray}$$
As shown in Appendix B.2, the EM algorithm can be used to obtain the ML estimator.
2.5 Robust Multivariate Regression Models
As another approach, we also show how to conduct multivariate regression analysis while ensuring that the estimated proportion of the sensitive trait is close to DiM. To do this, we follow Chou, Imai, and Rosenfeld (Reference Chou, Imai and Rosenfeld2017), who show how to incorporate available auxiliary information such as the aggregate prevalence of sensitive traits when fitting regression models. The authors find that supplying aggregate truths significantly improves the accuracy of list experiment regression models. Adopting this strategy, we fit the multivariate regression models such that they give an overall prediction of sensitive trait prevalence consistent with DiM. To the extent that DiM rests on weaker assumptions, this modeling strategy may improve the robustness of the multivariate regression models.
Specifically, we use the following additional moment condition,
 $$\begin{eqnarray}\displaystyle \mathbb{E}\{g(X_{i};\unicode[STIX]{x1D6FD})\}=\mathbb{E}\left\{\frac{\mathop{\sum }_{i=1}^{N}T_{i}Y_{i}}{\mathop{\sum }_{i=1}^{N}T_{i}}-\frac{\mathop{\sum }_{i=1}^{N}(1-T_{i})Y_{i}}{\mathop{\sum }_{i=1}^{N}(1-T_{i})}\right\}. & & \displaystyle\end{eqnarray}$$
For the NLS estimation, we combine this moment condition with the following first order conditions from the two-step NLS estimation.
 $$\begin{eqnarray}\displaystyle \mathbb{E}\left[T_{i}\{Y_{i}-f(X_{i};\unicode[STIX]{x1D6FE})-g(X_{i};\unicode[STIX]{x1D6FD})\}g^{\prime }(X_{i};\unicode[STIX]{x1D6FD})\right] & = & \displaystyle 0\end{eqnarray}$$
 $$\begin{eqnarray}\displaystyle \mathbb{E}\left[(1-T_{i})\{Y_{i}-f(X_{i};\unicode[STIX]{x1D6FE})\}f^{\prime }(X_{i};\unicode[STIX]{x1D6FE})\right] & = & \displaystyle 0\end{eqnarray}$$
where
 $f^{\prime }(X_{i};\unicode[STIX]{x1D6FE})$
and
 $g^{\prime }(X_{i};\unicode[STIX]{x1D6FD})$
are the gradient vectors with respect to
 $\unicode[STIX]{x1D6FE}$
and
 $\unicode[STIX]{x1D6FD}$
, respectively. Altogether, the moments form a generalized method of moments (GMM) estimator. In fact, we can use the same exact setup Chou, Imai, and Rosenfeld (Reference Chou, Imai and Rosenfeld2017) and use their code in the list package in R to obtain the NLS estimator with this additional constraint, although the standard errors must be adjusted as the auxiliary constraint does not provide additional information.
We can also incorporate the constraint in equation (13) in the ML framework. To do this, we combine the score conditions obtained from the log-likelihood function with this additional moment condition. Then, the GMM estimator can be constructed using all the moment conditions. The details of this approach are given in Appendix B.3.
3 Simulation Studies
How do the methods we introduce above fare in estimating common quantities of interest for the list experiment in the presence of measurement error? In this section, we build on the simulation study presented in Ahlquist (Reference Ahlquist2018) and examine the performance of the DiM and MLreg but also the NLSreg introduced in Imai (Reference Imai2011) and the robust models introduced in Section 2. We examine the performance for two common estimands: the sensitive item proportion, which on theoretical grounds we recommend be primarily estimated using the DiM; and the relationship between the sensitive item and covariates. For comparability, we rely on the simulation settings in Ahlquist (Reference Ahlquist2018) and examine whether the theoretical properties of the estimators hold in the presence of top-biased error and uniform error.
Ahlquist (Reference Ahlquist2018) finds that MLreg is more sensitive to top-biased error than DiM. The paper also reports that the degree of sensitivity increases when the prevalence of the sensitive trait is low and the control items are negatively correlated with each other. Below, we show that our statistical test, developed in Section 2.3, can detect the misspecified data-generating process used in Ahlquist (Reference Ahlquist2018). We show that NLSreg is robust to these types of model misspecification. Although we confirm that MLreg is sensitive to top-biased error, we find that it is more robust to uniform error. Finally, we find that the new ML estimators proposed above perform reasonably well in the presence of response errors, especially when the sensitive trait is sufficiently common.
3.1 Simulation Settings
We begin by replicating the “designed list” simulation scenario, which Ahlquist (Reference Ahlquist2018) found to be most problematic for MLreg.Footnote 1 In addition to the introduction of top-biased error, this simulation scenario violates the assumptions of MLreg in two ways. First, Ahlquist follows the advice of Glynn (Reference Glynn2013) and generates a negative correlation among the control items. By contrast, MLreg assumes conditional independence of the control items. Second, control items are generated with different marginal probabilities, which is also inconsistent with the binomial distribution.Footnote 2
The data-generating process for these problematic “designed” lists is as follows. For the control outcome
 $Y_{i}^{\ast }$
, the marginal probabilities are fixed for each control item. For the simulations with
 $J=3$
control items, the probabilities of latent binary responses are specified to be
 $(0.5,0.5,0.15)$
, whereas in the simulations with
 $J=4$
, the study uses
 $(0.5,0.5,0.15,0.85)$
. The rmvbin() function in the R package bindata is used to generate the latent responses to the control items such that the correlation between the first two items is negative 0.6. To generate the sensitive trait,
 $Z_{i}$
, first a single covariate,
 $X_{i}$
, is sampled independently from the uniform distribution for each observation
 $i=1,2,\ldots ,N$
. Together with an intercept, we form the model matrix
 $\mathbf{X}_{i}=(1,X_{i})$
. The sensitive trait is then drawn according to the logistic regression given in equation (3). The coefficients are set to
 $\unicode[STIX]{x1D6FD}=(0,-4)$
corresponding to the prevalence of the sensitive trait approximately equal to
 $0.12$
. Finally, we assign the half of the sample to the treatment group (
 $T_{i}=1$
) and the other half to the control group (
 $T_{i}=0$
). The outcome variable then is generated according to equation (1). We conduct 1,000 simulations with these parameters.
To introduce top-biased error, Ahlquist (Reference Ahlquist2018) uses complete randomization to select 3% of the sample and changes the outcome variable
 $Y_{i}$
to
 $J+1$
(
 $J$
) if observation is assigned to the treatment (control) group, independently of the values of
 $\mathbf{X}_{i}$
,
 $Y_{i}^{\ast }$
, and
 $Z_{i}$
. To generate uniform error, 3% of the observations are similarly sampled, but are assigned their outcome variable with uniform probability to one of the
 $J+2$
(
 $J+1$
) possible values, depending on their treatment status. We follow these procedures in our simulations.
3.2 Detecting Model Misspecification
Given the discrepancies between this data-generating process and the process assumed by MLreg, MLreg is shown to be severely biased by these procedures (Ahlquist Reference Ahlquist2018). However, as explained in Section 2.1, NLSreg should be more robust than MLreg, though it is less efficient. This bias-variance tradeoff arises because NLSreg does not assume the binomial distribution for the control items. Under the assumptions of NLSreg, the control items can be arbitrarily correlated and have different marginal probabilities (although a specific functional form—here, the logistic function—is assumed for the conditional expectation). This implies that NLSreg should only be subject to the potential bias from response error.
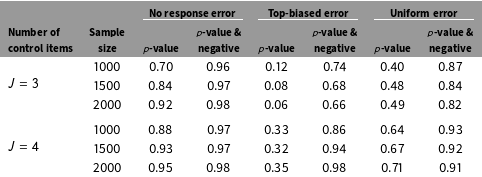
This theoretical expectation suggests that the Hausman test proposed in Section 2.3 may be able to detect departures from the modeling assumptions. We find that this is indeed the case. Table 2 shows that our test diagnoses the inconsistency of MLreg in the presence of such severe model misspecification. The table presents the rejection rate for our simulations at different combinations of
 $J$
and
 $N$
with a
 $p$
-value of 0.1 as the threshold. As the “
 $p$
-value” columns show, we find sufficiently large (and positive) test statistics to reject the null hypothesis of no misspecification in a large proportion of trials, especially when there is no response error. The finding is consistent with substantial model misspecification, in excess of response error, introduced by the designed list procedure in Ahlquist (Reference Ahlquist2018). Interestingly, the top-biased error appears to mask this misspecification.
Results of the Model Misspecification Test for the Designed List Simulations. The proportions rejecting the null hypothesis of no model misspecification are shown. The “
 $p$
-value” column is based on the standard Hausman test with a
 $p$
-value of 0.1 as the threshold, while the “
 $p$
-value & negative” column is based on the combined rejection criteria where we reject the null hypothesis if the
 $p$
-value is less than 0.1 or the test statistic takes a negative value.

Importantly, we discovered that in all cases a large proportion of the trials yielded a negative value of the test statistic, which corresponds to extremely poor fit of MLreg relative to NLSreg. Such values are only consistent with model misspecification so long as the test is sufficiently powered (Schreiber Reference Schreiber2008). While the test statistic can by chance take a negative value in a finite sample, in our simulations such statistics are strikingly prevalent. As shown in the “
 $p$
-value & negative” columns of the table, by using a negative or large positive test statistic as the criterion for rejection, we obtain a much more powerful test for misspecification even in the case of top-biased error. Although this test may be conservative, leading to overrejection of the null hypothesis, the fact that these rejection rates are large even when the sample size is moderate suggests that the test is well powered in this simulation study.
In sum, the proposed model misspecification test readily diagnoses the designed list misspecification studied in Ahlquist (Reference Ahlquist2018). Although the test may not work in all settings, we find here that it detects the significant problems in the designed lists simulations at a high rate.
3.3 Robustness of the Nonlinear Least Squares Regression Estimator
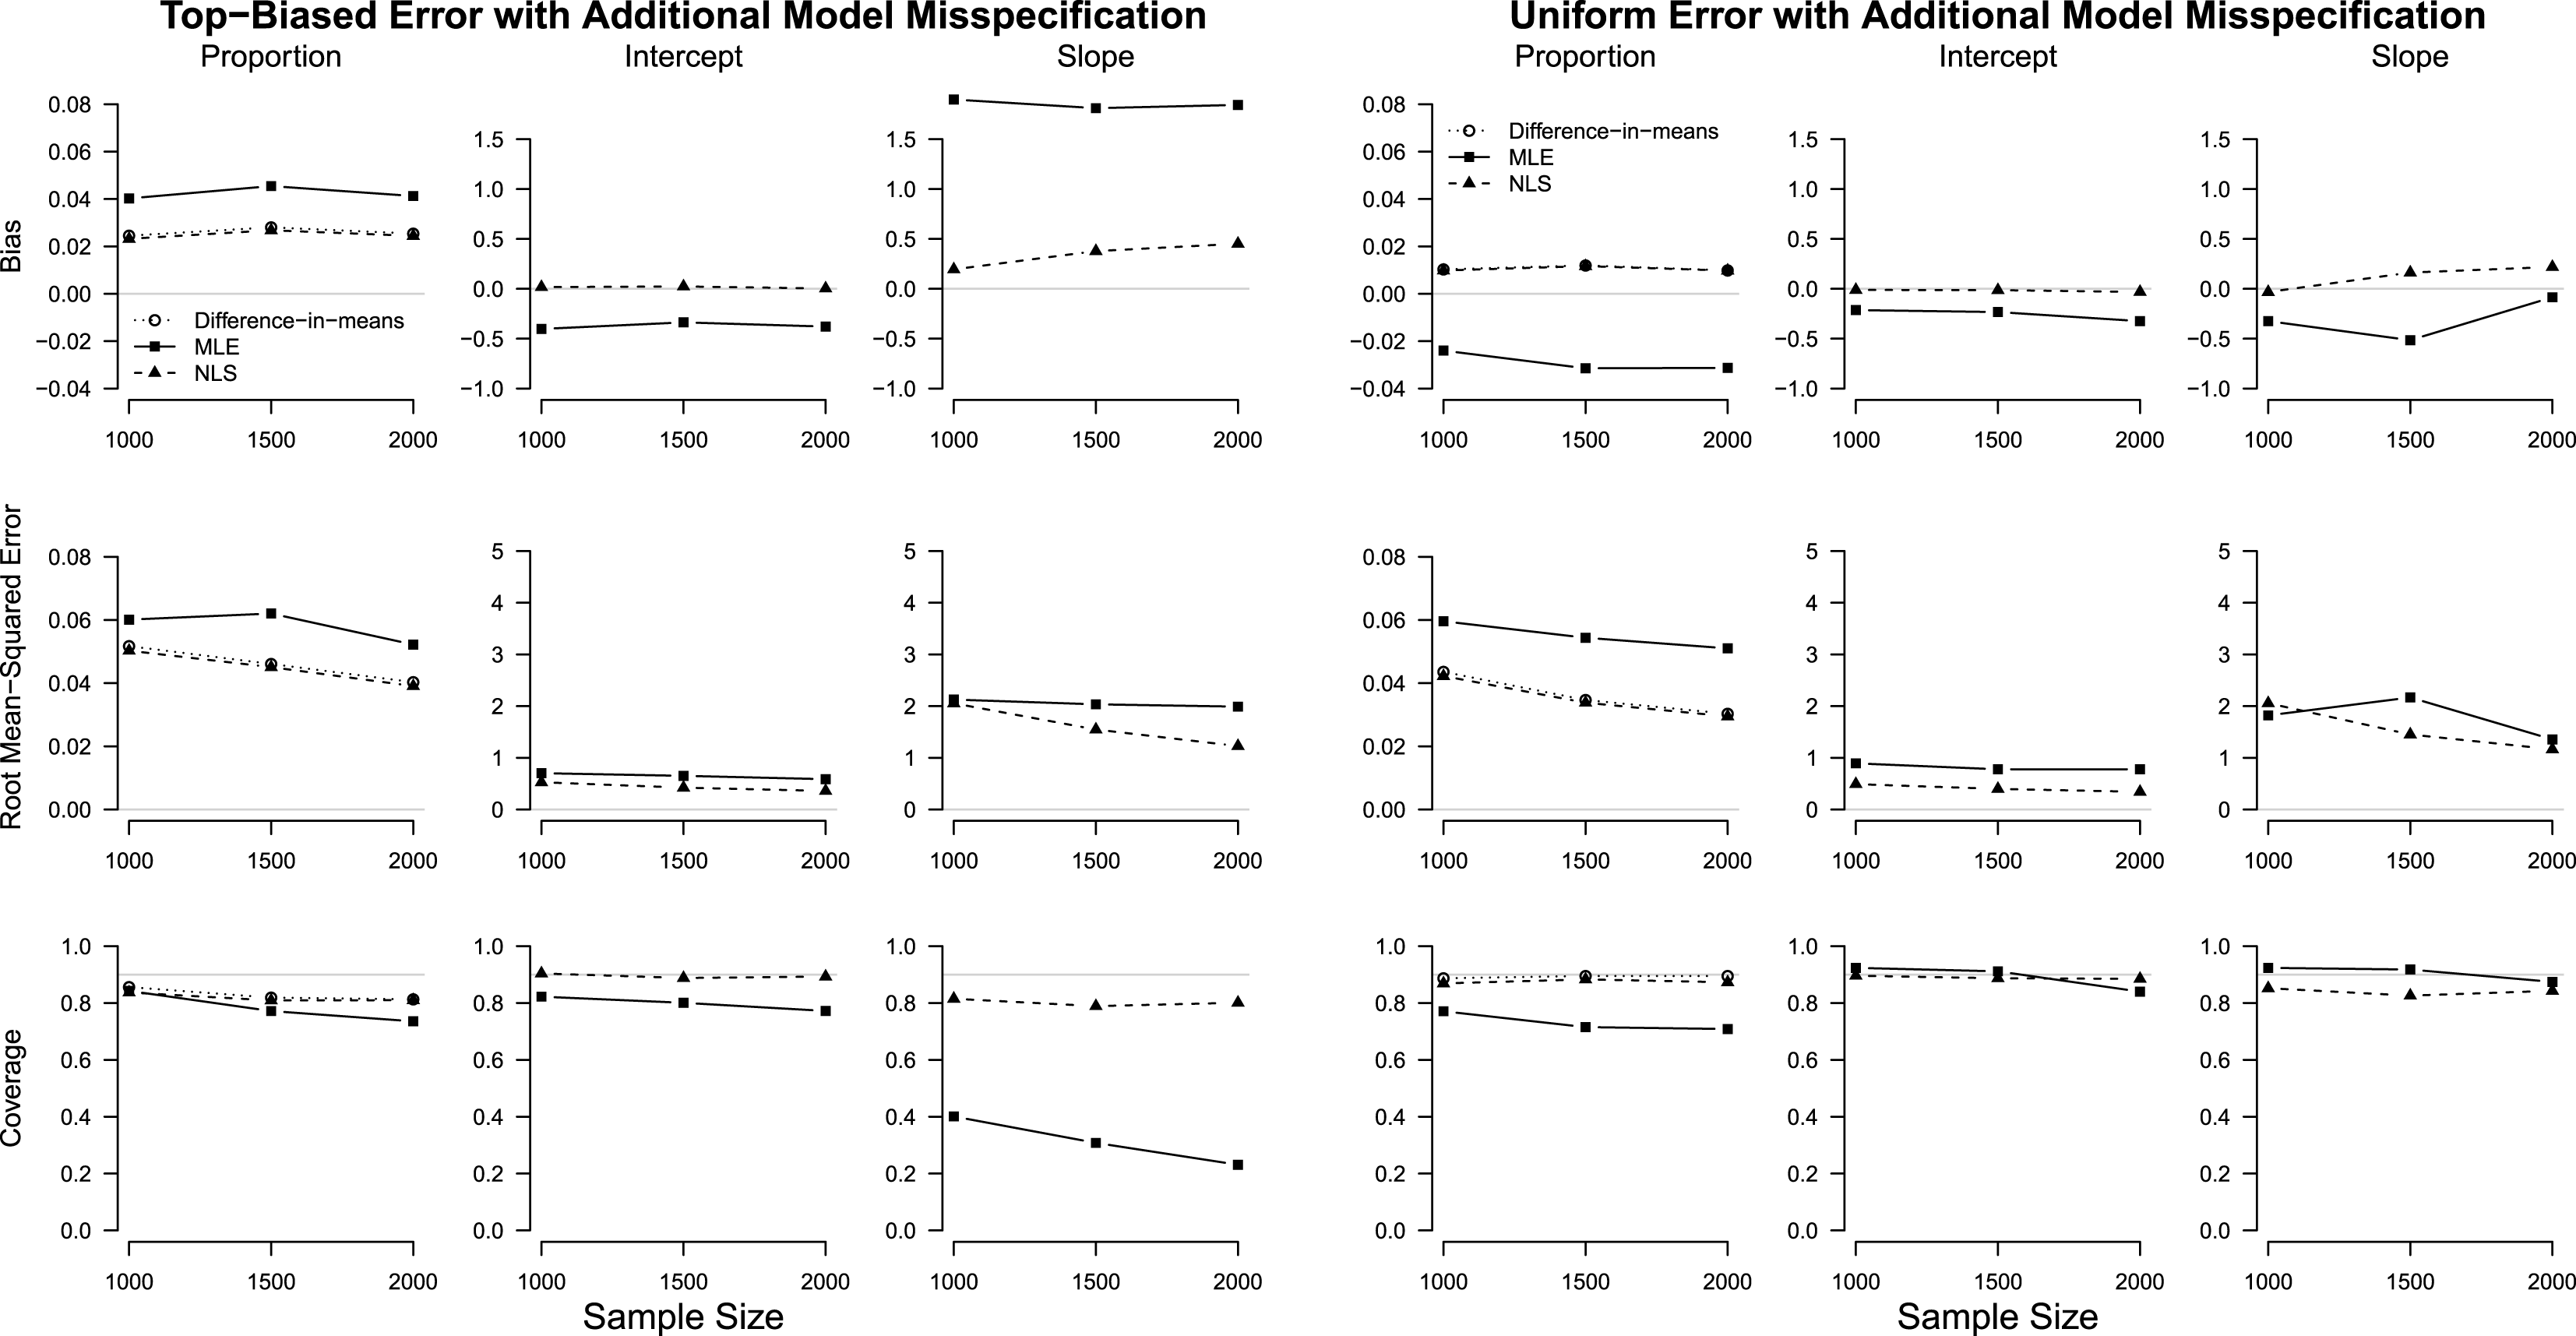
Our second main finding is that NLSreg is robust to these misspecifications. This fortifies our previous result that the model misspecification test, which is based on the divergence between NLSreg and MLreg, is effective for diagnosing model misspecification. To illustrate the robustness of NLSreg, in Figure 1, we present the bias, root-mean-squared error (RMSE), and the coverage of 90% confidence intervals of our estimates of the population prevalence of the sensitive trait. We also present results for MLreg, filtered using the
 $p$
-value plus negative value criterion for rejection described above.Footnote
3
Last, given the goals of multivariate regression, we also compute these statistics for the estimated coefficients.
Robustness of the Nonlinear Least Squares Regression Estimator in the Presence of Several Model Misspecifications Considered in Ahlquist (Reference Ahlquist2018). We consider the three estimators of the prevalence of the sensitive trait: the DiM estimator (open circle with dotted line), the ML regression estimator (solid square with solid line; filtered by the model misspecification test using the combined criteria), and the NLS estimator (solid triangle with dashed line). The result shows that the NLS regression estimator is as robust as the DiM estimator.

Figure 1 shows the results for
 $J=3$
control items for top-biased error (left three columns) and uniform error (right three columns). Given space limitations, the analogous figure for
 $J=4$
control items is shown in Figure 2 in the Supplementary Appendix. We include the two estimators considered in Ahlquist (Reference Ahlquist2018): DiM and MLreg (solid square with solid line), as well as the NLSreg estimator proposed in Imai (Reference Imai2011) (solid triangle with dashed line). Our main finding here is that NLSreg is robust to all of these model misspecifications, doing as well as DiM. This is consistent with our prior expectation: DiM is a special case of NLSreg.
Although filtering based on the model misspecification test addresses the overestimation of the sensitive trait under top-biased error observed in Ahlquist (Reference Ahlquist2018), we note that MLreg does not perform well for the estimation of the coefficients, nor does it improve inference for the prevalence of the sensitive trait under uniform error. However, as Table 2 showed, these results are based on the small fraction of trials that did not result in a negative or large positive test statistic. In such trials, the NLS estimates were also inaccurate due to sampling error. This suggests that, while our proposed statistical test will often be able to detect misspecification in practice, in the instances where it does not, NLSreg (and, by extension, DiM) will also be biased.
The results confirm our theoretical expectation that NLSreg is robust to various types of misspecification. As a final point, we note that our simulation results, based on the grossly misspecified data-generating process described above, do not necessarily imply that MLreg will perform badly for designed lists. The simulation settings we adapted from Ahlquist (Reference Ahlquist2018) are not realistic. They imply, for example, that the individual covariates have no predictive power for responses to the control items. Furthermore, our model misspecification test is able to detect the distributional misspecification in these simulations. Thus, in practice, such a misspecification will often be apparent from the divergence of the NLSreg and MLreg results.
3.4 Addressing Response Error
The simulation settings adopted above include several violations of the modeling assumptions, including correlation between control items, varying control item propensities, model misspecification, and measurement error. As such, it is difficult to disentangle which model misspecifications, or combination of them, are affecting the performance of different methods. In this section, we focus on assessing the impacts of top-biased and uniform error processes and examine how the multivariate models proposed in Section 2 can address them. To be sure, applied researchers will rarely know which (if any) of these mechanisms characterize their data. Nevertheless, we show here that these methods can eliminate these errors when they arise, and illustrate in Section 4 how they can be used to assess the robustness of empirical results.
To isolate the effects of measurement errors, we develop a data-generating process that assumes no other model misspecification. First, we draw the latent response to the sensitive item
 $Z_{i}$
and the control items
 $Y_{i}^{\ast }$
according to the model defined in equations (3) and (4). Following Ahlquist (Reference Ahlquist2018), we set the true values of the coefficients for the control items to
 $\unicode[STIX]{x1D6FE}$
to
 $(0,1)$
, corresponding to a conditional mean of observed response about
 $J\times 0.62$
, whereas the coefficients for the sensitive item are set to
 $\unicode[STIX]{x1D6FD}=(0,-4)$
, generating a low propensity of approximately
 $0.12$
. In the Supplementary Appendix, we present a high propensity scenario of about 0.38. Last, we introduce each response error using the same procedure described earlier. We conduct 5,000 simulations with these parameters.
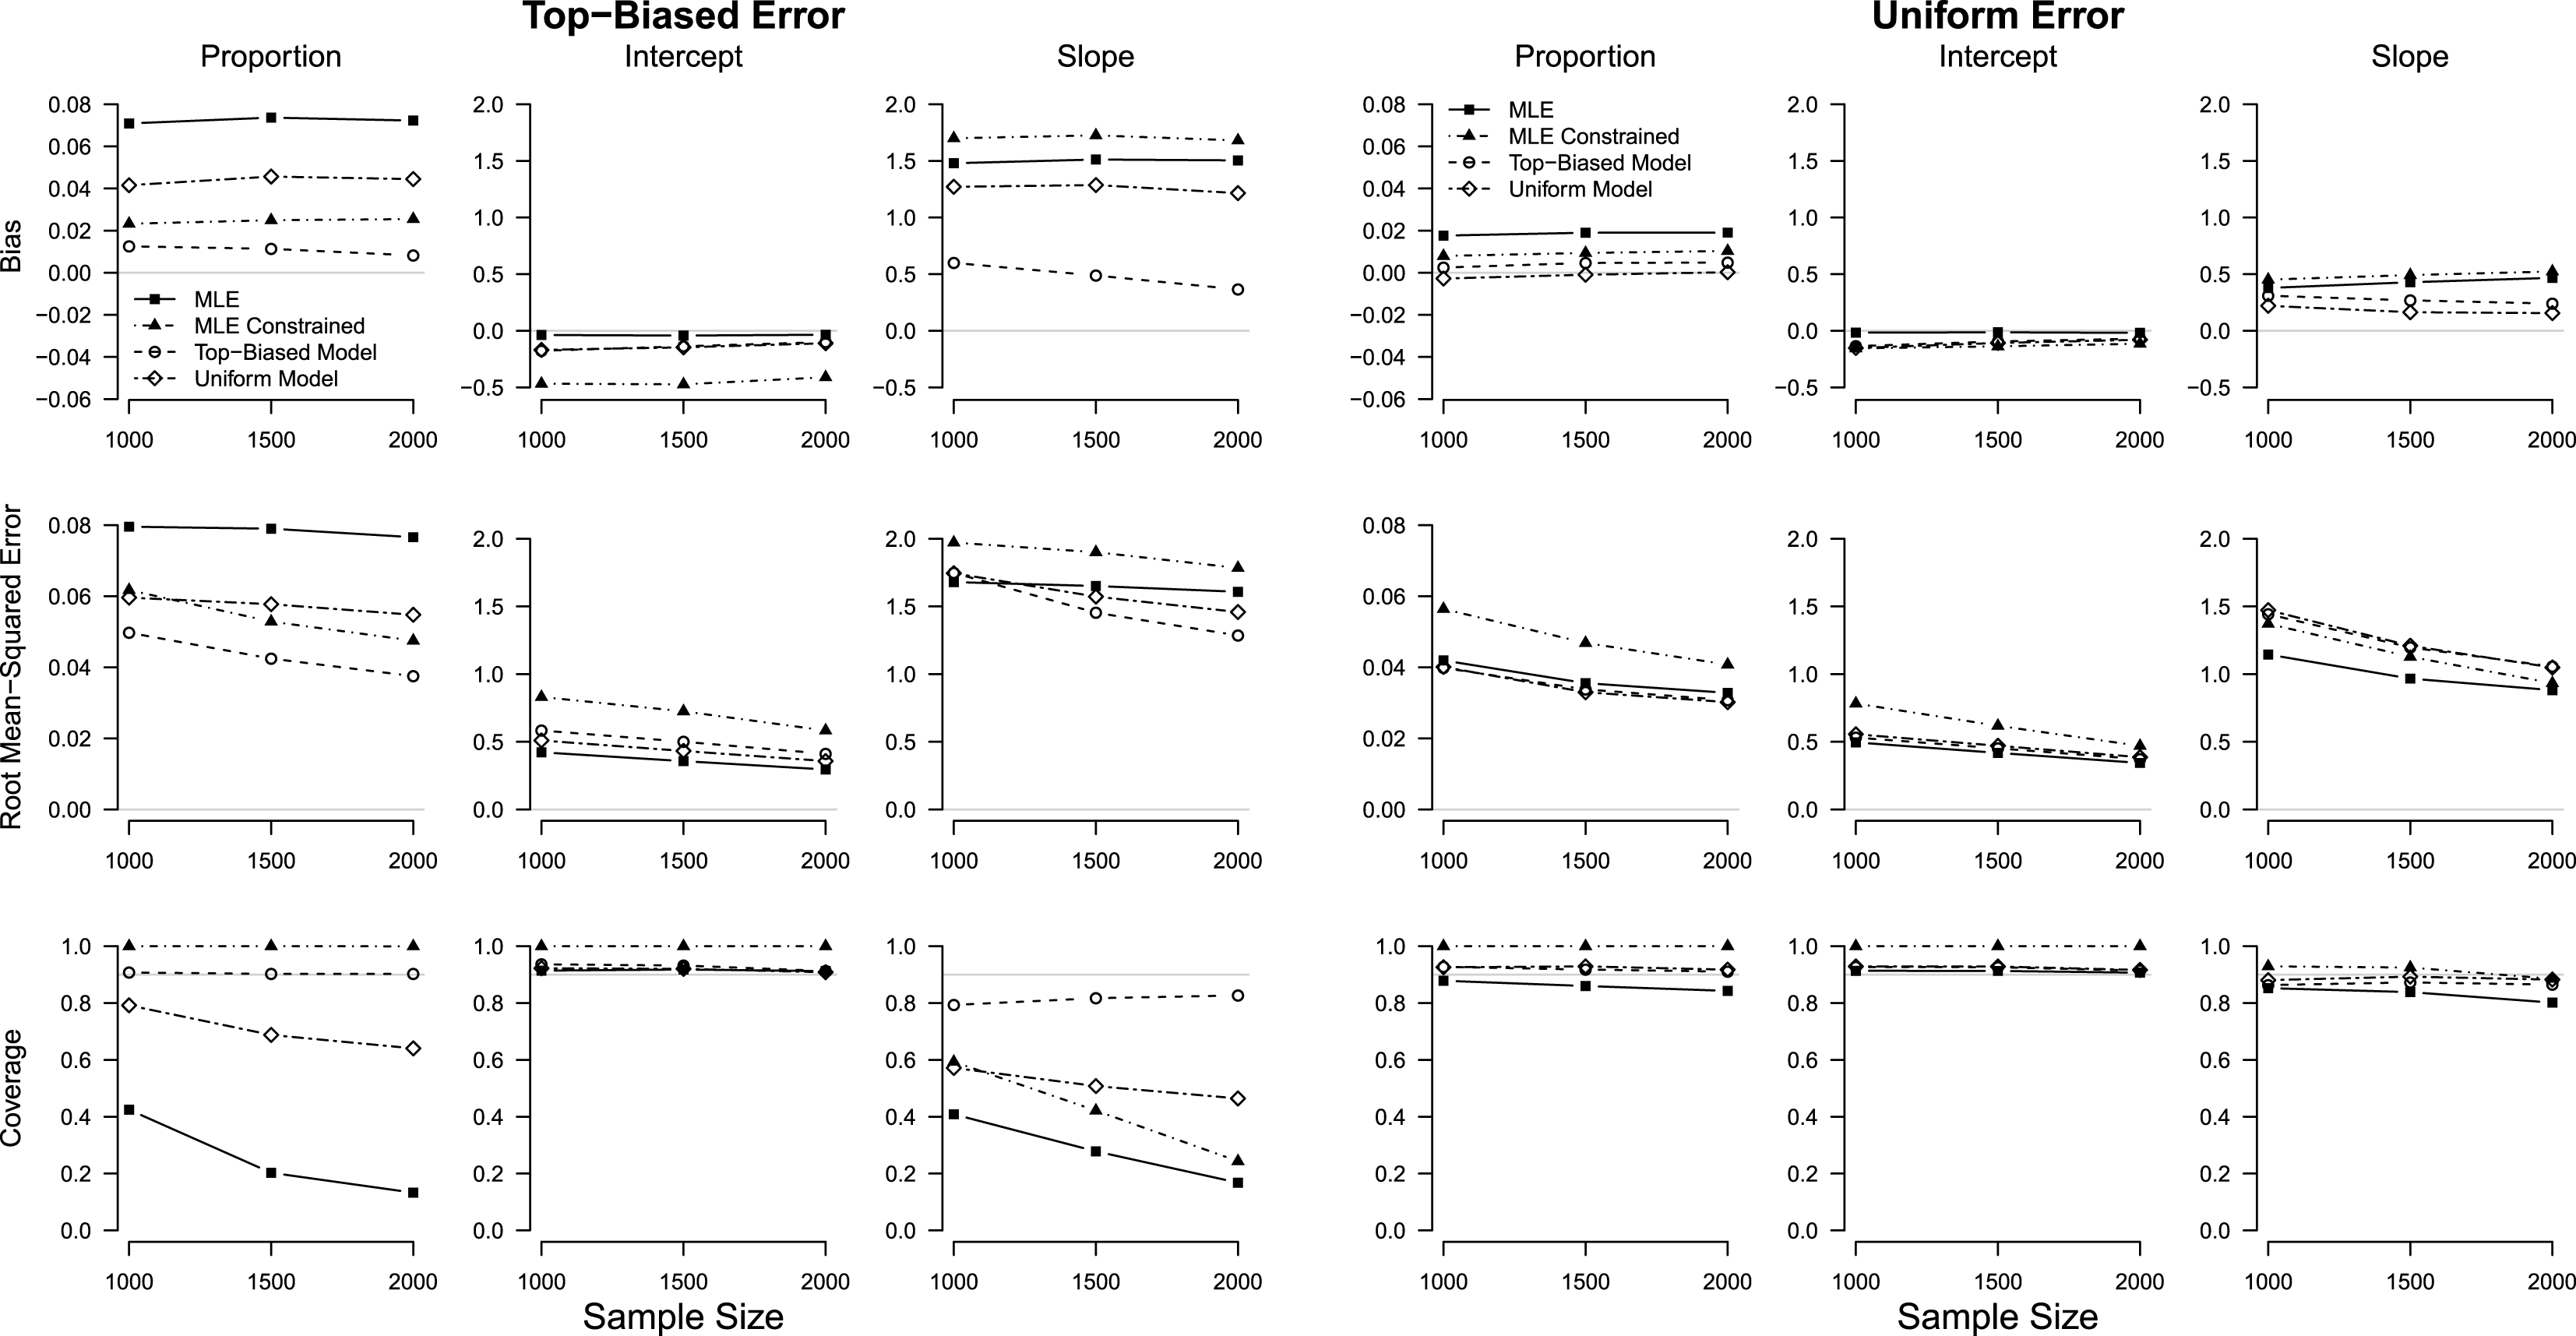
Robustness of the Constrained and Measurement Error Maximum Likelihood Estimators in the Presence of Response Errors when the Propensity of Sensitive Trait is Low. We consider four estimators of the prevalence of the sensitive trait and slope and intercept regression coefficients: the standard ML estimator (solid square with solid line), the constrained ML estimator (solid triangle with dot-dash line), the ML estimators adjusting for top-biased response error (open circle with dashed lines) and uniform response errors (open diamond with dot-long-dash line). The result shows that both the constrained ML estimator and the models adjusting for response error are an improvement over the performance of the ML estimator.

Figure 2 presents the findings for
 $J=3$
, whereas Figure 3 of the Supplementary Appendix shows the results for
 $J=4$
. In the left-hand columns, we show the top-biased error simulation with the standard ML estimator (solid square with solid line), the constrained ML estimator (solid triangle with dot-dash line), the top-biased ML model (open circle with dash line), and the uniform ML model (open diamond with dot-long-dash line) introduced in Section 2. The right-hand columns present the uniform error simulation results. As before, we show the bias, RMSE, and coverage of 90% confidence intervals.
As the upper left-hand corner plot shows, we replicate the main finding in Ahlquist (Reference Ahlquist2018) that a small amount of top-biased error is enough to significantly bias the standard ML estimator. Looking at the regression coefficients, we find that this positive bias follows from the bias in the estimated slope. Our proposed methods appear to address this issue effectively. The constrained estimator slashes the bias of the overall prevalence by almost 75%. This is unsurprising, as it constrains the regression-based prediction to the DiM estimate. However, because the constrained ML does not model the error mechanism directly, it does not improve the bias of the estimated regression coefficients. Indeed, the dashed lines show, the constrained model reduces the bias by decreasing the intercept rather than the slope, which does not help in this particular simulation setting where the bias for the intercept is small to begin with. As a result, the coverage of the confidence interval for the slope is only slightly improved.
As expected, the top-biased error model most effectively addresses this measurement error mechanism, eliminating the bias of the three quantities of interest almost entirely. Likewise, coverage is at the nominal rate for all three quantities of interest. We find that the uniform error model, which models a different error process to the one assumed, nevertheless is no worse than the standard ML model. Indeed, it exhibits less bias, better coverage, and lower RMSE than MLreg. In both cases, there is a small finite-sample bias that reduces as sample size increases.
The right-hand columns of Figure 2 examine the performance of the same four estimators under uniform error. We find several interesting results. Most importantly, we find that MLreg is significantly less biased under this measurement error mechanism than under the top-biased error process. Given the greater plausibility of uniform error relative to top-biased error, this finding suggests that MLreg may be more robust to nonstrategic measurement error than the simulations of Ahlquist (Reference Ahlquist2018) suggest.
We find that the uniform error model leads to some underestimation of the sensitive trait prevalence. While no estimator is unbiased for estimating the intercept, the uniform error model yields a large finite-sample bias for the estimation of the slope coefficient. However, these biases are small relative to the standard error as shown by the proper coverage of the corresponding confidence intervals, and they go to zero as the sample size increases. In contrast, the constrained ML estimator appears to perform well with small bias and RMSE as well as proper coverage of confidence intervals. We also note that the top-biased error model, which assumes a different error process than the simulation DGP, performs well under uniform error, exhibiting low bias, RMSE, and nominal coverage.
4 Empirical Applications
In this section, we illustrate our methods in application to a set of list experiments, which Ahlquist (Reference Ahlquist2018) found to suffer from measurement error. These experiments were originally conducted by Ahlquist, Mayer, and Jackman (Reference Ahlquist, Mayer and Jackman2014) for the purpose of measuring voter impersonation in the 2012 US election—a phenomenon that many scholars of American politics consider to be exceedingly rare (see, e.g., Sobel Reference Sobel2009, and references therein). While the DiM estimate from the voter fraud experiment, negative 1.2%, confirms this expectation, Ahlquist (Reference Ahlquist2018) finds that the multivariate regression model significantly overestimates voter fraud. Ahlquist, Mayer, and Jackman (Reference Ahlquist, Mayer and Jackman2014) also conducted two additional list experiments, one on alien abduction and the other on texting while driving. Ahlquist (Reference Ahlquist2018) finds that MLreg similarly overestimates the prevalence of alien abduction, while no such problem is found for the texting-while-driving list.
Below, we reanalyze these list experiments using the proposed methodology. As a preliminary point, we note that a simple descriptive analysis of these list experiments demonstrates the impracticality of multivariate regression models for the voter fraud and alien abduction lists. Our analysis—as basic as taking the DiM—confirms that these are extremely rare or nonexistent events, and consequently there is no association that exists to be studied. Nevertheless, our new methods yield much more sensible estimates of the prevalence of voter fraud and alien abduction. In particular, when accounting for uniform error, the estimated prevalence of these events is precisely zero. Finally, we analyze the texting-while-driving list, which measures a much more common event, and show that the proposed methods as well as the standard ML estimator yield reasonable results, indicating that rarity, rather than nonstrategic measurement error, was chiefly responsible for the problems with these lists.
4.1 Extremely Rare Sensitive Traits and Multivariate Regression Analysis
As a general rule of thumb, we caution against the use of multivariate regression models when studying extremely rare or even nonexistent sensitive traits. The reason is simple. The goal of multivariate regression analysis is to measure the association between sensitive traits and respondent characteristics. If almost all respondents do not possess such traits, then multivariate regression analysis is likely to be unreliable because no association exists in the first place (and any existing association is likely to be due to noise). In line with these expectations, Ahlquist (Reference Ahlquist2018) finds the ML regression estimator to be misleading for the list experiments on voter fraud and alien abduction but unproblematic for the list experiment on texting while driving, the more common phenomenon by far.
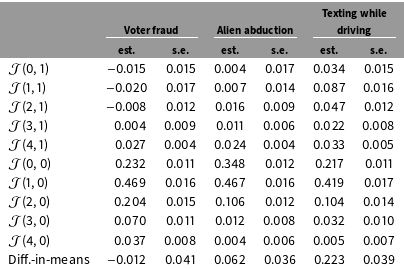
Estimated Proportion of Respondent Types by the Number of Affirmative Answers to the Control and Sensitive Items. The table shows the estimated proportion of respondent type
 ${\mathcal{J}}(y,z)$
, where
 $y\in \{0,\ldots ,J\}$
denotes the number of affirmative answers to the control items and
 $z\in \{0,1\}$
denotes whether respondents would answer yes to the sensitive item. In the last row, we also present the DiM estimator for the estimated proportion of those who would affirmatively answer the sensitive item. The voter fraud and alien abduction list experiments have an extremely small proportion of those who would answer yes to the sensitive item, and for voter fraud some proportions are estimated negative, suggesting the problem of list experiment.

Indeed, we find that the voter fraud and alien abduction list experiments elicit extremely small proportions of the affirmative answer. As discussed in Section 2.3 and recommended in Blair and Imai (Reference Blair and Imai2012), Table 3 presents the estimated proportion of each respondent
 ${\mathcal{J}}(y,z)$
type defined by two latent variables, i.e., the total number of affirmative answers to the control items
 $Y_{i}^{\ast }=y$
and the answer to the sensitive item
 $Z_{i}=z$
. We also present the DiM for each list experiment. The list experiment on voter fraud is most problematic, yielding an overall negative estimate and exhibiting three negative estimates for respondent types who would answer the sensitive item affirmatively.
Although these negative estimates are not statistically significant, this simple diagnostic shows that the list experiment on voter fraud suffers from either the violation of assumptions or an exceedingly small number of respondents with the sensitive trait or both. The descriptive information clearly suggests that multivariate regression analysis cannot be informative for the list experiments on voter fraud and alien abduction. Virtually no respondent would truthfully answer yes to these questions; thus, there is no association to be studied.
The application of the multivariate ML regression model to the alien abduction and voter fraud lists compounds the weakness of indirect questioning methods, which are ill-suited to studying extremely rare sensitive traits. Although indirect questioning methods seek to reduce bias from social desirability and nonresponse by partially protecting the privacy of respondents, they are much less efficient than direct questioning. As a consequence, the estimates will lack the statistical precision required for measurement and analysis of extremely rare traits. Indirect methods further amplify the finite-sample bias associated with rare events (King and Zeng Reference King and Zeng2001).
Given these tradeoffs, we recommend that list experiments be used only when studying truly sensitive topics. The increased cognitive burden on respondents and the loss of statistical efficiency are too great for this survey methodology to be helpful for nonsensitive traits. Among the three list experiments, the one on alien abduction provides the least insight into the efficacy of list experiments. In fact, such questions may themselves increase measurement error if they prompt respondents to stop taking the survey seriously. Better designed validation studies are needed to evaluate the effectiveness of list experiments and their statistical methods (see e.g., Rosenfeld, Imai, and Shapiro Reference Rosenfeld, Imai and Shapiro2016).
Despite our reservations about the application of the multivariate regression models to two of the three list experiments, we now examine whether the methods proposed in Section 2 can detect and adjust for measurement error by applying them to these list experiments.
4.2 Comparison Between the ML and NLS Regression Estimators
We conduct two types of analyses. First, we fit the multivariate regression model with age, gender, and race as covariates using the ML and NLS estimation methods. We show that the NLS regression estimator does not overestimate the incidence of voter fraud and abduction. Next, we implement the test outlined in Section 2.3, and show that the difference between MLreg and NLSreg clearly indicates model misspecification.
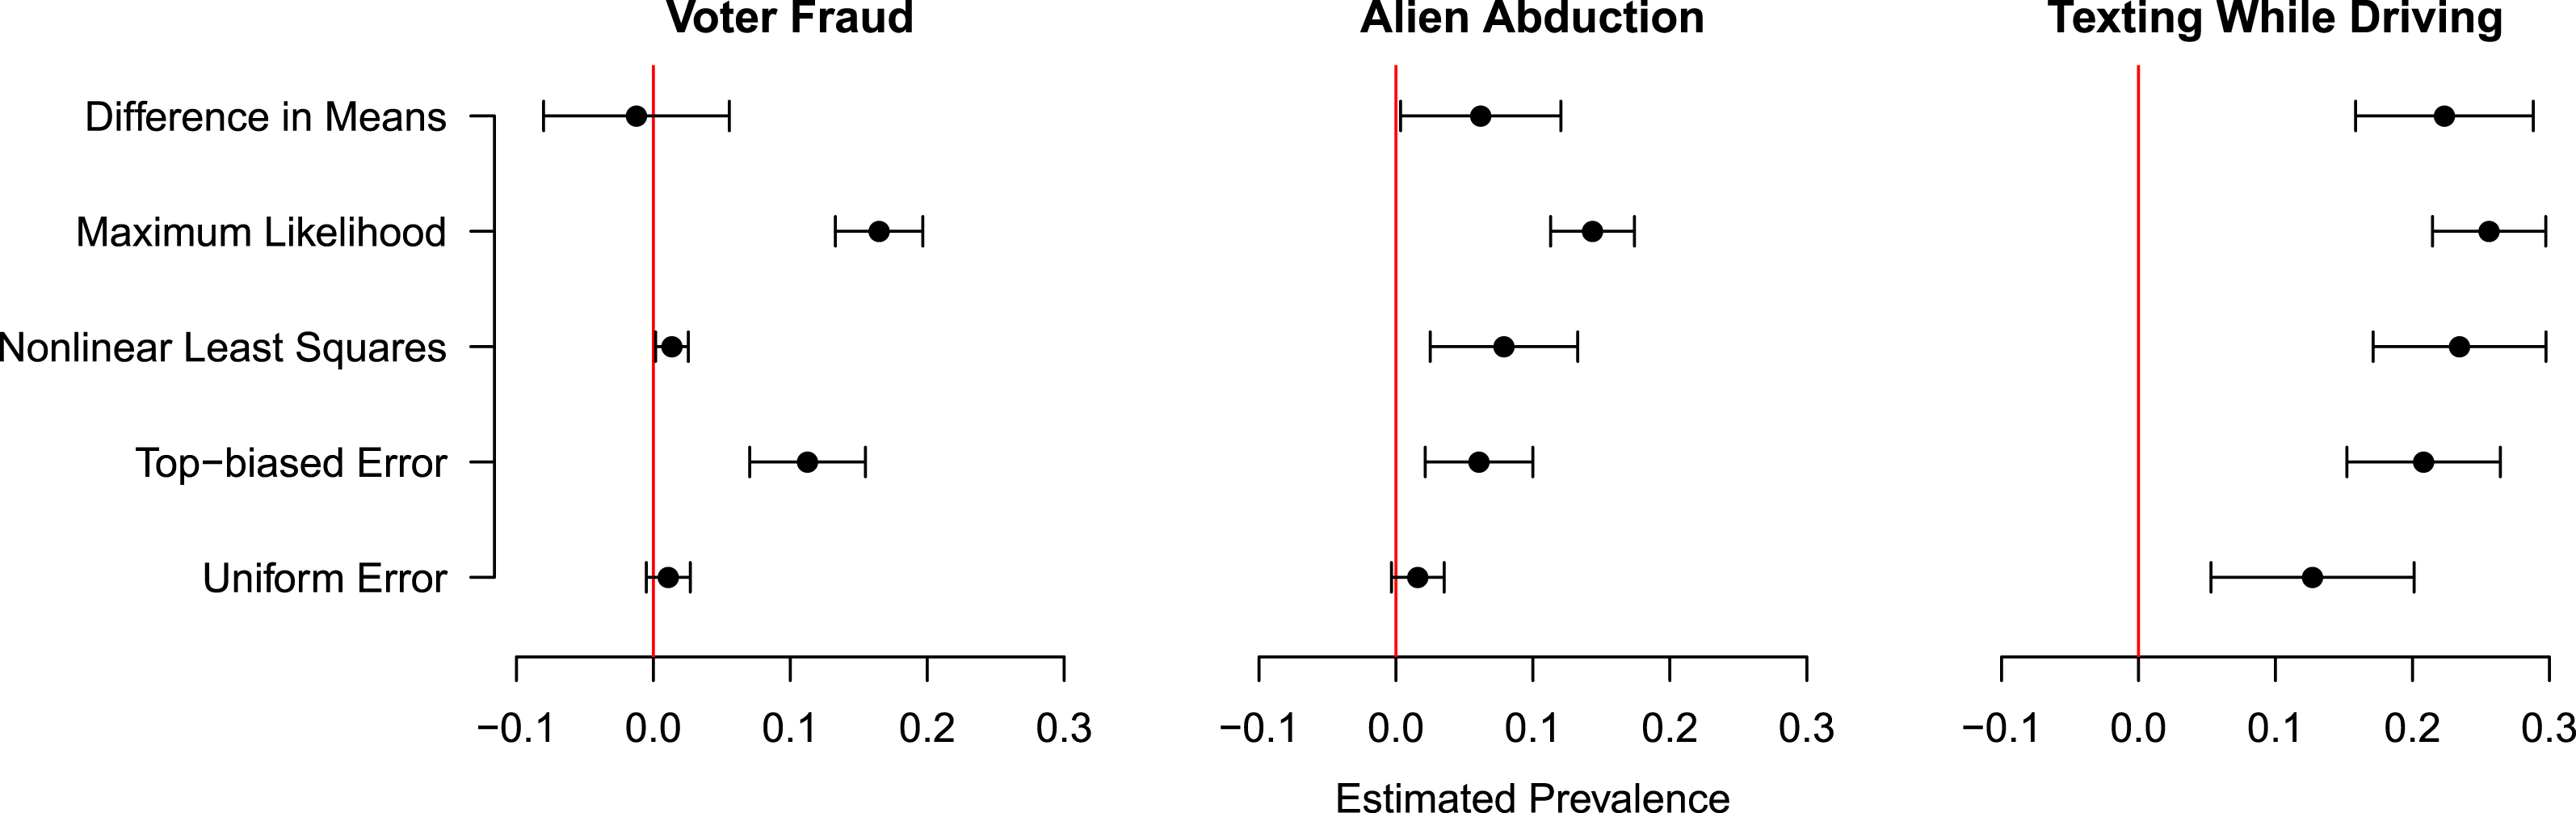
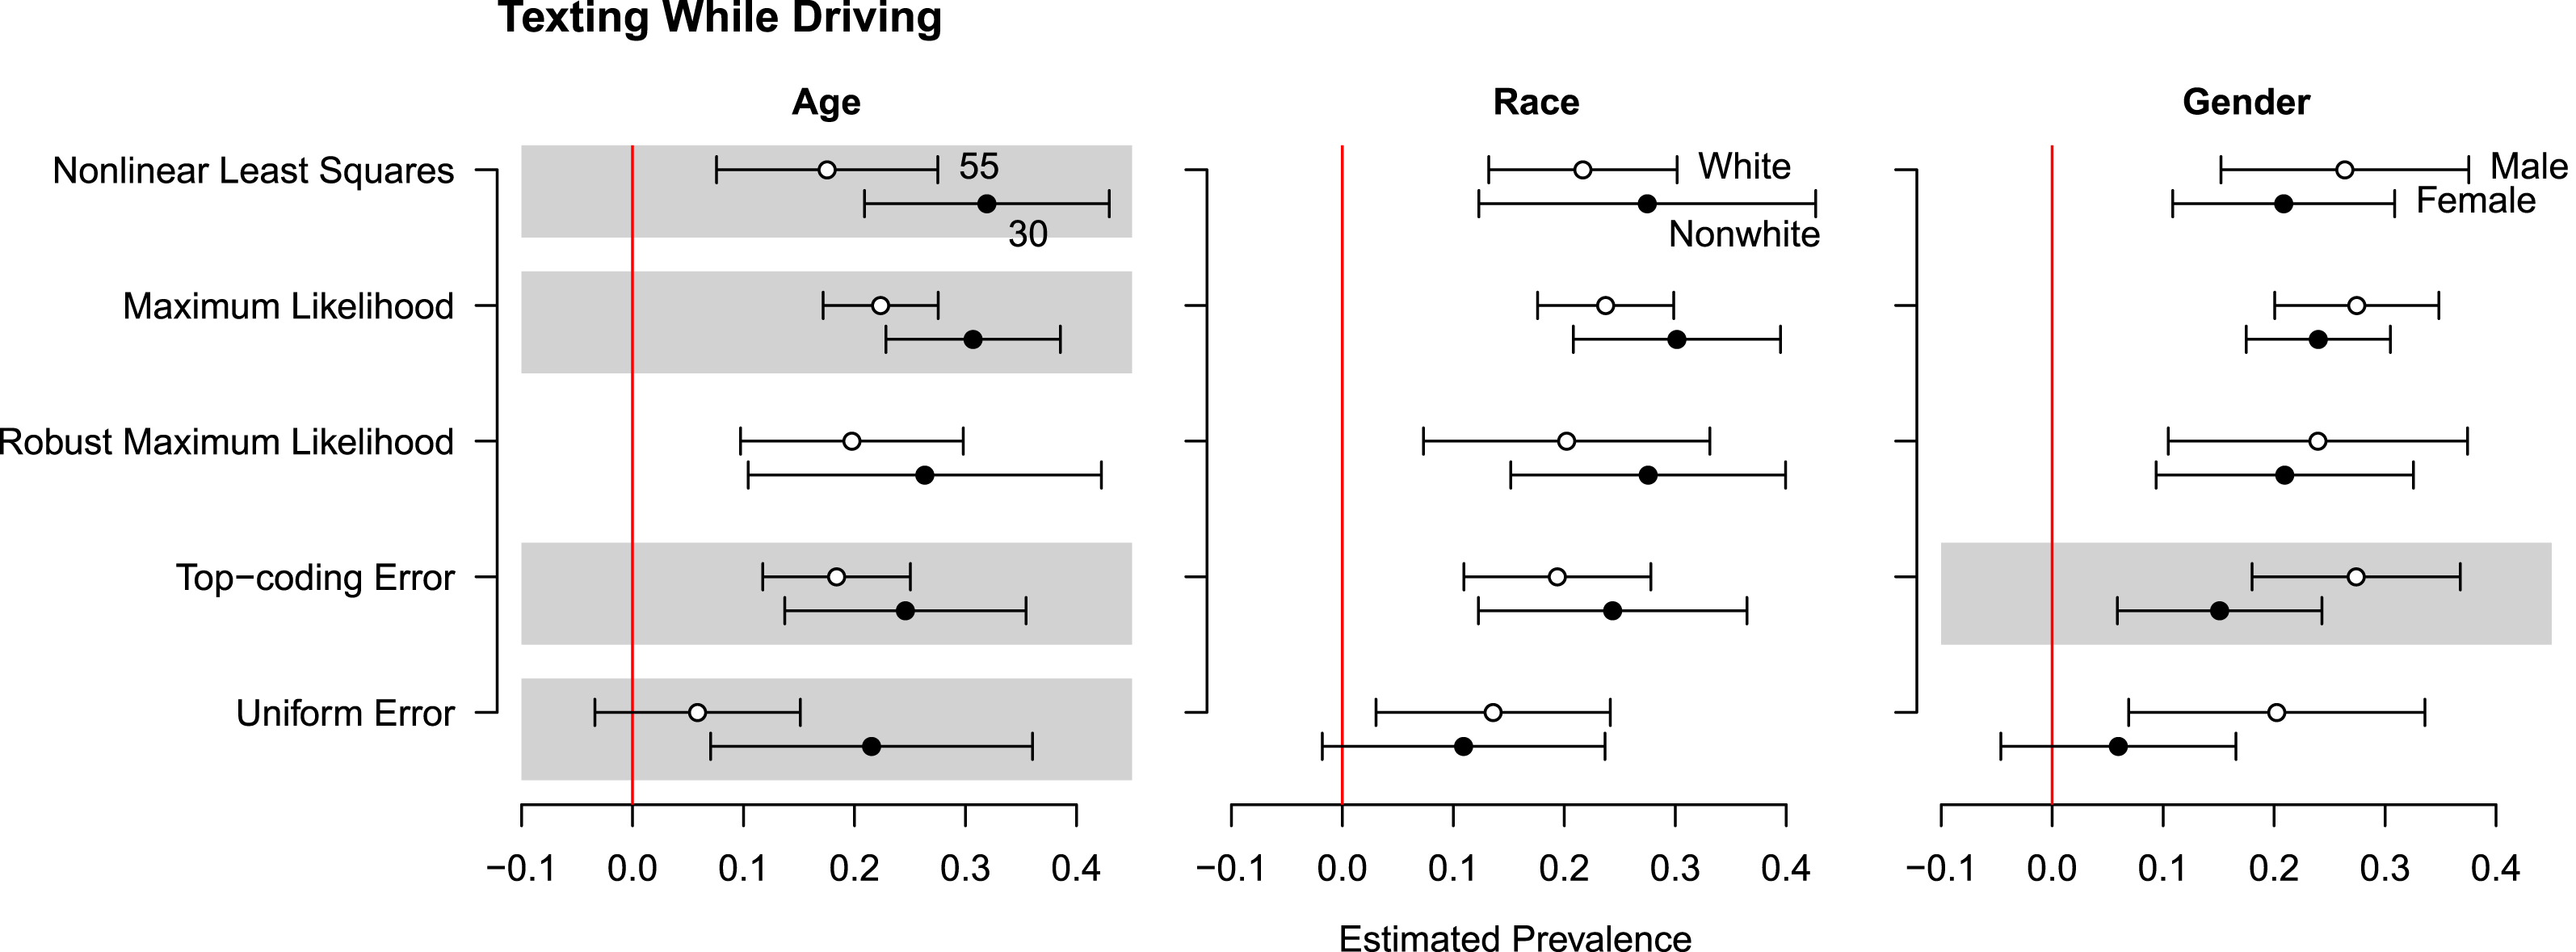
The Estimated Prevalence of Voter Fraud, Alien Abduction, and Texting while Driving. Along with the DiM estimator, we present the estimates based on various multivariate regression analyses including the maximum likelihood and nonlinear least squares regression estimators and estimates are much more stable. The results based on the two measurement error models, i.e., top-biased and uniform errors, are also presented.

We begin by showing that NLSreg does not overestimate the prevalence of voter fraud and alien abduction. Figure 3 presents the estimated proportion of the sensitive trait based on DiM, NLSreg, and MLreg as well as two other estimators that will be described later. We find that the NLS regression estimates closely track the DiM estimates. Indeed, the NLS estimate is statistically indistinguishable from the DiM estimate in all three cases. In the case of voter fraud, the NLS estimate—around 1.4% and statistically indistinguishable from zero—exceeds the DiM estimate by
 $2.59$
percentage points, with a 90% bootstrap confidence interval equal to
 $[-3.74,9.30]$
. For the alien abduction list experiment, the NLS estimate exceeds the DiM estimate by
 $1.70$
percentage points, also an insignificant difference (90% CI:
 $[-0.60,5.90]$
). Last, for the texting-while-driving list experiment, the difference is
 $1.10$
percentage points (90% CI:
 $[-1.40,2.60]$
.)
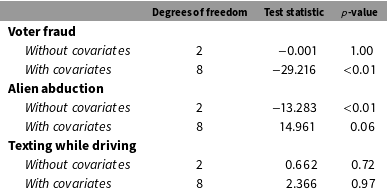
Results of the Proposed Specification Tests. The
 $p$
-values are based on the absolute value of the test statistic. The results show that for the list experiments based on voter fraud and alien abduction we detect model misspecification. For the list experiment on texting while driving, we fail to reject the null hypothesis.

Having shown that NLSreg does not yield meaningfully larger estimates than DiM, we now apply the statistical test developed in Section 2.3 to these list experiments. Table 4 presents the results of this proposed specification test. For the list experiments on voter fraud and alien abduction, which our earlier analysis found most problematic, we obtain negative and large, positive values of the Hausman test statistic. For the negative test statistic, we compute
 $p$
-values based on the absolute value. The results of the statistical hypothesis tests strongly suggest that the model is misspecified for the voter fraud and alien abduction experiments. In contrast, for the list experiment on texting while driving, we fail to reject the null hypothesis of correct model specification.
In sum, the proposed model specification test reaches the same conclusion as the descriptive analysis presented above: multivariate regression models should not be applied to list experiments with extremely rare sensitive traits. For the list experiments on voter fraud and alien abduction, we find strong evidence for model misspecification, suggesting the unreliability of multivariate regression analysis for these list experiments. In contrast, we fail to find such evidence for the list experiment on texting while driving, for which the proportion of affirmative answers is relatively high.
4.3 Modeling Response Error
Next, we apply the nonstrategic measurement error models developed in Section 2.4 to these data and examine whether they yield different results. Earlier, we argued that the top-biased error process is often implausible, as it implies that respondents are willing to reveal sensitive traits. We would expect top-biased error to be most unlikely for the list experiment on voter fraud, as this is the most unambiguously stigmatized trait. On the other hand, uniform error may be the more plausible measurement error mechanism, for example due to satisficing.
As shown in Figure 3, the results based on these measurement error models are consistent with our arguments. For the list experiment on voter fraud, the top-biased error gives a relatively large estimate that is statistically indistinguishable from the ML estimate. In contrast, the uniform error model provides an estimate that is indistinguishable from zero with a 90% confidence interval that is narrower than any other estimator. The list experiment on alien abduction yields a similar result. Like all other models, the top-biased error model gives an estimate that is statistically distinguishable from zero, suggesting that 6 percent of respondents were abducted by aliens (even the DiM estimate is barely statistically insignificant). On the other hand, the prevalence estimate based on the uniform error process model has the narrowest 90% confidence interval that contains zero, suggesting a superior model fit. The results indicate that the uniform error model is more effective for mitigating nonstrategic respondent error in these data than the top-biased error model.
Finally, the results for the list experiment on texting while driving show that the top-biased and uniform measurement error models yield estimates that are much more consistent with the other models. Although the estimate based on the uniform error model is smaller, it has a wider confidence interval than other estimates, suggesting a possibly poor model fit. Together with the other results shown in this section, this finding implies that only the estimates based on the list experiment on texting while driving are robust to various model specification and measurement errors, whereas the estimates for voter fraud and alien abduction are quite sensitive.
Our statistical analysis suggests that the problems described in Ahlquist (Reference Ahlquist2018) arise mainly from the fact that voter fraud in the US and alien abduction are rare to nonexistent events. Given all three lists were implemented in the same survey on the same sample, and were consequently subject to the same nonstrategic measurement error, the robustness of the texting-while-driving lists indicates that researchers should be concerned more with the rarity of the traits under study than with nonstrategic measurement error per se. We provide additional evidence for this statement below by showing that accounting for measurement error does not alter any of the multivariate inferences that one would draw from the texting-while-driving list experiment.
4.4 Multivariate Regression Analysis of Texting While Driving
Recall that the goal of multivariate regression models for list experiments is to measure the association between the sensitive trait and respondent characteristics. We reiterate that voter fraud and alien abduction are so rare that multivariate analysis of these traits is likely to be unreliable. By contrast, the texting-while-driving list offers a unique opportunity to examine how accounting for measurement error affects the estimated regression parameters. Studies commonly assume that younger drivers are especially likely to text while driving. However, frequently used methods, such as analysis of traffic accidents, are unable to measure this association directly (e.g., Delgado, Wanner, and McDonald Reference Delgado, Wanner and McDonald2016). Clearly, DiM also fails to shed light on this relationship.
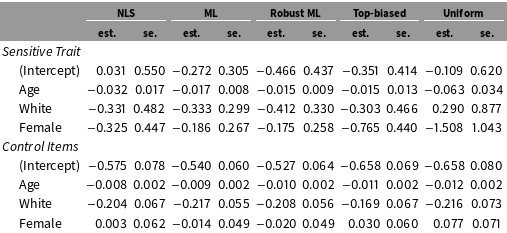
Figure 4 and Table 5 present the results from our multivariate analysis of the texting-while-driving list. In Figure 4, we present predicted values for the different subgroups defined by the three covariates. These values are calculated by changing the variable of interest while fixing the other variables to their observed values. The highlighted comparisons correspond to statistically significant coefficients at the
 $\unicode[STIX]{x1D6FC}=0.10$
level (see Table 5). As the bottom-left panel of the figure shows, we find a consistent association between age and texting while driving. In all models younger respondents are more likely to text while driving than older respondents. We find some evidence of gender differentiation as well; male respondents appear to be consistently more likely to text while driving than female respondents, although this difference is not generally statistically significant.
The overall conclusion is that accounting for uniform error does not have a substantial effect on the conclusions that one would draw from the standard ML or NLS models. Moreover, the results illustrate the primary advantage of multivariate regression modeling, which is to assess the relationship between the sensitive trait and covariates.
Multivariate Regression Analysis of the Texting-While-Driving List. This table shows the estimated coefficients from the baseline NLS and ML multivariate regression models, as well as the proposed robust ML, top-biased, and uniform measurement error models. Younger respondents are more likely to text while driving. We also find suggestive evidence that male respondents are more likely to text while driving.

5 Concluding Recommendations
In this paper, we develop statistical tools that researchers can use to detect and ameliorate nonstrategic measurement error in list experiments, arising for instance from enumerator or respondent noncompliance. Of course, our view is that the best cure for nonstrategic measurement error is to minimize it at the design and administration stages of surveys, and consequently that the presence of such error signals more fundamental flaws in the survey implementation. For example, because the top-biased error process runs directly against respondents’ incentives to conceal sensitive traits, its presence suggests that they do not actually consider the topic to be sensitive in the first place. We would advise against the use of indirect questioning for such topics. The increased cognitive burden and variance of indirect questioning are too great to be used for nonsensitive traits. By extension, we also discourage the use of list experiments for topics like alien abduction, as this can prevent serious engagement with the survey and increase measurement error as a result.
Multivariate Regression Analysis of the Texting-While-Driving List. This figure shows the estimated prevalence of texting while driving based on the different values of the predictor variables. Highlighted estimates correspond to significant coefficients at the
 $\unicode[STIX]{x1D6FC}=0.10$
level. Accounting for measurement error, we find that younger respondents are significantly more likely to report texting while driving. We also find that male respondents are more likely to report texting while driving, though the differences are generally insignificant.

We conclude this paper by offering seven recommendations on how to analyze list experiments with measurement error:
(1) If the goal is to estimate the prevalence of the sensitive trait, researchers should use the DiM estimator as the primary estimator for its simplicity and robustness. Multivariate regression models should be used mainly when inferring the association between the sensitive trait and respondent characteristics.
(2) Multivariate regression models should not be used if the DiM estimator yields a small or negative estimate of the prevalence. A sensitive trait must exist for it to vary with respondent characteristics. In general, list experiments are not suitable for studying rare sensitive traits because they lack statistical power.
(3) It is important to first conduct a descriptive analysis as shown in Table 3. In particular, negative estimates of respondent type proportions would suggest that at least one of the identification assumptions of list experiments may have been violated (related statistical tests are described in Blair and Imai (Reference Blair and Imai2012) and Aronow et al. (Reference Aronow, Coppock, Crawford and Green2015)).
(4) Researchers should compare the NLS and ML regression estimates. NLSreg relies on weaker assumptions than MLreg, and as a result the former is more robust (though less efficient) than the latter. Despite the greater fragility of MLreg, its reduced variance can matter when analyzing list experiments, an underpowered questioning mode. To help researchers adjudicate this bias-variance tradeoff, we provide a model misspecification test predicated on the difference between MLreg and NLSreg.
(5) Multivariate regression models can be extended to model strategic and nonstrategic measurement error processes. These models can be used as robustness checks. Although practical steps can be taken to address nonstrategic error, even perfectly administered surveys are subject to strategic measurement error.
(6) It is possible to make the NLS and ML estimators more robust by using auxiliary information whenever available. In particular, aggregate truths will be helpful. Even when such information is not available, one can ensure that the NLS and ML regression estimators give results consistent with the DiM estimator.
(7) When possible, it is helpful to combine list experiments with direct questioning and other indirect questioning techniques. The methods developed by Blair, Imai, and Lyall (Reference Blair, Imai and Lyall2014) and Aronow et al. (Reference Aronow, Coppock, Crawford and Green2015) can be used to conduct more credible analyses by combining the data from different survey methods.
Appendix A. The Bias of the Difference-in-Means Estimator under Nonstrategic Measurement Error
In this appendix, we show that the DiM estimator is generally biased under the top-biased and uniform error processes. In both cases, the DiM estimator is generally biased because the range of the response variable (and therefore the magnitude of the measurement error bias) is correlated with the treatment status. In particular, bias is large when the prevalence of sensitive trait is small.
First, under the top-biased error process, the bias of the DiM estimator is given by:
 $$\begin{eqnarray}\displaystyle \{\mathbb{E}[(1-p)(Y_{i}^{\ast }+Z_{i})+p(J+1)]-\mathbb{E}[(1-p)Y_{i}^{\ast }+pJ]\}-\unicode[STIX]{x1D70F}=(1-p)\unicode[STIX]{x1D70F}+p-\unicode[STIX]{x1D70F}=p(1-\unicode[STIX]{x1D70F}) & & \displaystyle \nonumber\end{eqnarray}$$
where
 $\unicode[STIX]{x1D70F}=\Pr (Z_{i}=1)$
is the proportion of those with a sensitive trait,
 $p$
is the proportion of those who answer
 $J+1$
regardless of truthful response. The result shows that the bias is zero only when
 $\unicode[STIX]{x1D70F}=1$
, i.e., everyone has a sensitive trait. The bias increases as the prevalence of the sensitive trait decreases. Similarly, under the uniform measurement error mechanism, the bias is given by,
 $$\begin{eqnarray}\displaystyle \left\{\mathbb{E}\left[(1-p)(Y_{i}^{\ast }+Z_{i})+p\frac{J+1}{2}\right]-\mathbb{E}\left[(1-p)Y_{i}^{\ast }+p\frac{J}{2}\right]\right\}-\unicode[STIX]{x1D70F}=(1-p)\unicode[STIX]{x1D70F}+\frac{p}{2}-\unicode[STIX]{x1D70F}=p\left(\frac{1}{2}-\unicode[STIX]{x1D70F}\right). & & \displaystyle \nonumber\end{eqnarray}$$
Thus, in this case, the bias disappears only when the proportion of those with a sensitive trait exactly equals 0.5. Again, the bias is large when the prevalence of the sensitive trait is small.
Appendix B. Computational Details for Measurement Error Models
B.1 The EM Algorithm For the Model of Top-Biased Error
We treat (
 $S_{i},Z_{i},Y_{i}^{\ast }$
) as (partially) missing data to form the following complete-data likelihood function,
 $$\begin{eqnarray}\displaystyle \mathop{\prod }_{i=1}^{N}p^{S_{i}}(1-p)^{1-S_{i}}g(X_{i};\unicode[STIX]{x1D6FD})^{T_{i}Z_{i}}\{1-g(X_{i};\unicode[STIX]{x1D6FD})\}^{T_{i}(1-Z_{i})}\binom{J}{Y_{i}^{\ast }}f(X_{i};\unicode[STIX]{x1D6FE})^{Y_{i}^{\ast }}\{1-f(X_{i};\unicode[STIX]{x1D6FE})\}^{J-Y_{i}^{\ast }}. & & \displaystyle\end{eqnarray}$$
With this much simpler form, we can use the EM algorithm, which consists of a series of weighted regressions, to obtain the ML estimator.
We first derive the E-step. For the latent variable of misreporting, we have,
 $$\begin{eqnarray}\displaystyle \unicode[STIX]{x1D709}(X_{i},T_{i},Y_{i})=\mathbb{E}(S_{i}\mid X_{i},T_{i},Y_{i})=\left\{\begin{array}{@{}ll@{}}\frac{p}{p\{1-g(X_{i};\unicode[STIX]{x1D6FD})f(X_{i};\unicode[STIX]{x1D6FE})^{J}\}+g(X_{i};\unicode[STIX]{x1D6FD})f(X_{i};\unicode[STIX]{x1D6FE})^{J}} & \text{if}~i\in {\mathcal{J}}(1,J+1)\\ \frac{p}{p\{1-f(X_{i};\unicode[STIX]{x1D6FE})^{J}\}+f(X_{i};\unicode[STIX]{x1D6FE})^{J}} & \text{if}~i\in {\mathcal{J}}(0,J)\\ 0 & \text{otherwise}.\end{array}\right. & & \displaystyle \nonumber\end{eqnarray}$$
The E-step for the latent variable of truthful response to the sensitive item is given by,
 $$\begin{eqnarray}\displaystyle & & \displaystyle \unicode[STIX]{x1D702}(X_{i},1,Y_{i})=\mathbb{E}(Z_{i}\mid X_{i},T_{i}=1,Y_{i})\nonumber\\ \displaystyle & & \displaystyle \quad =\left\{\begin{array}{@{}ll@{}}0 & \text{if}~i\in {\mathcal{J}}(1,0)\\ \frac{(1-p)g(X_{i};\unicode[STIX]{x1D6FD})f(X_{i};\unicode[STIX]{x1D6FE})^{J}+p\cdot g(X_{i};\unicode[STIX]{x1D6FD})}{p\{1-g(X_{i};\unicode[STIX]{x1D6FD})f(X_{i};\unicode[STIX]{x1D6FE})^{J}\}+g(X_{i};\unicode[STIX]{x1D6FD})f(X_{i};\unicode[STIX]{x1D6FE})^{J}} & \text{if}~i\in {\mathcal{J}}(1,J+1)\\ \frac{g(X_{i};\unicode[STIX]{x1D6FD})\binom{J}{Y_{i}-1}f(X_{i};\unicode[STIX]{x1D6FE})^{Y_{i}-1}\{1-f(X_{i};\unicode[STIX]{x1D6FE})\}^{J-Y_{i}+1}}{g(X_{i};\unicode[STIX]{x1D6FD})\binom{J}{Y_{i}-1}f(X_{i};\unicode[STIX]{x1D6FE})^{Y_{i}-1}\{1-f(X_{i};\unicode[STIX]{x1D6FE})\}^{J-Y_{i}+1}+\{1-g(X_{i};\unicode[STIX]{x1D6FD})\}\binom{J}{Y_{i}}f(X_{i};\unicode[STIX]{x1D6FE})^{Y_{i}}\{1-f(X_{i};\unicode[STIX]{x1D6FE})\}^{J-Y_{i}}} & \text{otherwise}.\end{array}\right.\nonumber\end{eqnarray}$$
Finally, the E-step for the latent variable representing the response to the control items has several different expressions depending on the values of observed variables. We begin with the control group,
 $$\begin{eqnarray}\displaystyle \unicode[STIX]{x1D701}_{J}(X_{i},0,Y_{i})=\Pr (Y_{i}^{\ast }=J\mid X_{i},T_{i}=0,Y_{i})=\left\{\begin{array}{@{}ll@{}}\frac{f(X_{i};\unicode[STIX]{x1D6FE})^{J}}{p\{1-f(X_{i};\unicode[STIX]{x1D6FE})^{J}\}+f(X_{i};\unicode[STIX]{x1D6FE})^{J}} & \text{if}~i\in {\mathcal{J}}(0,J)\\ 0 & \text{otherwise}\end{array}\right. & & \displaystyle \nonumber\end{eqnarray}$$
and for
 $0\leqslant y<J$
,
 $$\begin{eqnarray}\displaystyle \unicode[STIX]{x1D701}_{y}(X_{i},0,Y_{i})=\Pr (Y_{i}^{\ast }=y\mid X_{i},T_{i}=0,Y_{i}) & = & \displaystyle \left\{\begin{array}{@{}ll@{}}\frac{p\binom{J}{y}f(X_{i};\unicode[STIX]{x1D6FE})^{y}\{1-f(X_{i};\unicode[STIX]{x1D6FE})\}^{J-y}}{p\{1-f(X_{i};\unicode[STIX]{x1D6FE})^{J}\}+f(X_{i};\unicode[STIX]{x1D6FE})^{J}} & \text{if}~i\in {\mathcal{J}}(0,J)\\ 1 & \text{if}~Y_{i}=y\\ 0 & \text{otherwise}.\end{array}\right.\nonumber\end{eqnarray}$$
For the treatment group, we have,
 $$\begin{eqnarray}\displaystyle \unicode[STIX]{x1D701}_{J}(X_{i},1,Y_{i}) & = & \displaystyle \Pr (Y_{i}^{\ast }=J\mid X_{i},T_{i}=1,Y_{i})\nonumber\\ \displaystyle & = & \displaystyle \left\{\begin{array}{@{}ll@{}}\frac{(1-p)g(X_{i};\unicode[STIX]{x1D6FD})f(X_{i};\unicode[STIX]{x1D6FE})^{J}+p\cdot f(X_{i};\unicode[STIX]{x1D6FE})^{J}}{p+(1-p)g(X_{i};\unicode[STIX]{x1D6FD})f(X_{i};\unicode[STIX]{x1D6FE})^{J}} & \text{if}~i\in {\mathcal{J}}(1,J+1)\\ \frac{\{1-g(X_{i};\unicode[STIX]{x1D6FD})\}f(X_{i};\unicode[STIX]{x1D6FE})^{J}}{\{1-g(X_{i};\unicode[STIX]{x1D6FD})\}f(X_{i};\unicode[STIX]{x1D6FE})^{J}+g(X_{i};\unicode[STIX]{x1D6FD})\cdot J\cdot f(X_{i};\unicode[STIX]{x1D6FE})^{J-1}\{1-f(X_{i};\unicode[STIX]{x1D6FE})\}} & \text{if}~i\in {\mathcal{J}}(1,J)\\ 0 & \text{otherwise}\end{array}\right.\nonumber\\ \displaystyle \unicode[STIX]{x1D701}_{0}(X_{i},1,Y_{i}) & = & \displaystyle \Pr (Y_{i}^{\ast }=0\mid X_{i},T_{i}=1,Y_{i})\nonumber\\ \displaystyle & = & \displaystyle \left\{\begin{array}{@{}ll@{}}\frac{p\{1-f(X_{i};\unicode[STIX]{x1D6FE})\}^{J}}{p+(1-p)g(X_{i};\unicode[STIX]{x1D6FD})f(X_{i};\unicode[STIX]{x1D6FE})^{J}} & \text{if}~i\in {\mathcal{J}}(1,J+1)\\ 1 & \text{if}~i\in {\mathcal{J}}(1,0)\\ 0 & \text{otherwise}\end{array}\right.\nonumber\end{eqnarray}$$
and for
 $0<y<J$
,
 $$\begin{eqnarray}\displaystyle & & \displaystyle \unicode[STIX]{x1D701}_{y}(X_{i},1,Y_{i})=\Pr (Y_{i}^{\ast }=y\mid X_{i},T_{i}=1,Y_{i})\nonumber\\ \displaystyle & & \displaystyle \quad =\left\{\begin{array}{@{}ll@{}}\frac{p\binom{J}{y}f(X_{i};\unicode[STIX]{x1D6FE})^{y}\{1-f(X_{i};\unicode[STIX]{x1D6FE})\}^{J-y}}{p+(1-p)g(X_{i};\unicode[STIX]{x1D6FD})f(X_{i};\unicode[STIX]{x1D6FE})^{J}} & \text{if}~i\in {\mathcal{J}}(1,J+1)\\ \frac{g(X_{i};\unicode[STIX]{x1D6FD})\binom{J}{y}f(X_{i};\unicode[STIX]{x1D6FE})^{y}\{1-f(X_{i};\unicode[STIX]{x1D6FE})\}^{J-y}}{g(X_{i};\unicode[STIX]{x1D6FD})\binom{J}{y}f(X_{i};\unicode[STIX]{x1D6FE})^{y}\{1-f(X_{i};\unicode[STIX]{x1D6FE})\}^{J-y}+\{1-g(X_{i};\unicode[STIX]{x1D6FD})\}\binom{J}{y+1}f(X_{i};\unicode[STIX]{x1D6FE})^{y+1}\{1-f(X_{i};\unicode[STIX]{x1D6FE})\}^{J-y-1}\}} & \text{if}~i\in {\mathcal{J}}(1,y+1)\\ \frac{\{1-g(X_{i};\unicode[STIX]{x1D6FD})\}\binom{J}{y}f(X_{i};\unicode[STIX]{x1D6FE})^{y}\{1-f(X_{i};\unicode[STIX]{x1D6FE})\}^{J-y}}{\{1-g(X_{i};\unicode[STIX]{x1D6FD})\}\binom{J}{y}f(X_{i};\unicode[STIX]{x1D6FE})^{y}\{1-f(X_{i};\unicode[STIX]{x1D6FE})\}^{J-y}+g(X_{i};\unicode[STIX]{x1D6FD})\binom{J}{y-1}f(X_{i};\unicode[STIX]{x1D6FE})^{y-1}\{1-f(X_{i};\unicode[STIX]{x1D6FE})\}^{J-y+1}} & \text{if}~i\in {\mathcal{J}}(1,y)\\ 0 & \text{otherwise}.\end{array}\right.\nonumber\end{eqnarray}$$
Finally, the Q-function is given by,
 $$\begin{eqnarray}\displaystyle & & \displaystyle \mathop{\sum }_{i=1}^{N}\unicode[STIX]{x1D709}(X_{i},T_{i},Y_{i})\log p+\{1-\unicode[STIX]{x1D709}(X_{i},T_{i},Y_{i})\}\log (1-p)\nonumber\\ \displaystyle & & \displaystyle +\,\mathop{\sum }_{i=1}^{N}T_{i}\left[\unicode[STIX]{x1D702}(X_{i},1,Y_{i})\log g(X_{i};\unicode[STIX]{x1D6FD})+\{1-\unicode[STIX]{x1D702}(X_{i},1,Y_{i})\}\log \{1-g(X_{i};\unicode[STIX]{x1D6FD})\}\right]\nonumber\\ \displaystyle & & \displaystyle +\,\mathop{\sum }_{i=1}^{N}\left\{\mathop{\sum }_{y=1}^{J}y\cdot \unicode[STIX]{x1D701}_{y}(X_{i},T_{i},Y_{i})\right\}\log f(X_{i};\unicode[STIX]{x1D6FE})+\left\{J-\mathop{\sum }_{y=1}^{J}y\cdot \unicode[STIX]{x1D701}_{y}(X_{i},T_{i},Y_{i})\right\}\log \{1-f(X_{i};\unicode[STIX]{x1D6FE})\}.\nonumber\end{eqnarray}$$
Thus, the M-step for
 $p$
is,
 $$\begin{eqnarray}\displaystyle p=\frac{1}{N}\mathop{\sum }_{i=1}^{N}\unicode[STIX]{x1D709}(X_{i},T_{i},Y_{i}). & & \displaystyle\end{eqnarray}$$
The M-steps for
 $\unicode[STIX]{x1D6FD}$
and
 $\unicode[STIX]{x1D6FE}$
consist of a series of weighted logistic regressions.
B.2 The EM Algorithm For the Model of Uniform Error
The complete-data likelihood is given by,
 $$\begin{eqnarray}\displaystyle & & \displaystyle \mathop{\prod }_{i=1}^{n}\{p_{1}^{S_{i}}{(1-p_{1})^{1-S_{i}}\}}^{T_{i}}\{p_{0}^{S_{i}}{(1-p_{0})^{1-S_{i}}\}}^{1-T_{i}}\nonumber\\ \displaystyle & & \displaystyle \quad \times \,g(X_{i};\unicode[STIX]{x1D6FD})^{T_{i}Z_{i}}\{1-g(X_{i};\unicode[STIX]{x1D6FD})\}^{T_{i}(1-Z_{i})}\binom{J}{Y_{i}^{\ast }}f(X_{i};\unicode[STIX]{x1D6FE})^{Y_{i}^{\ast }}\{1-f(X_{i};\unicode[STIX]{x1D6FE})\}^{J-Y_{i}^{\ast }}.\end{eqnarray}$$
Then, the EM algorithm, which consists of a series of weighted regressions, is used to obtain the ML estimator.
The E-steps for the latent variables of misreporting and truthful answer to the sensitive item are given by,
 $$\begin{eqnarray}\displaystyle & & \displaystyle \unicode[STIX]{x1D709}(X_{i},T_{i},Y_{i})=\mathbb{E}(S_{i}\mid X_{i},T_{i},Y_{i})=\Pr (S_{i}=1\mid X_{i},T_{i},Y_{i})\nonumber\\ \displaystyle & & \displaystyle =\left\{\begin{array}{@{}ll@{}}\frac{\frac{p_{1}}{J+2}}{\frac{p_{1}}{J+2}+(1-p_{1})g(X_{i};\unicode[STIX]{x1D6FD})f(X_{i};\unicode[STIX]{x1D6FE})^{J}} & \text{if}~i\in {\mathcal{J}}(1,J+1)\\ \frac{\frac{p_{1}}{J+2}}{\frac{p_{1}}{J+2}+(1-p_{1})\{1-g(X_{i};\unicode[STIX]{x1D6FD})\}\{1-f(X_{i};\unicode[STIX]{x1D6FE})\}^{J}} & \text{if}~i\in {\mathcal{J}}(1,0)\\ \frac{\frac{p_{0}}{J+1}}{\frac{p_{0}}{J+1}+(1-p_{0})\binom{J}{y}f(X_{i};\unicode[STIX]{x1D6FE})^{y}\{1-f(X_{i};\unicode[STIX]{x1D6FE})\}^{J-y}} & \text{if}~i\in {\mathcal{J}}(0,y)\\ \frac{\frac{p_{1}}{J+2}}{\frac{p_{1}}{J+2}+(1-p_{1})\left[g(X_{i};\unicode[STIX]{x1D6FD})\binom{J}{Y_{i}-1}f(X_{i};\unicode[STIX]{x1D6FE})^{Y_{i}-1}\{1-f(X_{i};\unicode[STIX]{x1D6FE})\}^{J-Y_{i}+1}+\{1-g(X_{i};\unicode[STIX]{x1D6FD})\}\binom{J}{Y_{i}}f(X_{i};\unicode[STIX]{x1D6FE})^{Y_{i}}\{1-f(X_{i};\unicode[STIX]{x1D6FE})\}^{J-Y_{i}}\right]} & \text{otherwise}\end{array}\right.\nonumber\\ \displaystyle & & \displaystyle \unicode[STIX]{x1D702}(X_{i},T_{i}=1,Y_{i})~=~\mathbb{E}(Z_{i}\mid X_{i},T_{i}=1,Y_{i})\nonumber\\ \displaystyle & & \displaystyle =\left\{\begin{array}{@{}ll@{}}\frac{\frac{p_{1}}{J+2}g(X_{i};\unicode[STIX]{x1D6FD})+(1-p_{1})g(X_{i};\unicode[STIX]{x1D6FD})f(X_{i};\unicode[STIX]{x1D6FE})^{J}}{(1-p_{1})g(X_{i};\unicode[STIX]{x1D6FD})f(X_{i};\unicode[STIX]{x1D6FE})^{J}+\frac{p_{1}}{J+2}} & \text{if}~i\in {\mathcal{J}}(1,J+1)\\ \frac{\frac{p_{1}}{J+2}g(X_{i};\unicode[STIX]{x1D6FD})}{(1-p_{1})\{1-g(X_{i};\unicode[STIX]{x1D6FD})\}\{1-f(X_{i};\unicode[STIX]{x1D6FE})\}^{J}+\frac{p_{1}}{J+2}} & \text{if}~i\in {\mathcal{J}}(1,0)\\ \frac{\left[\frac{p_{1}}{J+2}+(1-p_{1})\binom{J}{Y_{i}-1}f(X_{i};\unicode[STIX]{x1D6FE})^{Y_{i}-1}\{1-f(X_{i};\unicode[STIX]{x1D6FE})\}^{J-Y_{i}+1}\right]g(X_{i};\unicode[STIX]{x1D6FD})}{\frac{p_{1}}{J+2}+(1-p_{1})\left[g(X_{i};\unicode[STIX]{x1D6FD})\binom{J}{Y_{i}-1}f(X_{i};\unicode[STIX]{x1D6FE})^{Y_{i}-1}\{1-f(X_{i};\unicode[STIX]{x1D6FE})\}^{J-Y_{i}+1}+\{1-g(X_{i};\unicode[STIX]{x1D6FD})\}\binom{J}{Y_{i}}f(X_{i};\unicode[STIX]{x1D6FE})^{Y_{i}}\{1-f(X_{i};\unicode[STIX]{x1D6FE})\}^{J-Y_{i}}\right]} & \text{otherwise}.\end{array}\right.\nonumber\end{eqnarray}$$
For the latent variable of response to the control items, we obtain the E-steps separately for different sets of observations. For the control group, we have
 $$\begin{eqnarray}\displaystyle \unicode[STIX]{x1D701}_{y}(X_{i},0,Y_{i})=\Pr (Y_{i}^{\ast }=y\mid X_{i},T_{i}=0,Y_{i})=\left\{\begin{array}{@{}ll@{}}\frac{\left[\frac{p_{0}}{J+1}+(1-p_{0})\right]\binom{J}{y}f(X_{i};\unicode[STIX]{x1D6FE})^{y}\{1-f(X_{i};\unicode[STIX]{x1D6FE})\}^{J-y}}{\frac{p_{0}}{J+1}+(1-p_{0})\binom{J}{y}f(X_{i};\unicode[STIX]{x1D6FE})^{y}\{1-f(X_{i};\unicode[STIX]{x1D6FE})\}^{J-y}} & \text{if}~i\in {\mathcal{J}}(0,y)\\ \frac{\frac{p_{0}}{J+1}\binom{J}{y}f(X_{i};\unicode[STIX]{x1D6FE})^{y}\{1-f(X_{i};\unicode[STIX]{x1D6FE})\}^{J-y}}{\frac{p_{0}}{J+1}+(1-p_{0})\binom{J}{Y_{i}}f(X_{i};\unicode[STIX]{x1D6FE})^{Y_{i}}\{1-f(X_{i};\unicode[STIX]{x1D6FE})\}^{J-Y_{i}}} & \text{otherwise}\end{array}\right. & & \displaystyle \nonumber\end{eqnarray}$$
where
 $y=0,1,\ldots ,J$
. For the treatment group, the E-step is more complex,
 $$\begin{eqnarray}\displaystyle & & \displaystyle \unicode[STIX]{x1D701}_{J}(X_{i},1,Y_{i})=\Pr (Y_{i}^{\ast }=J\mid X_{i},T_{i}=1,Y_{i})\nonumber\\ \displaystyle & & \displaystyle =\left\{\begin{array}{@{}ll@{}}\frac{\left\{(1-p_{1})g(X_{i};\unicode[STIX]{x1D6FD})+\frac{p_{1}}{J+2}\right\}f(X_{i};\unicode[STIX]{x1D6FE})^{J}}{\frac{p_{1}}{J+2}+(1-p_{1})g(X_{i};\unicode[STIX]{x1D6FD})f(X_{i};\unicode[STIX]{x1D6FE})^{J}} & \text{if}~i\in {\mathcal{J}}(1,J+1)\\ \frac{\left[(1-p_{1})\{1-g(X_{i};\unicode[STIX]{x1D6FD})\}+\frac{p_{1}}{J+2}\right]f(X_{i};\unicode[STIX]{x1D6FE})^{J}}{(1-p_{1})\left[\{1-g(X_{i};\unicode[STIX]{x1D6FD})\}f(X_{i};\unicode[STIX]{x1D6FE})^{J}+g(X_{i};\unicode[STIX]{x1D6FD})Jf(X_{i};\unicode[STIX]{x1D6FE})^{J-1}\{1-f(X_{i};\unicode[STIX]{x1D6FE})\}\right]+\frac{p_{1}}{J+2}} & \text{if}~i\in {\mathcal{J}}(1,J)\\ \frac{\frac{p_{1}}{J+2}f(X_{i};\unicode[STIX]{x1D6FE})^{J}}{\frac{p_{1}}{J+2}+(1-p_{1})\{1-g(X_{i};\unicode[STIX]{x1D6FD})\}\{1-f(X_{i};\unicode[STIX]{x1D6FE})\}^{J}} & \text{if}~i\in {\mathcal{J}}(1,0)\\ \frac{\frac{p_{1}}{J+2}f(X_{i};\unicode[STIX]{x1D6FE})^{J}}{(1-p_{1})\left[\{1-g(X_{i};\unicode[STIX]{x1D6FD})\}\binom{J}{Y_{i}}f(X_{i};\unicode[STIX]{x1D6FE})^{Y_{i}}\{1-f(X_{i};\unicode[STIX]{x1D6FE})\}^{J-Y_{i}}+g(X_{i};\unicode[STIX]{x1D6FD})\binom{J}{Y_{i}-1}f(X_{i};\unicode[STIX]{x1D6FE})^{Y_{i}-1}\{1-f(X_{i};\unicode[STIX]{x1D6FE})\}^{J-Y_{i}+1}\right]+\frac{p_{1}}{J+2}} & \text{otherwise}\end{array}\right.\nonumber\\ \displaystyle & & \displaystyle \unicode[STIX]{x1D701}_{0}(X_{i},1,Y_{i})=\Pr (Y_{i}^{\ast }=0\mid X_{i},T_{i}=1,Y_{i})\nonumber\\ \displaystyle & & \displaystyle =\left\{\begin{array}{@{}ll@{}}\frac{\frac{p_{1}}{J+2}\{1-f(X_{i};\unicode[STIX]{x1D6FE})\}^{J}}{\frac{p_{1}}{J+2}+(1-p_{1})g(X_{i};\unicode[STIX]{x1D6FD})f(X_{i};\unicode[STIX]{x1D6FE})^{J}} & \text{if}~i\in {\mathcal{J}}(1,J+1)\\ \frac{\left[\frac{p_{1}}{J+2}+(1-p_{1})\{1-g(X_{i};\unicode[STIX]{x1D6FD})\}\right]\{1-f(X_{i};\unicode[STIX]{x1D6FE})\}^{J}}{\frac{p_{1}}{J+2}+(1-p_{1})\{1-g(X_{i};\unicode[STIX]{x1D6FD})\}\{1-f(X_{i};\unicode[STIX]{x1D6FE})\}^{J}} & \text{if}~i\in {\mathcal{J}}(1,0)\\ \frac{\left[(1-p_{1})\{1-g(X_{i};\unicode[STIX]{x1D6FD})\}+\frac{p_{1}}{J+2}\right]\{1-f(X_{i};\unicode[STIX]{x1D6FE})\}^{J}}{(1-p_{1})\left[\{1-g(X_{i};\unicode[STIX]{x1D6FD})\}\binom{J}{Y_{i}}f(X_{i};\unicode[STIX]{x1D6FE})^{Y_{i}}\{1-f(X_{i};\unicode[STIX]{x1D6FE})\}^{J-Y_{i}}+g(X_{i};\unicode[STIX]{x1D6FD})\binom{J}{Y_{i}-1}f(X_{i};\unicode[STIX]{x1D6FE})^{Y_{i}-1}\{1-f(X_{i};\unicode[STIX]{x1D6FE})\}^{J-Y_{i}+1}\right]+\frac{p_{1}}{J+2}} & \text{otherwise}\end{array}\right.\nonumber\end{eqnarray}$$
and for
 $0<y<J$
, we have,
 $$\begin{eqnarray}\displaystyle & & \displaystyle \unicode[STIX]{x1D701}_{y}(X_{i},1,Y_{i})=\Pr (Y_{i}^{\ast }=y\mid X_{i},T_{i}=1,Y_{i})\nonumber\\ \displaystyle & & \displaystyle =\left\{\begin{array}{@{}ll@{}}\frac{\left\{\frac{p_{1}}{J+2}+(1-p_{1})g(X_{i};\unicode[STIX]{x1D6FD})\right\}\binom{J}{y}f(X_{i};\unicode[STIX]{x1D6FE})^{y}\{1-f(X_{i};\unicode[STIX]{x1D6FE})\}^{J-y}}{\frac{p_{1}}{J+2}+(1-p_{1})\left[g(X_{i};\unicode[STIX]{x1D6FD})\binom{J}{y}f(X_{i};\unicode[STIX]{x1D6FE})^{y}\{1-f(X_{i};\unicode[STIX]{x1D6FE})\}^{J-y}+\{1-g(X_{i};\unicode[STIX]{x1D6FD})\}\binom{J}{y+1}f(X_{i};\unicode[STIX]{x1D6FE})^{y+1}\{1-f(X_{i};\unicode[STIX]{x1D6FE})\}^{J-y-1}\right]} & \text{if}~i\in {\mathcal{J}}(1,y+1)\\ \frac{\left[\frac{p_{1}}{J+2}+(1-p_{1})\{1-g(X_{i};\unicode[STIX]{x1D6FD})\}\right]\binom{J}{y}f(X_{i};\unicode[STIX]{x1D6FE})^{y}\{1-f(X_{i};\unicode[STIX]{x1D6FE})\}^{J-y}}{\frac{p_{1}}{J+2}+(1-p_{1})\left[g(X_{i};\unicode[STIX]{x1D6FD})\binom{J}{y-1}f(X_{i};\unicode[STIX]{x1D6FE})^{y-1}\{1-f(X_{i};\unicode[STIX]{x1D6FE})\}^{J-y+1}+\{1-g(X_{i};\unicode[STIX]{x1D6FD})\}\binom{J}{y}f(X_{i};\unicode[STIX]{x1D6FE})^{y}\{1-f(X_{i};\unicode[STIX]{x1D6FE})\}^{J-y}\right]} & \text{if}~i\in {\mathcal{J}}(1,y)\\ \frac{\frac{p_{1}}{J+2}\binom{J}{y}f(X_{i};\unicode[STIX]{x1D6FE})^{y}\{1-f(X_{i};\unicode[STIX]{x1D6FE})\}^{J-y}}{\frac{p_{1}}{J+2}+(1-p_{1})\{1-g(X_{i};\unicode[STIX]{x1D6FD})\}\{1-f(X_{i};\unicode[STIX]{x1D6FE})\}^{J}} & \text{if}~i\in {\mathcal{J}}(1,0)\\ \frac{\frac{p_{1}}{J+2}\binom{J}{y}f(X_{i};\unicode[STIX]{x1D6FE})^{y}\{1-f(X_{i};\unicode[STIX]{x1D6FE})\}^{J-y}}{\frac{p_{1}}{J+2}+(1-p_{1})\left[\{1-g(X_{i};\unicode[STIX]{x1D6FD})\}\binom{J}{Y_{i}}f(X_{i};\unicode[STIX]{x1D6FE})^{Y_{i}}\{1-f(X_{i};\unicode[STIX]{x1D6FE})\}^{J-Y_{i}}+g(X_{i};\unicode[STIX]{x1D6FD})\binom{J}{Y_{i}-1}f(X_{i};\unicode[STIX]{x1D6FE})^{Y_{i}-1}\{1-f(X_{i};\unicode[STIX]{x1D6FE})\}^{J-Y_{i}+1}\right]} & \text{otherwise}.\end{array}\right.\nonumber\end{eqnarray}$$
Finally, the Q-function is given by,
 $$\begin{eqnarray}\displaystyle & & \displaystyle \mathop{\sum }_{i=1}^{n}\mathbb{E}(S_{i}\mid X_{i},T_{i}=1,Y_{i})\log p_{1}+\{1-\mathbb{E}(S_{i}\mid X_{i},T_{i}=1,Y_{i})\}\log (1-p_{1})\nonumber\\ \displaystyle & & \displaystyle \quad +\,\mathbb{E}(S_{i}\mid X_{i},T_{i}=0,Y_{i})\log p_{0}+\{1-\mathbb{E}(S_{i}\mid X_{i},T_{i}=0,Y_{i})\}\log (1-p_{0})\nonumber\\ \displaystyle & & \displaystyle \quad \mathbb{E}(Z_{i}\mid X_{i},T_{i}=1,Y_{i})\log g(X_{i};\unicode[STIX]{x1D6FD})+\{1-\mathbb{E}(Z_{i}\mid X_{i},T_{i}=1,Y_{i})\}\log \{1-g(X_{i};\unicode[STIX]{x1D6FD})\}\nonumber\\ \displaystyle & & \displaystyle \quad +\,\mathbb{E}(Y_{i}^{\ast }\mid X_{i},T_{i},Y_{i})\log f(X_{i};\unicode[STIX]{x1D6FE})+\{J-\mathbb{E}(Y_{i}^{\ast }\mid X_{i},T_{i},Y_{i})\}\log \{1-f(X_{i};\unicode[STIX]{x1D6FE})\}.\end{eqnarray}$$
Hence, the M-steps for
 $p_{0}$
and
 $p_{1}$
are immediate. The M-steps for
 $\unicode[STIX]{x1D6FD}$
and
 $\unicode[STIX]{x1D6FE}$
consist of a series of weighted logistic regressions.
B.3 Details of the Robust Maximum Likelihood Multivariate Regression Estimator
We focus on the logistic regression model whose log-likelihood function is given as,
 $$\begin{eqnarray}\displaystyle & & \displaystyle -\mathop{\sum }_{i=1}^{N}[J\log \{1+\exp (X_{i}^{\top }\unicode[STIX]{x1D6FE})\}+\log \{1+\exp (X_{i}^{\top }\unicode[STIX]{x1D6FD})\}]+\mathop{\sum }_{i\in {\mathcal{J}}(1,J+1)}(X_{i}^{\top }\unicode[STIX]{x1D6FD}+JX_{i}^{\top }\unicode[STIX]{x1D6FE})\nonumber\\ \displaystyle & & \displaystyle +\,\mathop{\sum }_{y=0}^{J}\mathop{\sum }_{i\in {\mathcal{J}}(0,y)}[yX_{i}^{\top }\unicode[STIX]{x1D6FE}+\log \{1+\exp (X_{i}^{\top }\unicode[STIX]{x1D6FD})\}]\nonumber\\ \displaystyle & & \displaystyle +\,\mathop{\sum }_{y=1}^{J}\mathop{\sum }_{i\in {\mathcal{J}}(1,y)}\left[(y-1)X_{i}^{\top }\unicode[STIX]{x1D6FE}+\log \left\{\binom{J}{y-1}\exp (X_{i}^{\top }\unicode[STIX]{x1D6FD})+\binom{J}{y}\exp (X_{i}^{\top }\unicode[STIX]{x1D6FE})\right\}\right]+\text{constant}.\end{eqnarray}$$
Let
 ${\mathcal{L}}_{i}(\unicode[STIX]{x1D6FD},\unicode[STIX]{x1D6FE};X_{i},Y_{i})$
represent the log-likelihood function for observation
 $i$
. Then, the first order condition for each observation is given by,
 $$\begin{eqnarray}\displaystyle & & \displaystyle \frac{\unicode[STIX]{x2202}}{\unicode[STIX]{x2202}\unicode[STIX]{x1D6FD}}{\mathcal{L}}_{i}(\unicode[STIX]{x1D6FD},\unicode[STIX]{x1D6FE};X_{i},Y_{i})\nonumber\\ \displaystyle & & \displaystyle \quad =\left[-\frac{\exp (X_{i}^{\top }\unicode[STIX]{x1D6FD})}{1+\exp (X_{i}^{\top }\unicode[STIX]{x1D6FD})}+\mathbf{1}\{i\in {\mathcal{J}}(1,J+1)\}\right.\nonumber\\ \displaystyle & & \displaystyle \qquad +\left.\mathop{\sum }_{y=0}^{J}\mathbf{1}\{i\in {\mathcal{J}}(0,y)\}\frac{\exp (X_{i}^{\top }\unicode[STIX]{x1D6FD})}{1+\exp (X_{i}^{\top }\unicode[STIX]{x1D6FD})}+\mathop{\sum }_{y=1}^{J}\mathbf{1}\{i\in {\mathcal{J}}(1,y)\}\frac{\binom{J}{y-1}\exp (X_{i}^{\top }\unicode[STIX]{x1D6FD})}{\binom{J}{y-1}\exp (X_{i}^{\top }\unicode[STIX]{x1D6FD})+\binom{J}{y}\exp (X_{i}^{\top }\unicode[STIX]{x1D6FE})}\right]X_{i}\nonumber\\ \displaystyle & & \displaystyle\end{eqnarray}$$
 $$\begin{eqnarray}\displaystyle & & \displaystyle \frac{\unicode[STIX]{x2202}}{\unicode[STIX]{x2202}\unicode[STIX]{x1D6FE}}{\mathcal{L}}_{i}(\unicode[STIX]{x1D6FD},\unicode[STIX]{x1D6FE};X_{i},Y_{i})\nonumber\\ \displaystyle & & \displaystyle \quad =\left[-\frac{J\exp (X_{i}^{\top }\unicode[STIX]{x1D6FE})}{1+\exp (X_{i}^{\top }\unicode[STIX]{x1D6FE})}+J\mathbf{1}\{i\in {\mathcal{J}}(1,J+1)\}\right.\nonumber\\ \displaystyle & & \displaystyle \qquad +\left.\mathop{\sum }_{y=0}^{J}y\mathbf{1}\{i\in {\mathcal{J}}(0,y)\}+\mathop{\sum }_{y=1}^{J}\mathbf{1}\{i\in {\mathcal{J}}(1,y)\}\left((y-1)+\frac{\binom{J}{y}\exp (X_{i}^{\top }\unicode[STIX]{x1D6FE})}{\binom{J}{y-1}\exp (X_{i}^{\top }\unicode[STIX]{x1D6FD})+\binom{J}{y}\exp (X_{i}^{\top }\unicode[STIX]{x1D6FE})}\right)\right]X_{i}.\nonumber\\ \displaystyle & & \displaystyle\end{eqnarray}$$
The sample analogue of the moment condition given in equation (13) can be written as,
 $$\begin{eqnarray}\frac{1}{N}\mathop{\sum }_{i=1}^{N}{\mathcal{M}}_{i}(\unicode[STIX]{x1D6FD};X_{i},Y_{i})=\frac{1}{N}\mathop{\sum }_{i=1}^{N}\left(\frac{\exp (X_{i}^{\top }\unicode[STIX]{x1D6FD})}{1+\exp (X_{i}^{\top }\unicode[STIX]{x1D6FD})}-\hat{\unicode[STIX]{x1D70F}}\right)=0\end{eqnarray}$$
where
 $\hat{\unicode[STIX]{x1D70F}}$
is the DiM estimator. We can also express this condition as
 $$\begin{eqnarray}\frac{1}{N}\mathop{\sum }_{i=1}^{N}{\mathcal{M}}_{i}(\unicode[STIX]{x1D6FD};X_{i},Y_{i})=\frac{1}{N}\mathop{\sum }_{i=1}^{N}\left[T_{i}\left(\frac{\exp (X_{i}^{\top }\unicode[STIX]{x1D6FD})}{1+\exp (X_{i}^{\top }\unicode[STIX]{x1D6FD})}-\frac{N}{N_{1}}Y_{i}\right)+(1-T_{i})\left(\frac{\exp (X_{i}^{\top }\unicode[STIX]{x1D6FD})}{1+\exp (X_{i}^{\top }\unicode[STIX]{x1D6FD})}+\frac{N}{N_{0}}Y_{i}\right)\right],\end{eqnarray}$$
in order to account for the correlation between this moment and the score function.
Putting together all these moment conditions, the efficient GMM estimator is given by,
 $$\begin{eqnarray}(\hat{\unicode[STIX]{x1D6FD}}_{\text{GMM}},\hat{\unicode[STIX]{x1D6FE}}_{\text{GMM}})=\underset{(\unicode[STIX]{x1D6FD},\unicode[STIX]{x1D6FE})}{\operatorname{argmin}}\,{\mathcal{G}}(\unicode[STIX]{x1D6FD},\unicode[STIX]{x1D6FE})^{\top }{\mathcal{W}}(\unicode[STIX]{x1D6FD},\unicode[STIX]{x1D6FE})^{-1}{\mathcal{G}}(\unicode[STIX]{x1D6FD},\unicode[STIX]{x1D6FE})\end{eqnarray}$$
where
 $$\begin{eqnarray}\displaystyle {\mathcal{G}}(\unicode[STIX]{x1D6FD},\unicode[STIX]{x1D6FE}) & = & \displaystyle \frac{1}{N}\mathop{\sum }_{i=1}^{N}{\mathcal{G}}_{i}(\unicode[STIX]{x1D6FD},\unicode[STIX]{x1D6FE})~=~\frac{1}{N}\mathop{\sum }_{i=1}^{N}\left[\frac{\unicode[STIX]{x2202}}{\unicode[STIX]{x2202}\unicode[STIX]{x1D6FD}}{\mathcal{L}}_{i}(\unicode[STIX]{x1D6FD},\unicode[STIX]{x1D6FE};X_{i},Y_{i})^{\top }\frac{\unicode[STIX]{x2202}}{\unicode[STIX]{x2202}\unicode[STIX]{x1D6FE}}{\mathcal{L}}_{i}(\unicode[STIX]{x1D6FD},\unicode[STIX]{x1D6FE};X_{i},Y_{i})^{\top }{\mathcal{M}}_{i}(\unicode[STIX]{x1D6FD};X_{i},Y_{i})^{\top }\right]^{\top }\nonumber\\ \displaystyle & & \displaystyle\end{eqnarray}$$
 $$\begin{eqnarray}\displaystyle {\mathcal{W}}(\unicode[STIX]{x1D6FD},\unicode[STIX]{x1D6FE}) & = & \displaystyle \frac{1}{N}\mathop{\sum }_{i=1}^{N}{\mathcal{G}}_{i}(\unicode[STIX]{x1D6FD},\unicode[STIX]{x1D6FE}){\mathcal{G}}_{i}(\unicode[STIX]{x1D6FD},\unicode[STIX]{x1D6FE})^{\top }.\end{eqnarray}$$
The asymptotic distribution of this estimator is given by:
 $$\begin{eqnarray}\displaystyle \sqrt{N}\left(\left(\begin{array}{@{}c@{}}\hat{\unicode[STIX]{x1D6FD}}\\ \hat{\unicode[STIX]{x1D6FE}}\end{array}\right)-\left(\begin{array}{@{}c@{}}\unicode[STIX]{x1D6FD}\\ \unicode[STIX]{x1D6FE}\end{array}\right)\right){\rightsquigarrow}{\mathcal{N}}\left(0,\left[\left(\mathbb{E}\frac{\unicode[STIX]{x2202}{\mathcal{G}}_{i}(\unicode[STIX]{x1D6FD},\unicode[STIX]{x1D6FE})}{\unicode[STIX]{x2202}(\unicode[STIX]{x1D6FD}^{\top }~\unicode[STIX]{x1D6FE}^{\top })^{\top }}\right)^{\top }\unicode[STIX]{x1D6FA}(\unicode[STIX]{x1D6FD},\unicode[STIX]{x1D6FE})^{-1}\mathbb{E}\frac{\unicode[STIX]{x2202}{\mathcal{G}}_{i}(\unicode[STIX]{x1D6FD},\unicode[STIX]{x1D6FE})}{\unicode[STIX]{x2202}(\unicode[STIX]{x1D6FD}^{\top }~\unicode[STIX]{x1D6FE}^{\top })^{\top }}\right]^{-1}\right) & & \displaystyle\end{eqnarray}$$
where
 $$\begin{eqnarray}\displaystyle \mathbb{E}\frac{\unicode[STIX]{x2202}{\mathcal{G}}_{i}(\unicode[STIX]{x1D6FD},\unicode[STIX]{x1D6FE})}{\unicode[STIX]{x2202}(\unicode[STIX]{x1D6FD}^{\top }~\unicode[STIX]{x1D6FE}^{\top })^{\top }}=\mathbb{E}\left(\begin{array}{@{}cc@{}}\frac{\unicode[STIX]{x2202}^{2}}{\unicode[STIX]{x2202}\unicode[STIX]{x1D6FD}\unicode[STIX]{x2202}\unicode[STIX]{x1D6FD}^{\top }}{\mathcal{L}}_{i}(\unicode[STIX]{x1D6FD},\unicode[STIX]{x1D6FE};X_{i},Y_{i}) & \frac{\unicode[STIX]{x2202}^{2}}{\unicode[STIX]{x2202}\unicode[STIX]{x1D6FD}\unicode[STIX]{x2202}\unicode[STIX]{x1D6FE}^{\top }}{\mathcal{L}}_{i}(\unicode[STIX]{x1D6FD},\unicode[STIX]{x1D6FE};X_{i},Y_{i})\\ \frac{\unicode[STIX]{x2202}^{2}}{\unicode[STIX]{x2202}\unicode[STIX]{x1D6FE}\unicode[STIX]{x2202}\unicode[STIX]{x1D6FD}^{\top }}{\mathcal{L}}_{i}(\unicode[STIX]{x1D6FD},\unicode[STIX]{x1D6FE};X_{i},Y_{i}) & \frac{\unicode[STIX]{x2202}^{2}}{\unicode[STIX]{x2202}\unicode[STIX]{x1D6FE}\unicode[STIX]{x2202}\unicode[STIX]{x1D6FE}^{\top }}{\mathcal{L}}_{i}(\unicode[STIX]{x1D6FD},\unicode[STIX]{x1D6FE};X_{i},Y_{i})\\ \frac{\unicode[STIX]{x2202}}{\unicode[STIX]{x2202}\unicode[STIX]{x1D6FD}^{\top }}{\mathcal{M}}_{i}(\unicode[STIX]{x1D6FD};X_{i},Y_{i}) & 0\end{array}\right) & & \displaystyle\end{eqnarray}$$
and
 $$\begin{eqnarray}\displaystyle \unicode[STIX]{x1D6FA}(\unicode[STIX]{x1D6FD},\unicode[STIX]{x1D6FE}) & = & \displaystyle \mathbb{E}\left[\left(\frac{\unicode[STIX]{x2202}{\mathcal{G}}_{i}(\unicode[STIX]{x1D6FD},\unicode[STIX]{x1D6FE})}{\unicode[STIX]{x2202}(\unicode[STIX]{x1D6FD}^{\top }~\unicode[STIX]{x1D6FE}^{\top })^{\top }}\right)\left(\frac{\unicode[STIX]{x2202}{\mathcal{G}}_{i}(\unicode[STIX]{x1D6FD},\unicode[STIX]{x1D6FE})}{\unicode[STIX]{x2202}(\unicode[STIX]{x1D6FD}^{\top }~\unicode[STIX]{x1D6FE}^{\top })^{\top }}\right)^{\top }\right].\end{eqnarray}$$
Note that the second derivatives are given by,
 $$\begin{eqnarray}\displaystyle & & \displaystyle \frac{\unicode[STIX]{x2202}^{2}}{\unicode[STIX]{x2202}\unicode[STIX]{x1D6FD}\unicode[STIX]{x2202}\unicode[STIX]{x1D6FD}^{\top }}{\mathcal{L}}_{i}(\unicode[STIX]{x1D6FD},\unicode[STIX]{x1D6FE};X_{i},Y_{i})\nonumber\\ \displaystyle & & \displaystyle \quad =\left[-\frac{\exp (X_{i}^{\top }\unicode[STIX]{x1D6FD})}{\{1+\exp (X_{i}^{\top }\unicode[STIX]{x1D6FD})\}^{2}}+\mathop{\sum }_{y=0}^{J}\mathbf{1}\{i\in {\mathcal{J}}(0,y)\}\frac{\exp (X_{i}^{\top }\unicode[STIX]{x1D6FD})}{\{1+\exp (X_{i}^{\top }\unicode[STIX]{x1D6FD})\}^{2}}\right.\nonumber\\ \displaystyle & & \displaystyle \qquad +\left.\mathop{\sum }_{y=1}^{J}\mathbf{1}\{i\in {\mathcal{J}}(1,y)\}\frac{\exp \left\{\binom{J}{y-1}\binom{J}{y}X_{i}^{\top }(\unicode[STIX]{x1D6FE}+\unicode[STIX]{x1D6FD})\right\}}{\left\{\binom{J}{y-1}\exp (X_{i}^{\top }\unicode[STIX]{x1D6FD})+\binom{J}{y}\exp (X_{i}^{\top }\unicode[STIX]{x1D6FE})\right\}^{2}}\right]X_{i}X_{i}^{\top }\end{eqnarray}$$
 $$\begin{eqnarray}\displaystyle & & \displaystyle \frac{\unicode[STIX]{x2202}^{2}}{\unicode[STIX]{x2202}\unicode[STIX]{x1D6FE}\unicode[STIX]{x2202}\unicode[STIX]{x1D6FE}^{\top }}{\mathcal{L}}_{i}(\unicode[STIX]{x1D6FD},\unicode[STIX]{x1D6FE};X_{i},Y_{i})\nonumber\\ \displaystyle & & \displaystyle \quad =\left[-\frac{J\exp (X_{i}^{\top }\unicode[STIX]{x1D6FE})}{\{1+\exp (X_{i}^{\top }\unicode[STIX]{x1D6FE})\}^{2}}+\mathop{\sum }_{y=1}^{J}\mathbf{1}\{i\in {\mathcal{J}}(1,y)\}\frac{\exp \left\{\binom{J}{y-1}\binom{J}{y}X_{i}^{\top }(\unicode[STIX]{x1D6FE}+\unicode[STIX]{x1D6FD})\right\}}{\left\{\binom{J}{y-1}\exp (X_{i}^{\top }\unicode[STIX]{x1D6FD})+\binom{J}{y}\exp (X_{i}^{\top }\unicode[STIX]{x1D6FE})\right\}^{2}}\right]X_{i}X_{i}^{\top }\nonumber\\ \displaystyle & & \displaystyle\end{eqnarray}$$
 $$\begin{eqnarray}\displaystyle & & \displaystyle \frac{\unicode[STIX]{x2202}^{2}}{\unicode[STIX]{x2202}\unicode[STIX]{x1D6FD}\unicode[STIX]{x2202}\unicode[STIX]{x1D6FE}^{\top }}{\mathcal{L}}_{i}(\unicode[STIX]{x1D6FD},\unicode[STIX]{x1D6FE};X_{i},Y_{i})\nonumber\\ \displaystyle & & \displaystyle \quad =-\left[\mathop{\sum }_{y=1}^{J}\mathbf{1}\{i\in {\mathcal{J}}(1,y)\}\frac{\exp \left\{\binom{J}{y-1}\binom{J}{y}X_{i}^{\top }(\unicode[STIX]{x1D6FE}+\unicode[STIX]{x1D6FD})\right\}}{\left\{\binom{J}{y-1}\exp (X_{i}^{\top }\unicode[STIX]{x1D6FD})+\binom{J}{y}\exp (X_{i}^{\top }\unicode[STIX]{x1D6FE})\right\}^{2}}\right]X_{i}X_{i}^{\top }.\end{eqnarray}$$
Supplementary material
For supplementary material accompanying this paper, please visit https://doi.org/10.1017/pan.2018.56.