Biofumigation is an agronomic practice that could be used in organic farming to reduce the weed seedbank (Matthiessen and Kirkegaard Reference Matthiessen and Kirkegaard2006). Volatile phytotoxic chemicals are released from decomposing Brassica tissues and provide weed suppression. Biofumigation crops compete with and suppress weeds through vigorous early-season growth, leaching of glucosinolates (GSLs) into the soil during plant growth, and release of allelochemicals at incorporation of plant residues (Narwal and Haouala Reference Narwal and Haouala2013). The most common volatiles produced during the breakdown of Brassica are isothiocyanates (ITCs), which are released following tissue disruption when myrosinase enzymes hydrolyze GSLs in the presence of water (Michel Reference Michel2008; Morra and Kirkegaard Reference Morra and Kirkegaard2002). However, low pH could lead hydrolysis of GSLs to generate other compounds, such as nitriles, epinitriles, oxazolidinethiones, and ionic thiocyanates that could impact the targeted pest response (Brown and Morra Reference Brown and Morra1997; Parvatha Reference Parvatha2013). ITCs react easily with cellular thiols such as cysteines in proteins and low-molecular-weight thiols (especially glutathione), producing dithiocarbamate derivatives. These actions lead to a loss of protein structure and function and decrease enzymatic activity (Dufour et al. Reference Dufour, Stahl, Rosenfeld, Stintzi and Baysse2013; Weir et al. Reference Weir, Park and Vivanco2004). In seeds, ITCs interact with glycolytic enzymes during the germination process and thereby prevent or delay seed/tuber germination (Drobinca et al. Reference Drobinca, Kristian and Augustin1977).
ITCs are strong germination suppressants of many different weed species (Al-Khatib et al. Reference Al-Khatib, Libbey and Boydston1997; Al-Sherif Reference Al-Sherif2013; Boydston et al. Reference Boydston, Al-Khatib, Vaughn, Collins and Alva2004; Petersen et al. Reference Petersen, Belz, Walker and Hurle2001). Weed responses to biofumigation or exposure to ITCs are known to be species specific (Al-Khatib et al. Reference Al-Khatib, Libbey and Boydston1997; Björkman et al. Reference Björkman, Lowry, Shail, Brainard, Anderson and Masiunas2015; Norsworthy and Meehan Reference Norsworthy and Meehan2005a, Reference Norsworthy and Meehan2005b; Mattner et al. Reference Mattner, Porter, Gounder, Shanks, Wren and Allen2008; Parvatha Reference Parvatha2013). As with other toxic molecules, higher concentrations of ITCs and increasing exposure time increase inhibition of seed and tuber germination, leading to mortality (Aliki et al. Reference Aliki, Reade and Back2014; Al-Sherif Reference Al-Sherif2013; Bangarwa and Norsworthy Reference Bangarwa and Norsworthy2015; Mattner et al. Reference Mattner, Porter, Gounder, Shanks, Wren and Allen2008; Petersen et al. Reference Petersen, Belz, Walker and Hurle2001). High concentrations of ITCs penetrate the seeds and irreversibly inhibit protein synthesis, and the seeds lose their viability (Leblova-Svobodova and Kostir Reference Leblova-Svobodova and Kostir1962).
Weed management practices act on key processes of population dynamics, including seed dormancy (Dyer Reference Dyer1995), to reduce weed infestations (Gallandt et al. Reference Gallandt, Liebman and Huggins1999). Dormancy is an adaptive trait that promotes the survival and distribution over time in an ever-changing environment of many organisms (Foley Reference Foley2001). Seed dormancy, still a misunderstood seed trait (Hilhorst Reference Hilhorst2011), is a state wherein viable seeds fail to germinate under a specific set of environmental conditions that are normally favorable for their germination (Baskin and Baskin Reference Baskin and Baskin2004; Simpson Reference Simpson1990). Alternatively, quiescent ungerminated seeds will germinate under those required conditions.
Several classification systems and nomenclatures exist for seed dormancy. Primary and secondary dormancy refer to the period when dormancy occurs (Foley Reference Foley2001). Primary dormancy denotes freshly mature imbibed seeds removed from the mother plant before dispersal or collected right after dispersal fail to germinate. Secondary dormancy generally occurs after seeds encounter environmental conditions for a certain period that induce the quiescent state (after-ripening) (Bewley and Black Reference Bewley and Black1994). The classification system used by Baskin and Baskin (Reference Baskin and Baskin1998a, Reference Baskin and Baskin2004) includes two main categories of dormancy referring to the location of the mechanisms or constraints to germination. Exogenous or seed coat–imposed dormancy refers to characteristics of covering structures that prevent germination, whereas endogenous dormancy refers to characteristics of the embryo that prevent germination. This classification system examines the mechanism involved and includes five classes of seed dormancy: physiological (PD), morphological (MD), morphophysiological (MPD), physical (PY), and combinational (PY + PD). PD is caused by physiological inhibitory mechanisms in the embryo that prevent radicle growth. However, structures surrounding the embryo may play a role in PD. Covering structures could restrict oxygen availability for embryos or they could regulate the release of growth inhibitors to the embryo. Common lambsquarters, common ragweed, and green foxtail exhibit PD. MD refers to an underdeveloped and differentiated embryo. Time will allow embryos to develop and grow, thus allowing germination. Wild carrot is a biennial weed with this class of seed dormancy. PY is generally caused by the testa being impermeable to water. These seeds contain heavily lignified palisade cells impregnated with various water-repellent compounds (Baskin and Baskin Reference Baskin and Baskin1998a, Reference Baskin and Baskin2004). To release dormancy, a specialized “water gap” on the impermeable layer must be opened in response to appropriate environmental signals. Stratification could also release dormancy, as for bird vetch, red clover, and velvetleaf.
The susceptibility of dormant and quiescent seeds in the soil seedbank to biofumigation is important information that could lead to efficient weed management in crop fields. Biofumigation could promote seed mortality and reduce weed germination and establishment after incorporation of mustard biomass. To know whether this method can be used to reduce weed seedbanks, it is essential to clearly understand how biofumigation affects seeds. Mechanisms responsible for different classes of seed dormancy or seed characteristics could reflect the susceptibility of various weed species to biofumigation. Furthermore, how dormancy state influences seed susceptibility to this type of allelochemical pressure is not reported in the literature. Our study differs from previous work by investigating relationships among seed responses, seed dormancy, and seed morphological parameters for a better understanding of weed responses reported in the literature. Annual emergence patterns and seasonal changes in states of dormancy are important factors of seedbank dynamics and govern weed pressure over seasons (Cavers and Benoit Reference Cavers and Benoit1989). Accurate comprehension of the tolerance of dormant seeds to biofumigation is necessary to understand seedbank response to field biofumigation.
Three hypotheses were formulated: 1) seeds with PY are less affected by ITCs than seeds with PD, because greater protection is provided by the testa; 2) the proportion of dormant seeds in a seed lot (i.e., seeds collected from several individuals of one population) decreases the impact of biofumigation on seed germination and survival response (intra- and interspecific); and 3) physical parameters of the seed are related to species germination and survival after biofumigation. The objectives of this study were to determine weed seed responses to allelopathic compounds generated during biofumigation and to assess species susceptibility related to seed dormancy and seed morphological parameters. The aims of the study were to clarify weed responses to biofumigation and underline which morphological variable, such as testa thickness, seed size, or proportion of dormant seeds, explains susceptibility of a weed species to biofumigation.
Materials and Methods
Dose–Response Experiment
Species and Seed Collection
Germination tests were conducted to evaluate the herbicidal activity of different rates of dry mustard tissues on germination and seed viability of common weeds in southern Quebec that exhibit various forms of dormancy: common lambsquarters (PD), bird vetch (PY), wild carrot (MD), common ragweed (PD), green foxtail (PD), velvetleaf (PY), hairy galinsoga (no dormancy), and red clover (PY). Dormancy classes of each species are reported in Baskin and Baskin (Reference Baskin and Baskin1998a). Mature weed seed lots were randomly collected in the fall of 2012 from mature plants at the former Research and Development Institute for the Agri-environment (IRDA) research station fields (St-Hyacinthe, QC, Canada, 45.619°N, 72.958°W), where seeds fell from vigorous agitation. Seeds were overwintered in an unheated storage facility under natural field temperature to release primary dormancy before experiments were conducted. Natural viabilities (±SE) measured for each seed lot (dormant and germinated seeds) were 82.8±2.8% for common ragweed, 94.8±1.7% for common lambsquarters, 93.6±1.1% for wild carrot, 75.6±2.8% for green foxtail, 60.4±3.8% for bird vetch, 98.0±1.0% for velvetleaf, 97.3±1.2% for hairy galinsoga, and 80.2±3.0% for red clover.
Bioassay Methodology
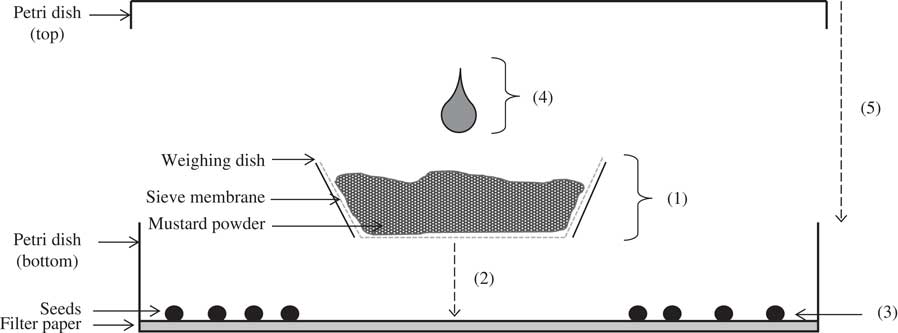
A procedure was developed to expose seeds to the compounds generated during the biofumigation in petri dish germination tests while avoiding direct contact of plant material with the seeds. The study was carried out at the Organic Agriculture Innovation Platform (OAIP), IRDA, St-Bruno-de-Montarville, QC, Canada. Indian mustard, selected for its purported high levels of GSL sinigrin (Taylor et al. Reference Taylor, Kenyon, Giela, Keenan and Rosser2014), was used as the biofumigant. Plants were grown until flowering in 19-cm-diameter by 17.5-cm-deep pots (ITML Elite 4 L, HC Companies, Middlefield, OH) containing a commercial potting mix (Agro Mix® O2, Fafard, Saint-Bonaventure, Canada) in a growth chamber (Conviron E15) set at 26±2 C, 16/8-h light/dark (186 μmol m−2 s−1). Once plants had flowered, the aboveground plant parts were harvested, dried at 35 C for 5 d, and ground with a laboratory mill grinder (unknown model, Arthur H. Thomas). The detail of the assembly of an experimental unit is shown in Figure 1. (1) Dried mustard powder was placed within a modified weighing dish, where the bottom was replaced by a 5-µm pure nylon sieve membrane (CellMicroSievesTM, Biodesign of New York, Carmel, NY). The sieve membrane served as a barrier to prevent potential fungal contamination and allowed both volatile and water-soluble components from the mustard to be released in the petri dish. (2) A qualitative filter paper (Whatman, diameter 90 mm, thickness 190 μm, Fisher Scientific, Whitby, ON) was placed in a 100 by 15 mm polystyrene disposable petri dish (VWR International, Mississauga, ON), and the weighing dish was placed at the center. (3) Fifty weed seeds were washed thoroughly with distilled water and then placed around the weighing dish. Seeds were exposed to six treatments in this experiment: 0 (control), 1.94, 2.90, 5.81, 11.61, and 17.41 mg cm−2 of dry tissues of Indian mustard. (4) Just before the petri dish was sealed, 2 ml of distilled water was added on the seeds and 4 to 6 ml of distilled water on the weighing dish to completely humidify the mustard tissues (more biomass required more water). Water allowed the GSL–myrosinase enzymatic reaction to occur. (5) The petri dish was sealed with Parafilm® (5-cm width, Fisher Scientific) and immediately incubated in a growth chamber (MLR-350H, Sanyo) set to 22.5±0.5 C, 16/8-h light/dark (372 μmol m−2 s−1). For all test species, the temperature setting allowed seeds to germinate. Petri dishes were first opened after 4 d to water the seeds, measure germination, and record further observations. After 8 d, the weighing dishes with the biofumigant material were removed from the petri dishes. Under field situations, volatile ITCs mostly disappear 4 d after soil incorporation (Bangarwa and Norsworthy Reference Bangarwa and Norsworthy2015). Seed germination was recorded every 2 to 3 d for 1 mo, until germination stopped in every treatment. Five replicates per treatment were arranged in a completely randomized design. The experiment was replicated twice. The viability of nongerminated seeds was evaluated using a 1% solution of 2,3,5-triphenyl-2H-tetrazolium chloride (Fisher Scientific, Whitby, ON, Canada), in accordance with the Tetrazolium Testing Handbook for agricultural seeds (Peters Reference Peters2000) and the International Seed Testing Association Working Sheets on Tetrazolium Testing (Leist et al. Reference Leist, Kramer and Jonitz2003). Viable nongerminated seeds at the end of the assays were considered dormant. Initial dormancy of the seed lots (proportion of dormant seeds in the control) from the sampled population was also determined with tetrazolium tests. Changes in the proportion of dormant seeds in treatments compared with the control reflected how biofumigation could influence the relative proportion of dormant seeds.
Diagram of an experimental unit and step-by-step methodology used in dose–response and intraspecific dormancy experiments. (1) Dried Indian mustard powder was weighed per treatment and placed within a weighing dish. The bottom of the weighing dish was replaced by a sieve membrane. (2) A filter paper was placed in a polystyrene disposable petri dish, and the weighing dish deposed at the center. (3) Seeds were washed with distilled water and placed around the weighing dish. (4) Water was added on the seeds and on the mustard tissues. (5) The petri dish was sealed with Parafilm® and immediately incubated.

Seed Morphological Parameters. Seed morphology of each test species in the dose–response experiment was characterized to establish relations between responses and physical parameters. Imaging software (Motic Image Plus 2.0, Motic, Hong Kong) was used to calculate seed length, seed width, seed thickness (height), thickness of the testa, and seed surface. Pictures were taken with a Moticam 580 (Motic) camera mounted on a Meiji Techno RZ (Japan) stereomicroscope. For seed length, width, and surface, a single picture was taken from a seed placed longitudinally. The imaging software allows measurement of straight lines, which were used to measure length, width, and thickness, and area automatic calculation was used for seed surface. Seed weight, embryo weight, and testa weight were measured with a PR2003 Delta Range® (Mettler Toledo, Switzerland) analytic scale. Seeds were manually dissected by splitting each seed evenly with one longitudinal cut before evaluation of thickness of testa, embryo weight, and testa weight. Following the dissection, one-half of the seed was placed directly under the stereomicroscope, permitting a perpendicular view of the cut. A picture was taken, and testa thickness was measured using the software’s straight-line calculation mode. The embryo was then manually removed from the two halves of the seed. Embryo and testa were weighed separately. Except for seed weight, all measurements were done on 30 seeds. Seed weight was measured on eight replicates of 100 seeds. These measurements were used to establish the testa weight:seed weight ratio and embryo weight:seed weight ratio and to estimate seed volume: ((4π(length)/2(width)/2(thickness)/2)/3=volume).
Intraspecific Dormancy Experiment. Germination tests following the same methodology described in the dose–response experiment section were used to compare intraspecific seed responses to biofumigation with respect to different dormancy states (primary and secondary). Mature weed seed lots of common lambsquarters, common ragweed, wild carrot, bird vetch, and green foxtail were randomly collected during fall 2012 (assessed as secondary dormancy) and again during fall 2013 (assessed as primary dormancy) at OAIP in St-Bruno (45.533°N, 73.35°W). Seeds collected in 2012 overwintered outside in an unheated storage facility for after-ripening treatment. Seeds collected in 2013 were stored in the dark at room temperature until the beginning of the laboratory experiments and were assumed to be in a primary dormancy state. For each species, four treatments were compared: seeds with or without after-ripening treatment that were exposed or not to 5.81 mg cm−2 of dry tissues of Indian mustard. Because bird vetch and green foxtail displayed high tolerance to biofumigation in the previous experiments, rates for these species were increased to 17.41 and 11.61 mg cm−2 of dry tissues, respectively. Percentages of germination, mortality, and dormant seeds were measured as in the dose–response experiment. Four replicates per treatment were arranged in a completely randomized design. The experiment was replicated twice.
Analysis of ITCs. Analysis by headspace (HS) (TurboMatrix™ HS 40 Trap, PerkinElmer, Waltham, MA) and gas chromatography–mass spectrometry (GC-MS) (Clarus® 680 [GC], and Clarus® SQ8 [MS], PerkinElmer) were performed on dried Indian mustard powder material before experiments to identify and quantify ITCs and other allelopathic compounds released during the biofumigation. Samples were prepared for HS GC by adding 5 ml of water to 0.2 g of dried mustard directly in the HS vials, followed by a 5-h incubation. The HS operation conditions were: vial equilibration at 70 C for 20 min, needle temperature at 105 C, transfer line at 140 C, carrier helium pressure at 177.2kPa, vial pressurization time of 2 min, injection time of 0.02 min, and withdrawal time of 0.4 min. HS analysis revealed mainly the production of allyl-ITC, allyl-thiocyanate, and butyl-ITC, so these specific external standards were used for quantitative measurements. Samples were analyzed on GC-MS with a capillary column (Elite 5MS, 30 m by 0.25 mm by 0.5 µm). The temperature program was 40 C for 1 min followed by 10 C for 1 min to 130 C. Mass spectrometry was run at 200 C over a scan range of 35 to 350 Da, with scan time of 0.1 s and interscan delay of 0.06 s. To ensure the biofumigant potential of the dried material used in the petri dish methodology, comparative analyses were completed with fresh material and dried ground material at a low temperature. Quantities of ITCs measured from different sampling conditions were similar (296.7 μg g−1 of allyl-ITC in fresh material vs. 406.1 μg g−1 of allyl-ITC in dried material, 2 h of incubation). The melting temperature varies for different proteins, and temperatures lower than 40 C should not denature them; activity of myrosinase was still unaffected at 40 C (Van Eylen et al. Reference Van Eylen, Oey, Hendrickx and Van Loey2007). Furthermore, without water, the GSL-myrosinase chemical reaction leading to ITC production cannot occur during grinding. Keeping the GSLs and myrosinase intact by drying the biomass preserved the biofumigant potential in dried mustard tissues.
Statistical Analysis
Dose–Response Experiment
Linear and nonlinear curve fittings were performed to establish the germination, mortality, and dormancy responses to mustard biomass quantities using TableCurve 2D v. 5.01 and SigmaPlot v. 12.5 (Systat Software, San Jose, CA). Seed germination (Equation 1) and mortality (Equation 2) were adjusted to the response observed in the control treatment as follows:
 $${\rm Adjusted}\,{\rm germination}\,{\equals}\,\left( {{\rm G}_{{\rm T}} \,/\,{\rm G}_{{\rm C}} } \right){\times}{\rm 1}00$$
with GT corresponding to the germination percentage observed in a treatment and GC to the mean percentage of germination observed in the control.
 $${\rm Adjusted}\,{\rm mortality}\,{\equals}\,{\rm M}_{{\rm T}} {\minus}{\rm M}_{{\rm C}} $$
with MT corresponding to the mortality observed in the treatment and MC to the mean percentage of mortality observed in the control. Means of adjusted germination, adjusted mortality, and percentage of dormancy are the average of two replicated assays. Percentages of dormancy were not adjusted before analysis. Adjusted germination and mortality were used independently to establish lethal doses of dry mustard biomass that kill 50% of the total viable seeds (LD50) and estimated half-maximal effective doses of dry mustard biomass that decrease germination (ED50) and maximal mortality for each species. ED50, LD50, and maximal mortality were calculated using the estimated parameters of the fitted curves. For the logistic dose–response curve with three parameters, ED50 and LD50 correspond to parameter b and maximal mortality to parameter a; c is a shape parameters logistics curve. For the logistic curves, with three parameters, maximal mortality corresponds to parameter a, ED50 and LD50 correspond to Equation 3:
 $${\rm ED}_{{{\rm 5}0}} \,{\rm or}\,{\rm LD}_{{{\rm 5}0}} \,{\equals}\,b{\plus}\left( {{\rm 3}.{\rm 52}\,c} \right)/{\rm 2}$$
Those values served as comparative responses of interspecific susceptibility to biofumigation suitable for further regression analysis. The percentage of dormancy was subjected to ANOVA, and Tukey’s honestly significant difference (HSD) was used to separate treatment means at 0.05 probability level. Furthermore, ANOVAs were performed on LD50, ED50, or maximal mortality per seed dormancy classes.
Species were classified based on their relative susceptibility to biofumigation according to ED50, LD50, and maximal mortality as a first assessment of interspecific similarity. Similar estimated parameters without overlapping their 95% confidence limits were classified together, not according to a specific value of the estimated parameter. Consequently, it was possible to observe which species or group of species were more affected by biofumigation in terms of germination and survival.
Seed Morphological Parameters and Relations with Seed Responses
Seed responses in the dose–response experiment (LD50, ED50, and maximal adjusted mortality) were related to all seed morphological parameters measured. Seed parameters, initial dormancy in seed lots, and seed responses were first analyzed by principal component analysis (PCA) with R software v. 3.0.1 (R Development Core Team 2008) and the library ‘vegan.’ PCA was calculated with redundancy analysis function. Scaling preserved the correlation between descriptors.
To confirm correlations underlined by the PCA, each seed response was analyzed with regression analyses. One or two seed parameters served as explanatory variables, and the significance of interaction between explanatory variables was assessed. All possible combinations of seed parameters were analyzed for LD50, ED50, or maximal adjusted mortality in order to find unrevealed relations by PCA. Regression analyses were performed using the lm function of R software. Those analyses were performed on dicotyledonous species only or for all species to assess whether the monocotyledonous species affected the conclusion of the tests.
Intraspecific Dormancy Experiment
ANOVAs and Tukey’s HSD were used for mean comparison of seed responses (percentage of germination, mortality, and dormancy). Dependent variables were log-transformed [log (x+1)] whenever required to respect normality and homoscedasticity assumptions. For each dormancy state, the germination, mortality, and dormancy were adjusted using Equation 4 to reflect only the relative impact of biofumigation to the control:
 $${\rm Impact}\,{\rm of}\,{\rm biofumigation}\,{\equals}\,\left( {\left( {{\rm R}_{{\rm T}} {\minus}{\rm R}_{{\rm C}} } \right)\,/\,{\rm R}_{{\rm C}} } \right){\times}{\rm 1}00$$
with RT corresponding to the percent response value observed in the treatment and RC to the mean percent response value observed in the corresponding control. The RC term was used to correct seed germination, mortality, and dormancy not caused by biofumigation treatments. A negative value of the impact of biofumigation indicates that the response decreased after treatment; a positive value indicates that the response increased after treatment. Statistical differences of the impact of biofumigation between dormancy states for each species were assessed by ANOVAs at 0.05 probability level.
Results and Discussion
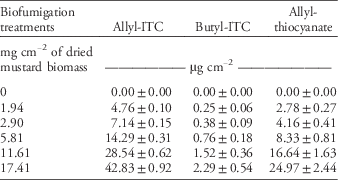
Analysis of ITCs. The chemical analysis and detection from the HS and GC-MS demonstrated that the three main compounds released were allyl-ITC (2,455±53 µg g−1 of dried biomass), allyl-thiocyanate (1,431±140 µg g−1), and butyl-ITC (131±31 µg g−1). Analysis also revealed traces of butenyl-ITC, isopropyl-ITC, and butane 1-ITC. Accordingly, the amount of allelochemicals released from each rate of mustard tissues in the petri dish assays was calculated (Table 1).
Quantities of allelochemicals released in the petri dish assays according to rates of dry Indian mustard material.Footnote a

a Abbreviation: ITC, isothiocyanate. Analysis by headspace and gas chromatography–mass spectrometry of 0.2 g of dry Indian mustard. Based on the calculation of allyl-ITC detected at 2,455±53 µg g−1 of dried biomass, butyl-ITC at 131±31 µg g−1, allyl-thiocyanate at 1,431±140 µg g−1. Analysis also revealed traces of butenyl-ITC, isopropyl-ITC, and butane 1-ITC.
In the field, plants do not release their total potential ITCs (Morra and Kirkegaard Reference Morra and Kirkegaard2002). Unhydrolyzed GSLs in soil are mainly due to incomplete tissue pulverization or other limitations to GSL hydrolysis (soil condition, water availability, crop variety). In a field experiment, Morra and Kirkegaard (Reference Morra and Kirkegaard2002) measured around 1% of ITC release efficiency and succeeded in increasing this to 26% using frozen plant material. In their experiment, Brassica plants were not chopped, and there was no postincorporation irrigation. When biofumigation was carried out under optimum conditions, ITC release efficiency increased to 9.7% to 18.5%, with a peak at 56% when mustard with high GSL concentration was incorporated (Bangarwa et al. Reference Bangarwa, Norsworthy, Mattice and Gbur2011; Gimsing and Kirkegaard Reference Gimsing and Kirkegaard2006). The mid-rate 5.81 mg cm−2 of dried mustard powder was equivalent to 10% of a field dry mustard biomass of 7,000 kg ha−1, based on a conversion of GSLs in Brassica tissues into ITCs of 10%. The results of the present experiment were presented via rates of dry plant tissues but should also be considered as the corresponding quantity of allelochemicals released.
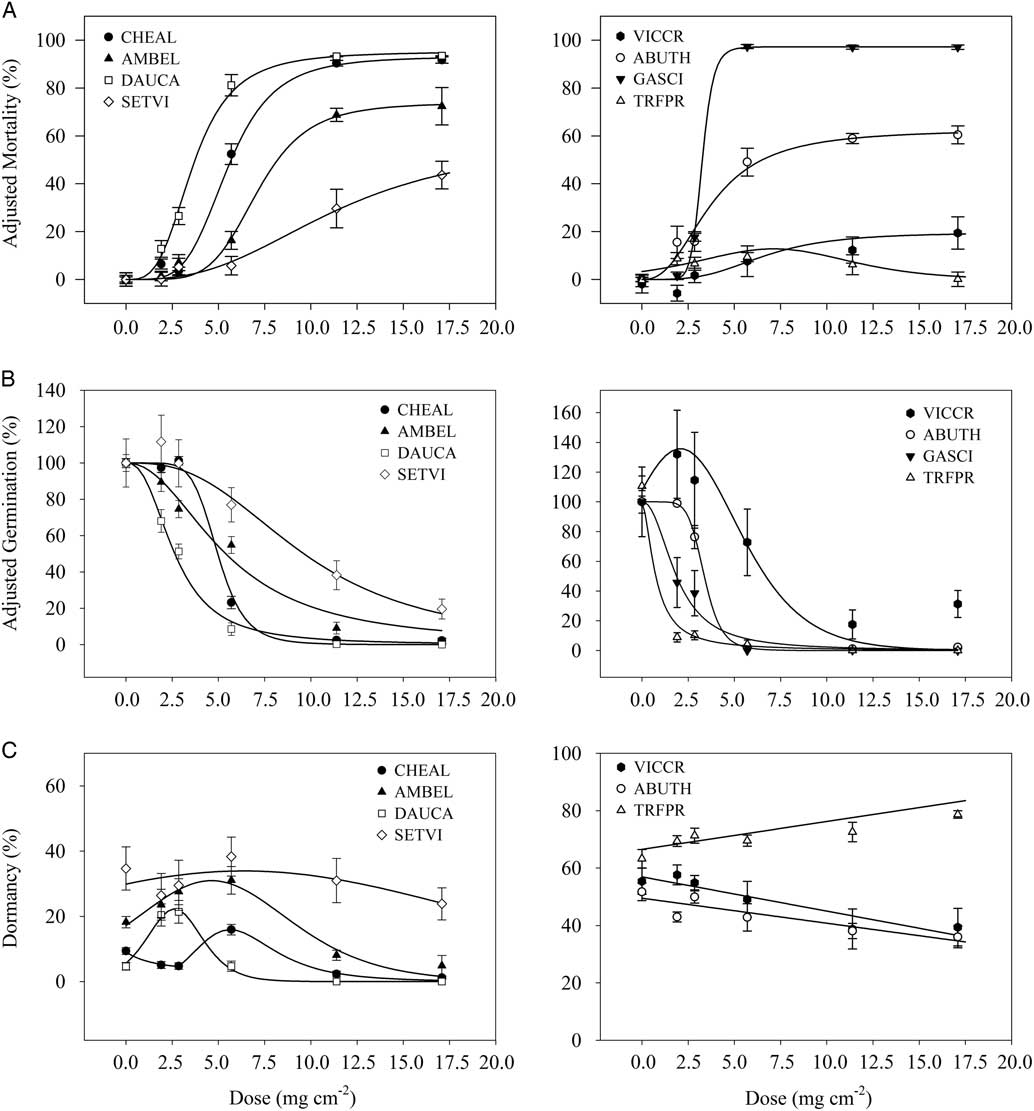
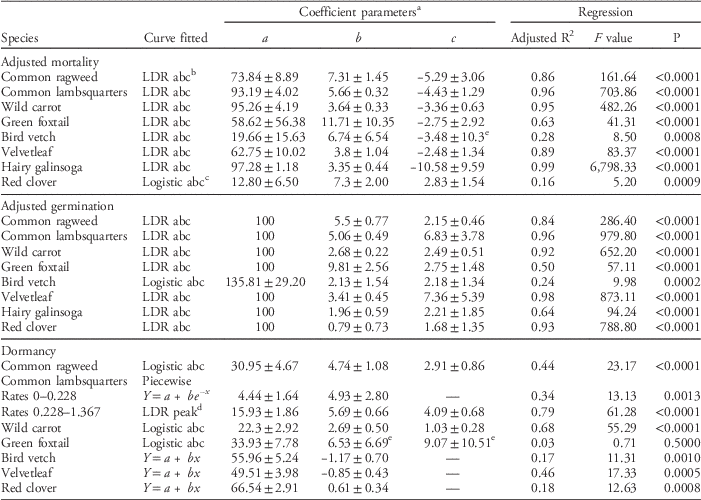
Dose–Response Experiment. Curve fitting of seed responses following increasing biofumigation rates are presented in Figure 2, and details of equations and statistical parameters are given in Table 2. Except for red clover, increasing biofumigation rates increased mortality following a logistic dose response (Figure 2A). Response of red clover fit a logistic curve with three parameters, with higher rates causing almost no mortality. Biofumigation had the most lethal effect on hairy galinsoga, wild carrot, and common lambsquarters, with mortality reaching 97%, 95%, and 93%, respectively.
Weed seed responses to growing rates of Indian mustard dried biomass in a petri dish experiment: (A) percentage of adjusted mortality, (B) percentage of adjusted germination, and (C) percentage of dormant viable seeds. Abbreviations: ABUTH, velvetleaf; AMBEL, common ragweed; CHEAL, common lambsquarters; DAUCA, wild carrot; GASCI, hairy galinsoga; SETVI, green foxtail; TRFPR, red clover; VICCR, bird vetch. Vertical bars indicate ±SE. Equations and regression coefficients are presented in Table 1.

Parameters and curves of the linear and nonlinear responses of the weed seeds to biofumigation as represented in Figure. 1.

a ±confidence limits at 95% of each parameter estimate.
b
LDR abc: logistic dose response with three parameters:
 $y{\equals}a/(1{\plus}(x/b)^{c} )$
, where a=maximal adjusted mortality, and b=ED50 for germination and LD50 for adjusted mortality. For adjusted germination curves, the parameter a was fixed to 100.
c
Logistic abc:
 $y\,{\equals}\,4a\,{\rm exp}\left[ {{\minus}((x{\minus}b)/c)} \right]\,/\,\left[ {1{\plus}{\rm exp}\left[ {{\minus}((x{\minus}b)/c)} \right]} \right]^{2} $
, where a=maximal adjusted mortality, and b +(3.52c)/2=ED50 for germination and LD50 for adjusted mortality.
d
LDR peak:
 $y\,{\equals}\,(4ax^{{({\minus}c{\minus}1)}} \,b^{{(c{\plus}1)}} \,c^{2} )/((c{\minus}1{\plus}cx^{{({\minus}c)}} \,b^{c} {\plus}x^{{({\minus}c)}} \,b^{c} )^{2} )$
.
e Parameter nonsignificant (P>0.05).
Biofumigation decreased cumulative germination of all species (Figure 2B). Rates of 1.94 and 2.90 mg cm−2 of mustard dry tissues stimulated germination of bird vetch, following a logistic curve with three parameters. Germination responses of common lambsquarters, wild carrot, common ragweed, green foxtail, velvetleaf, hairy galinsoga, and red clover fit a logistic dose–response curve. Red clover, hairy galinsoga, and wild carrot had the lowest ED50 (0.06, 0.15, and 0.21 mg cm−2, respectively) (Table 2). Being nondormant (De Cauwer et al. Reference De Cauwer, Devos, Claerhout, Bulcke and Reheul2014), hairy galinsoga seeds can only germinate or die under the treatments. For this species, all nongerminated seeds were dead.
Percentage of dormant seed responses were hormetic (common lambsquarters, common ragweed, and wild carrot), positive (red clover), negative (velvetleaf and bird vetch), or without impact (green foxtail) (Figure 2). Nongerminated seeds of red clover were not dead, but became dormant (Figure 2C). The numbers of dormant seeds were significantly reduced at 11.61 mg cm−2 of dry mustard material for common ragweed, common lambsquarters, bird vetch, and wild carrot, and at 17.41 mg cm−2 of dry mustard material for green foxtail and velvetleaf (P≤0.05). The percentage of red clover dormant seeds was positively related to biofumigation rates. Percentages of dormancy for all species did not fit a logistic dose–response curve. For wild carrot, common ragweed, and common lambsquarters, treatments induced dormancy for some of the rates, with curve fitting being either a logistic curve or a logistic dose–response curve with a peak.
Hormetic dose response (a stimulatory response to low levels of stress) observed in the dose–response experiment with bird vetch concurs with the results of Teasdale and Taylorson (Reference Teasdale and Taylorson1986). Germination of Texas millet [Urochloa texana (Buckley) R. Webster], large crabgrass [Digitaria sanguinalis (L.) Scop.], and sicklepod [Senna obtusifolia (L.) H. S. Irwin & Barneby] was stimulated at low concentrations of allyl-ITC (Norsworthy and Meehan Reference Norsworthy and Meehan2005a). However, in our study, hormetic responses for wild carrot, common lambsquarters, and common ragweed percentage of dormant seeds did not fit that conclusion. For these species and under the conditions of the experiment, lower rates seem to enforce dormancy or induce a secondary dormancy state instead of breaking dormancy and promoting germination. Furthermore, hormetic response of common lambsquarters was observed at a mid-rate. Perhaps the hormetic response could be triggered not only at lower rates, but by a specific concentration of inhibitory compound. Results highlight that a second mechanism of dormancy could be at issue for wild carrot, known to have a morphological type of seed dormancy (Baskin and Baskin Reference Baskin and Baskin1998a). Since this mechanism permits germination after an adequate time has passed for the embryo to mature, seeds would not return to a dormant state without other mechanisms. Based on our background research, a PD mechanism of dormancy for wild carrot has not been reported and thus requires further investigation.
Various environmental factors, including temperature, darkness, light, gases, water, and inorganic and organic chemicals can cause changes in the dormancy state of non-deep PD (Baskin and Baskin Reference Baskin and Baskin1998b). Allelochemical compounds are abundant and present in a wide variety of habitats, although so far none has been suggested to cause changes in dormancy states. Allelochemicals could inhibit germination until other environmental factors induce dormancy (Baskin and Baskin Reference Baskin and Baskin1998b) by, for example, changing the optimal temperature for seed germination or light responses of seeds (Batak et al. Reference Batak, Dević, Gibal, Grubišić, Poff and Konjević2002; Finch-Savage and Leubner-Mezger Reference Finch-Savage and Leubner-Metzger2006). The methodology used in the petri dish assays provided adequate and uniform temperature, light, and moisture conditions for seed germination after exposure to allelochemicals released by biofumigation. Therefore, this evidence suggests that the induced dormancy observed for wild carrot, common lambsquarters, and common ragweed was caused by a specific quantity of compounds generated during biofumigation, directly or indirectly.
Dose–response experiment results provided a detailed response of weed seeds to allelochemicals released by biofumigation. Various weed species responses to biofumigation or exposition to ITCs have been reported in the literature. Norsworthy and Meehan (Reference Norsworthy and Meehan2005b) observed interspecific susceptibility of weeds to biofumigation, in which emergence inhibition for Palmer amaranth (Amaranthus palmeri S. Wats.) was more pronounced than for pitted morningglory ( Ipomoea lacunosa L.) and yellow nutsedge (Cyperus esculentus L.). Germination, mortality, and dormant seed responses to biofumigation in the experimental conditions were species specific, with various types of curves and different shapes of the same type of curve also observed.
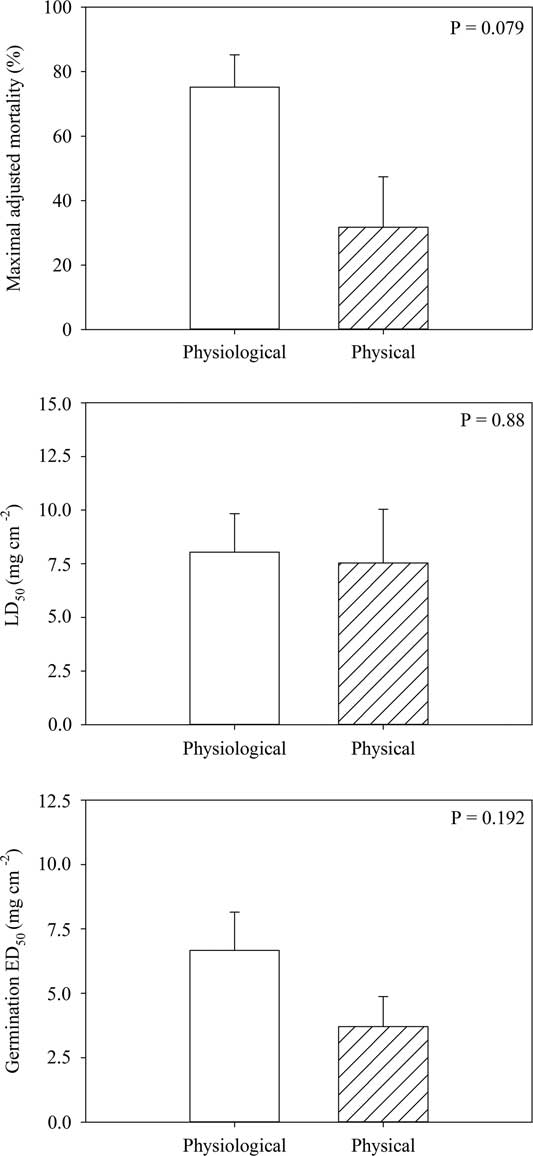
Class of seed dormancy was not a significant variable explaining LD50, ED50, or maximal mortality values (Figure 3). Maximal mortality in PD seed dormancy is slightly different from PY dormancy, but not statistically (P>0.05).
Percentages of maximal adjusted mortality, lethal doses of dry mustard biomass that kill 50% (LD50), and estimated half-maximal effective doses of dry mustard biomass that decrease germination (ED50) according to the classes of seed dormancy. Vertical bars indicate ±SE.

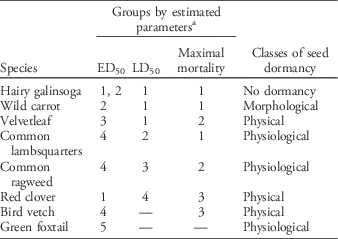
Species relative susceptibility to biofumigation according to each estimated parameter is presented in Table 3. For LD50 of viable seeds, hairy galinsoga, wild carrot, and velvetleaf (Group 1, most affected) are followed by common lambsquarters (Group 2), common ragweed (Group 3), and red clover (Group 4, least affected). Bird vetch and green foxtail confidence limits overlapped every group. For maximal mortality, hairy galinsoga, wild carrot, and common lambsquarters (Group 1) are followed by common ragweed and velvetleaf (Group 2), and then by bird vetch and red clover (Group 3). Once more, green foxtail confidence limits overlapped other groups. For ED50, red clover (Group 1) and hairy galinsoga (Groups 1 and 2) are followed by wild carrot (Group 2), velvetleaf (Group 3), common lambsquarters, common ragweed, and bird vetch (Group 4), and finally, green foxtail (Group 5). Hairy galinsoga and wild carrot were constantly in the most susceptible groups. Groups do not appear to be related to seed dormancy classes per this criterion.
Groups of relative susceptibility of weed species to biofumigation according to germination and mortality responses.

a Each number represents a susceptibility to biofumigation group ranging from 1 (highly susceptible) to 5 (slightly affected). Species with the same number for each parameter are similar per overlapping of the confidence limits (95%). A dash (—) indicates that confidence limits overlap other groups; classification of the species by the estimated parameters not possible per this criterion.
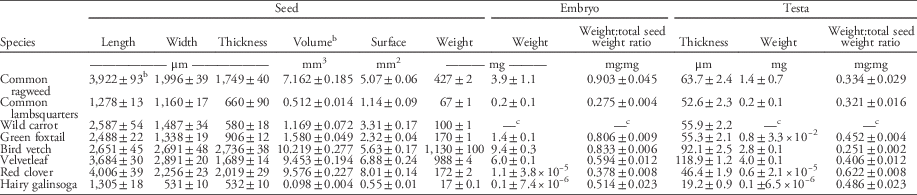
Seed Morphological Parameters and Relations with Seed Responses. Hairy galinsoga and common lambsquarters had the smallest seeds regarding length, width, volume, and weight (Table 4). Embryo weight:seed weight and testa weight:seed weight ratios represent the proportion of the embryo or the testa, respectively, in the seed. For the embryo weight:seed weight ratio, a value close to 1 indicates that the embryo within the seed is large compared with the covering structure. For testa weight:seed weight ratio, a value close to 1 indicates that the testa is heavier than other structures, including the embryo. Seed parameter measurements indicated that common ragweed had the highest embryo:seed weight ratio (0.903 mg:1 mg) while bird vetch had the lowest testa weight:seed weight ratio (0.251 mg:1 mg).
Seed morphological parameters of weed species.Footnote a

a Means ±SE.
b Volume=(4π(width)/2(length)/2(thickness)/2)/3, except for hairy galinsoga, where volume=(1/3π((width)/2)2(length).
c Separation of the embryo and testa were not feasible for wild carrot seeds.
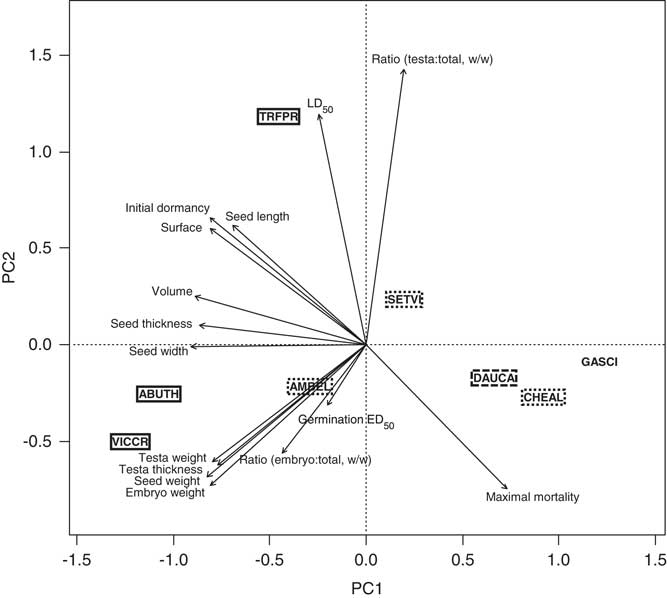
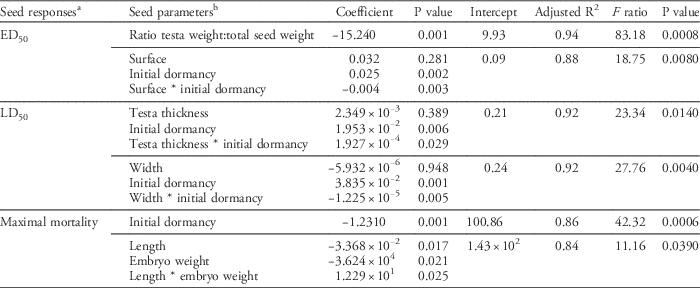
All measured and calculated seed physical parameters were analyzed by PCA in relation to initial dormancy, germination, and survival responses. The two axes shown in Figure 4 explained 73.1% of the variation. Wild carrot, common lambsquarters, and hairy galinsoga were grouped together, as were bird vetch and velvetleaf. Testa weight and thickness, seed weight, and embryo weight were correlated seed parameters. The analysis revealed that ED50 was negatively correlated with testa weight:seed weight ratio. Linear regression analyses confirmed PCA results (Table 5). For a similar seed weight, ED50 was greater in dicotyledonous seeds with a lighter testa than seeds with a heavier testa. Therefore, the proportion of testa in seed weight could reflect seed germination vulnerability. The rest of the seed components, mainly embryo and endosperm, are the core of the germination process. Those seed components could act as potential sites for allelochemical detoxification (Bailly Reference Bailly2004). Seed morphology or other factors, such as biochemistry and detoxification potential, could be more related to seed emergence from allelopathic stress than seed size (Waddington Reference Waddington1978; Weir et al. Reference Weir, Park and Vivanco2004). Moreover, initial dormancy of the seed lots and seed surface were related to ED50 values for all species (Table 5). Seed surface alone did not explain the response. There was a significant interaction between seed surface and initial dormancy. In seed lots with small seeds (up to 4 mm2), initial dormancy was positively related to ED50 values. However, in seed lots in which seed surface was more than 4 mm2, initial dormancy was negatively related to ED50 values.
Principal component analysis of seed parameters and seed responses. Species in bold boxes have physical dormancy, species in dotted boxes have physiological dormancy, species in dashed boxes have morphological dormancy, and species without a box are nondormant. The axes explain 73.1% of the variation. PCA performed with ‘vegan’ library. Species are scaled proportional to eigenvalues. Scaling preserves correlation between variables. General scaling constant of scores is 3.25. Abbreviations: ABUTH, velvetleaf; AMBEL, common ragweed; CHEAL, common lambsquarters; DAUCA, wild carrot; ED50, half-maximal effective doses of dry mustard biomass that decrease germination; GASCI, hairy galinsoga; LD50, lethal doses of dry mustard biomass that kill 50%; SETVI, green foxtail; TRFPR, red clover; VICCR, bird vetch.

Linear regression analyses of seed parameters, initial dormancy of seed lots, and seed responses from the dose–response experiment.

a ED50, half maximal effective doses of dry mustard biomass that decrease germination; LD50, lethal doses of dry mustard biomass that kill 50%.
b Analysis on dicotyledonous species only for analysis of ED50 and ratio testa weight:total seed weight and the analysis LD50 according to testa thickness and initial dormancy.
The relations established between ED50, seed parameters, and seed dormancy could help to explain variable results reported in the literature. Small seeds are often mentioned as more susceptible to allelopathy (Petersen et al. Reference Petersen, Belz, Walker and Hurle2001; Westoby et al. Reference Westoby, Leishman and Lord1996), but this is not always confirmed (Haramoto and Gallandt Reference Haramoto and Gallandt2005; Mattner et al. Reference Mattner, Porter, Gounder, Shanks, Wren and Allen2008). Al-Khatib et al. (Reference Al-Khatib, Libbey and Boydston1997) suspected that seed size was negatively correlated with weed suppression following mustard incorporation in greenhouse experiments. Nevertheless, seed size was not significantly correlated with reduction of weed emergence following incorporated residues of short-season cover crops, including Brassica (Haramoto and Gallandt Reference Haramoto and Gallandt2005).
PCA did not show a clear relation between LD50 and physical parameters. However, the regression analysis presented in Table 5 showed the initial dormancy in the seed lots is positively related to LD50. There was a significant interaction between testa thickness and initial dormancy for dicotyledonous species and a significant interaction between seed width and initial dormancy for all assessed species. Proportion of dormant seeds was a more important factor related to LD50 values in small seeds and seeds with thin testa (width less than 2,000 μm, and testa thickness less than 60 μm) than in big seeds and seeds with thick testa.
Correlation underlined by PCA between maximal mortality reached in treatments and initial dormancy in seed lots was confirmed (Table 5). For all species, initial dormancy was negatively related to maximal mortality caused by biofumigation treatments. Maximal mortality could also be explained by seed length and embryo weight (Table 5). Exposure to dry mustard biomass allowed the highest mortality in small seeds with light embryos (seed length less than 2,000 μm, and embryo weight less than 0.001 g) or in large seeds with big embryos (seed length more than 3,500 μm, and embryo weight more than 0.003 g). Embryo weight:seed weight ratio was not correlated to maximal mortality observed under treatment. Instead, the embryo weight:seed length ratio would become more relevant to predict maximal mortality. All other relations not presented between seed responses and seed parameters were not significant (P>0.05).
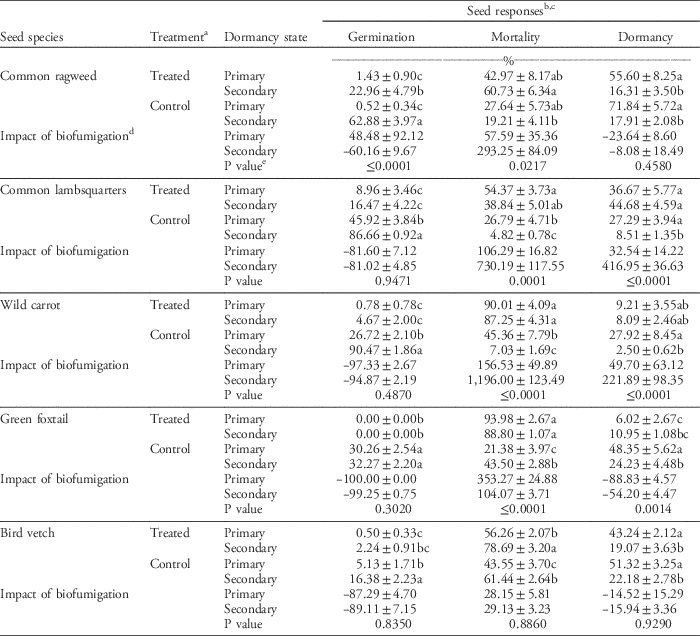
Intraspecific Dormancy Experiment. Generally, intraspecific seed dormancy status influenced seed responses observed in the experiment. However, the relative impact of biofumigation between dormancy states is not always significantly different from the control (Table 6). For common ragweed, almost no seed in primary dormancy germinated compared with 62.9% of natural germination for seeds in the secondary dormancy state. Consequently, biofumigation had greater impact on seeds with secondary dormancy than seeds with primary dormancy (P≤0.001). Biofumigation at 5.81 mg cm−2 of dried mustard powder increased mortality of common ragweed seeds in secondary dormancy state by 293% and primary dormancy state by 58%. The proportion of dormant seeds was reduced by biofumigation, but the HSD test failed to find statistical difference between dormancy states. Impact of biofumigation on both states of dormancy was not different for this species (P=0.458).
Intraspecific responses to exposition of Indian mustard tissues according to dormancy state and relative impact of biofumigation.

a Treated weed seeds were exposed to 5.81 mg cm−2 of Indian mustard tissues, except for green foxtail and bird vetch, for which the amount of mustard biomass was 17.41 and 11.61 mg cm−2, respectively.
b Means±SE.
c Means within a column followed by the same letter within weed species are not significantly different according to Tukey-Kramer HSD test at P≤0.05. Data of germination of common ragweed and bird vetch, of mortality of common ragweed, common lambsquarters, and bird vetch, and of dormancy of common lambsquarters and wild carrot are presented with mean separation on the basis of log-transformed data.
d Impact of biofumigation=((RT − RC) / RC)×100, with RT corresponding to the percent response value observed in the treatment and RC to the mean percent response value observed in the corresponding control.
e P value according to ANOVAs, where relative impact of primary or secondary dormant seeds are compared.
For common lambsquarters, biofumigation treatments reduced germination for both primary and secondary seed dormancy by 81% (P=0.947). Nevertheless, biofumigation increased mortality more in seeds in the secondary dormancy state than seeds in the primary dormancy state. Biofumigation increased the proportion of dormant seeds for common lambsquarters after-ripened seeds by 417%. Induction of dormancy was also measured in the dose–response experiment under the exposition of 5.81 mg cm−2 of dry tissues of Indian mustard.
For wild carrot, germination was highly reduced to a similar extent in both primary and secondary seed dormancy (95% and 97%, respectively). As with common ragweed and common lambsquarters seeds, biofumigation killed more wild carrot seeds exhibiting secondary than primary dormancy (1,196% and 156%, respectively). The amount of seeds in primary and secondary dormancy increased by 50% and 222%, respectively. The dose–response experiment results underlined an induced dormancy state at a low biofumigation level.
For green foxtail, germination was completely prevented by biofumigation for both dormancy states. In contrast to the previously discussed species, green foxtail seeds in primary dormancy were the most susceptible to biofumigation. Mortality of seeds in primary and secondary dormancy increased by 353% and 104%, respectively. The proportion of dormant seeds in primary and secondary dormancy states decreased by 89% and 54%, respectively. Referring to the second regression analysis of LD50 in Table 5, estimates of LD50 for a species with seed width of 1,338 mm are 1.06 and 0.53 mg cm−2 of dried mustard powder for initial dormancy of 48.4% and 24.2%, respectively. According to this estimation, mortality of seeds that have entered secondary dormancy was expected to be higher than for seeds in a primary dormancy state. However, those relations did not account for other parameters in the equation of dose response to biofumigation, such as the slope. If indeed the initial proportion of dormancy changes LD50 value and slope parameter in response to biofumigation, it would be possible that the response to a specific rate in a regression with a high inflection point and smooth slope would be lower than a response to the same rate, but on a regression with a lower inflection point with a steeper slope.
For bird vetch, the germination, survival, and proportion of dormant seeds decreased under biofumigation, and the seeds were no less susceptible in the primary dormancy state. This last assumption about possible changes in the slope of dose response holds. However, the estimated LD50 values, according to second regression analysis in Table 4 for a species with seed width of 2,691 mm, were 0.27 and 0.11 mg cm−2 of dried mustard powder for initial dormancy of 51.32% and 22.18%, respectively. The significant interaction between explanatory variables would possibly explain the fact that the initial dormancy did not influence seed response. Another explanation for green foxtail and bird vetch responses would be that the seed lots came from the same species but several individuals, leading to possible variability. Further dose–response assays with the same individuals with different proportions of dormant seeds would be required to test those assumptions.
Allelopathy is recognized to play an important role for pest management in agroecosystems, particularly in organic or low-input agriculture (Jabran et al. Reference Jabran, Mahajan, Sardana and Chauhan2015). In many agronomic practices, allelopathy is a defining factor leading to lower weed pressure (Gallandt et al. Reference Gallandt, Liebman and Huggins1999; Qasem Reference Qasem2010, Reference Qasem2013). Agronomic practices can influence seed dormancy (Dyer Reference Dyer1995), and the present study showed that allelochemicals released during the biofumigation technique are no exception. The experiments described in this paper demonstrate the herbicidal activity of ITCs released in Brassica tissues, specifically by reducing the viability of dormant and nondormant seeds. Inherent seed dormancy and characteristics are related to seed responses to biofumigation and provide a better understanding of inter- and intraspecific response to biofumigation. Those relations could help to anticipate seed susceptibility to this technique. Biofumigation may well be used to control specific vulnerable species, such as hairy galinsoga, which has small seeds and no dormancy (Kumar et al. Reference Kumar, Brainard and Bellinder2009).
Selected rates in the experiments, expressing 3% to 30% of the ITC release efficiency rate in the field, showed a significant impact of biofumigation on seed germination and survival. Consequently, biofumigation realized in good conditions (10% of ITC conversion efficiency with similar GSL content) in a field could alter the seedbank of vulnerable species (Bangarwa et al. Reference Bangarwa, Norsworthy, Mattice and Gbur2011). However, to confirm this assumption, investigation under natural conditions where other factors are involved should be carried out. In situ factors, including soil colloidal adsorption and possible microbial transformation of allelochemicals, may affect the activity of biofumigants (Price et al. Reference Price, Charron, Saxton and Sams2005). Seedbank persistence is one of the major processes involved in annual weed dynamics, and seed mortality has a strong impact on future weed population size (Gallandt et al. Reference Gallandt, Liebman and Huggins1999).
To improve the impact of ITCs on the soil seedbank, it will be necessary to use the results of studies regarding weed biology. Seed characteristics and annual dormancy cycles should be considered before biofumigation in fields to improve weed control. For example, common ragweed, a summer annual species, has seeds with PD, wherein the seeds are dormant in the fall and nondormant in the summer, with winter supplying after-ripening conditions (Baskin and Baskin Reference Baskin and Baskin1980). To control this weed, it would not be wise to perform biofumigation in fall, when the seeds are more tolerant, according to our conclusions. Growers should wait to perform biofumigation in late spring, when common ragweed seeds are nondormant and thus more vulnerable.
In addition to weed-specific biological information, the biofumigation technique itself requires some considerations to improve efficiency. Biofumigation mode of action is the release of large quantities of ITCs onto target species (Morra and Kirkegaard Reference Morra and Kirkegaard2002). However, production of secondary metabolites such as GSLs is known to be influenced by the environment, such as the presence of other species or seasonal variation (Brown and Morra Reference Brown and Morra1997; Inderjit et al. Reference Inderjit, Wardle, Karban and Callaway2011). GSL content in plants is highly correlated to sulfur availability in soils (Ciska et al. Reference Ciska, Martyniak-Przybyszewska and Kozlowska2000; Falk et al. Reference Falk, Tokuhisa and Gershenzon2007). To be successful in the field, plants must be finely chopped and incorporated at full flowering stage, when the GSL concentrations are at the highest (Taylor et al. Reference Taylor, Kenyon, Giela, Keenan and Rosser2014). Adequate soil moisture is required to allow the chemical reaction, and the soil temperature must be at least 10 C (Matthiessen et al. Reference Matthiessen, Warton and Shackleton2004; Michel Reference Michel2008). More importantly, the time to reach flowering stage by Brassica cover crops is nonnegligible. This delay could prevent growers from performing biofumigation at the appropriate time to control a specific weed species. However, whenever this technique could be included in crop rotation systems, the use of Brassica cover crops in organic cropping systems could provide increased weed management options and facilitate weed seedbank depletion.
Acknowledgments
The authors would like to thank Laurence Jochems-Tanguay and Patrick Dubé for their technical assistance and the many summer students who worked on this project. This research was funded by the Agriculture and Agri-Food Canada’s Canadian Agricultural Adaptation Program managed by the Conseil pour le Développement de l’Agriculture du Québec. This study was carried out in partial fulfillment of the requirements for a Ph.D degree at McGill University.