Implications
This study aimed to investigate the accuracy of gene transcript quantification in blood (interferon stimulated genes (ISG)) as a method of early pregnancy diagnosis in sheep. This method of pregnancy detection is based on a single blood sample, whereas routine pregnancy diagnosis, namely ultrasonography, requires specific equipment and a skilled operator. Our results show a higher variability in ISG expression patterns in animals from commercial herds than from a controlled research station. Consequently, this prevents the discrimination between pregnant and non-pregnant farm animals and therefore, the setting of a suitable cut-off for pregnancy detection. This study highlights the limits of ISG-based pregnancy tests in sheep.
Introduction
Reproductive performance is closely linked to farm profitability, as extended periods with high numbers of non-pregnant animals are associated with unproductive periods. Over the past few decades, in the dairy industry, intense genetic selection on production traits has resulted in a continuous decline in reproductive performance affecting all stages of the reproductive process (Lucy, Reference Lucy2001), including fertilization failure and embryonic mortality (Diskin and Morris, Reference Diskin and Morris2008). As major embryo loss occurs after fertilization and before placentation, the early identification of non-pregnant animals, would allow producers to identify, and eventually synchronize and re-inseminate these animals before the next return to oestrous, and this would result in the shortening of the interbreeding interval and thus, increase productive periods.
In practice, early pregnancy diagnosis is currently performed using ultrasonography. Pregnancy can be accurately diagnosed from day 29 in cattle (Stevenson et al., Reference Stevenson, Cartmill, Hensley and El-Zarkouny2003) and from day 20 in sheep (Romano and Christians, Reference Romano and Christians2008). However, ultrasonography requires the use of appropriate equipment by a skilled operator. Chemical methods for pregnancy diagnosis, such as blood assessment of pregnancy-specific protein B (PSP-B), have been developed, and display similar accuracy as transrectal ultrasonography in cattle (Romano and Larson, Reference Romano and Larson2010). However, both transrectal ultrasonography and PSP-B tests are performed and accurate only after day 28, namely after the expected time of return to oestrous.
In order to shorten interbreeding intervals, controlled reproductive management programs that include oestrus synchronization and timed artificial insemination (AI) have been proposed (Colazo and Mapletoft, Reference Colazo and Mapletoft2014). The effectiveness of such programs relies on a reliable detection test for pregnancy on or about the time of pregnancy recognition signalling in various species, namely 13 to 14 days of pregnancy in ewes and 14 to 16 days of pregnancy in cattle. During pregnancy establishment in ruminants, conceptus trophectoderm has been shown to release interferon tau (IFNT), a major signal for maternal recognition. IFNT, a type I IFN, modulates the expression of a variety of endometrial genes including the up-regulation of ISG, a phenomenon that has been abundantly described (reviewed in Spencer et al., Reference Spencer, Sandra and Wolf2008). Interestingly, up-regulation of ISG was identified not only in the uterus, but also in the corpus luteum and in circulating immune cells (Ott and Gifford, Reference Ott and Gifford2010) after a short delay following fertilization, before or around implantation. Some of these genes for example Myxovirus (influenza virus) resistance 1 (MX1), Myxovirus (influenza virus) resistance 2 (MX2) and ISG15 have been identified in cattle (Gifford et al., Reference Gifford, Racicot, Clark, Austin, Hansen, Lucy, Davies and Ott2007) and in sheep (Yankey et al., Reference Yankey, Hicks, Carnahan, Assiri, Sinor, Kodali, Stellflug and Ott2001; Oliveira et al., Reference Oliveira, Henkes, Ashley, Purcell, Smirnova, Veeramachaneni, Anthony and Hansen2008) and have been tested as early pregnancy diagnosis markers, but have shown variable effectiveness. A day 18 evaluation of ISG15 messenger RNA (mRNA) yields in dairy cows revealed poor accuracy in pregnancy detection although accuracy was enhanced with serial blood collection from day 17 to day 25 (Han et al., Reference Han, Austin, Rempel and Hansen2006). The use of fold changes in steady-state levels of MX2 mRNA from day 0 to day 18 after AI was deemed an unreliable method of pregnancy diagnosis in dairy heifers because of low sensitivity and negative predictive value (Stevenson et al., Reference Stevenson, Dalton, Ott, Racicot and Chebel2007). 2'-5'-oligoadenylate synthetase 1 (OAS1) has been found to be a suitable pregnancy test on day 18 after AI in heifers but not in cows (Green et al., Reference Green, Okamura, Poock and Lucy2010a). OAS1 mRNA levels have also been successfully assessed for pregnancy diagnosis in a re-synchronization programme for fixed time insemination in dairy heifers (Green et al., Reference Green, Okamura, Mathew, Newsom and Lucy2010b). More recently, the combination of ISG transcript expression (OAS1, MX2) and doppler imaging of the corpus luteum on day 20 post AI was used to identify non-pregnant cows in reproductive programmes (Pugliesi et al., Reference Pugliesi, Miagawa, Paiva, França, Silva and Binelli2014). In sheep, MX1, MX2 (Yankey et al., Reference Yankey, Hicks, Carnahan, Assiri, Sinor, Kodali, Stellflug and Ott2001) and ISG15 (Oliveira et al., Reference Oliveira, Henkes, Ashley, Purcell, Smirnova, Veeramachaneni, Anthony and Hansen2008) have also been shown to be up-regulated in blood samples during early pregnancy. However, although ISG-based pregnancy tests have been carried out in cattle, and especially in dairy cattle, none have been reported in sheep yet.
The purpose of the present study is to investigate if a set of five ISG, three well-established genes (ISG15, MX1, MX2) and two novel genes (Chemokine (C-X-C motif) ligand 10 (CXCL10) and Signal transducer and activator of transcription 1 (STAT1)), can be used as a reliable early pregnancy diagnosis test in sheep, using blood samples collected under farm conditions.
Material and methods
The experiments were performed at the INRA experimental station of Jouy-en-Josas (Leudeville, France; experiment 1) and at the Alfort Veterinary School (Ecole Nationale Vétérinaire d’Alfort, Maisons-Alfort, France; experiment 2) in accordance with the Guide for Care and Use of Agriculture Animals.
Animal preparation and blood sample processing
Experiment 1
In total, 29 Pré-Alpes du Sud multiparous ewes (second or third lactation), born and bred at the INRA station of Jouy-en-Josas, were oestrus-synchronized using the SYNCRO-PART® (CEVA, Libourne, France) method. A 40 mg of fluogestone sponge was inserted into the vagina and removed after a 14-day period. Ewes were subsequently given an i.m. injection of 400 IU of equine Chorionic Gonadotropin (eCG) at the time of the sponge removal in order to induce ovulation. They were randomly split into three different groups. In all, 15 ewes were AI (n=15) 48 h after sponge removal (day 0=day of insemination) with doses from the same ram. As seminal liquid has been reported to induce an inflammatory response of the endometrium, which results in an altered gene expression profile (Scott et al., Reference Scott, Ketheesan and Summers2009), nine ewes were sham inseminated (SI, n=9) with doses from the same ram, heat treated (2 h at 37°C) in order to deplete energy reserves of the spermatozoa. The five remaining ewes were left as non-inseminated cyclic controls (cyclic, n=5). Blood samples (50 ml) were collected on day 15 just before slaughter, by venipuncture of the jugular vein using citrate tubes (Buffered Na3-citrate 5 ml Venoject®; Terumo, Guyancourt, France). Peripheral blood mononuclear cells (PBMC) were immediately isolated using a Percoll gradient method, frozen and stored at −80°C in TRIzol® Reagent (Invitrogen, Cergy-Pontoise, France) until RNA extraction. Animals were slaughtered on day 15 of the oestrus cycle or pregnancy. Uteri were collected and flushed with phosphate-buffered saline (PBS) and pregnancy was confirmed by the presence of conceptuses. In the AI group, eight animals were pregnant on day 15 (Pregnant, n=8) and seven were non-pregnant (AINP, n=7).
Experiment 2
Cross-bred multiparous ewes (n=37) bought from several herds and reared at the veterinary school were oestrus-synchronized as described previously, then mated with two fertile rams 48 h after the sponge removal (day 0=day of mating). Blood samples were collected on day 14 of pregnancy by venipuncture of the jugular vein (5 ml) into two PAXgene® Blood RNA Tubes (PreAnalytix, Hombrechtikon, Switzerland). All samples were maintained at room temperature for 2 h, frozen and stored at −20°C until RNA extraction according to the manufacturer’s recommendations. Transabdominal ultrasonography was performed for pregnancy diagnosis on days 35 and 42. In total, 21 ewes were pregnant (Pregnant, n=21) and 16 were non-pregnant (Non-pregnant, n=16).
RNA extraction and complementary DNA synthesis
After thawing, PBMC (experiment 1) were homogenized in TRIzol® Solution using a 18 G needle and a 2 ml syringe (Terumo, Guyancourt, France). Total RNA were extracted using TRIzol® Reagent according to the manufacturer’s recommendations and the RNA samples were purified using the RNeasy Mini Kit® (Qiagen, Courtabeuf, France) according to the manufacturer’s protocol. Total RNA isolation from peripheral blood leucocytes collected with PAXgene® Blood RNA kit (PreAnalytix; experiment 2) was performed using the PAXgene® Blood RNA system (PreAnalytix) according to the manufacturer’s directions.
All RNA samples were treated with 1 μl of DNase I (Qiagen). They were quantified by spectrophotometry (Nanodrop® 3300, Labtech, Wilmington, DE, USA), and their quality and integrity were determined by Agilent® 2100 bio analyzer (Agilent, Massy, France). RNA integrity number of all RNA samples was over 7. For each sample, complementary DNA (cDNA) was synthesized from 1 μg of total RNA using SuperScript II® Reverse Transcriptase (Invitrogen) and Oligo dT® primer (Invitrogen) according to the manufacturer’s instructions. For each sample, two retrotranscriptions were performed and pooled. Then, cDNA were diluted in DNase free water and stored at −80°C until further processing.
Quantitative real-time PCR
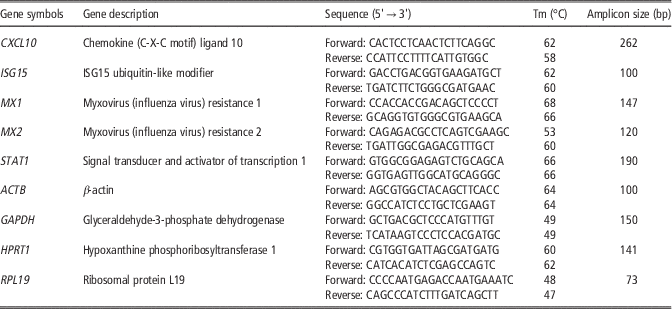
Purified DNA-free total RNA of all samples from experiment 1 (Pregnant, Non-pregnant, Cyclic) and experiment 2 (Pregnant, Non-pregnant) were used for the real-time quantative PCR (RT-qPCR). In order to amplify ovine genes of interest (CXCL10, ISG15, MX1, MX2, STAT1) and housekeeping genes (β-actin (ACTB), Glyceraldehyde-3-phosphate dehydrogenase (GAPDH), Hypoxanthine phosphoribosyltransferase 1 (HPRT1), Ribosomal protein L19 (RPL19)), primers were designed using Primer Express® (Primer Express software v2.0, Applied Biosystems, Carlsbad, CA, USA) and Custom Primers – OligoPerfect®Designer (LifeTechnologies; http://tools.lifetechnologies.com/content.cfm?pageid=9716) (Table 1). Primers were synthesized by Eurogentec (Liège, Belgium). Real-time PCR was then performed as previously described (Carvalho et al., 2016) with the Master Mix SYBR Green® (Applied Biosystem) and the StepOnePlus® sequence detection system (Applied Biosystem). All amplified PCR fragments were sequenced (Beckman Coulter Genomics, Tackeley, UK) in order to confirm the identity of the amplicon. According to the relative standard curve method, the relative quantification of the amount of mRNA of the selected genes was calculated against a normalization factor generated by the qBasePLUS® software (Biogazelle, Zwijnaarde, Belgium) from the three housekeeping genes GAPDH, RPL19 and ACTB.
Gene symbol, gene description, primer sequences, melting temperatures (Tm) and amplicon size (pair of bases) for all genes used in real-time quantitative PCR

Statistical analyses
Relative expression analysis
Normalized PCR data of cyclic, non-pregnant and pregnant ewes (experiment 1) were processed using the Kruskal–Wallis method with single-step family-wise error rate (FWER) post-test (R© application v3.0.1). Mann–Whitney test (GraphPad Prism version 6.00 for Windows, GraphPad Software, La Jolla, CA, USA, www.graphpad.com) was used to compare ISG expression in pregnant and non-pregnant animals (experiments 1 and 2).
Receiver operating characteristic curve and diagnostic calculation
A receiver operating characteristic (ROC) curve was then generated to examine the diagnostic value of CXCL10, MX1, MX2, STAT1 and ISG15 mRNA levels as pregnancy markers. The threshold was set as the maximum value of the Youden index (Greiner et al., Reference Greiner, Pfeiffer and Smith2000). The area under the curve (AUC) evaluates the discriminatory power of the diagnostic tests (Greiner et al., Reference Greiner, Pfeiffer and Smith2000). The diagnostic values were generated as follows. True positives (TP) were animals classified as positive by the evaluated test and confirmed by the reference test; true negatives (TN) were animals correctly identified as negative by the test and confirmed by the reference test; false positives (FP) were animals classified as positive by the test, whereas they were identified as negative by the reference test; and false negatives (FN) were animals classified as negative by the test but as positive with the reference test. The reference test was the observation of embryos recovered in uterine flushes (experiment 1) or pregnancy detection by transabdominal ultrasonography on days 35 and 42 post-mating (experiment 2). Based upon these associations, we calculated the sensitivity (Se=TP/(TP+FN)×100), the specificity (Sp=TN/(TN+FP)×100), the positive predictive value (PPV=TP/(TP+FP)×100) and the negative predictive value (NPV=TN/(TN+FN)×100) of the different tests.
Hierarchical classification
In order to cluster animals according to the expression pattern of the selected candidate genes, hierarchical classification of the real-time PCR data was performed using Ward’s method and Euclidean distance as metric.
Results
Experiment 1
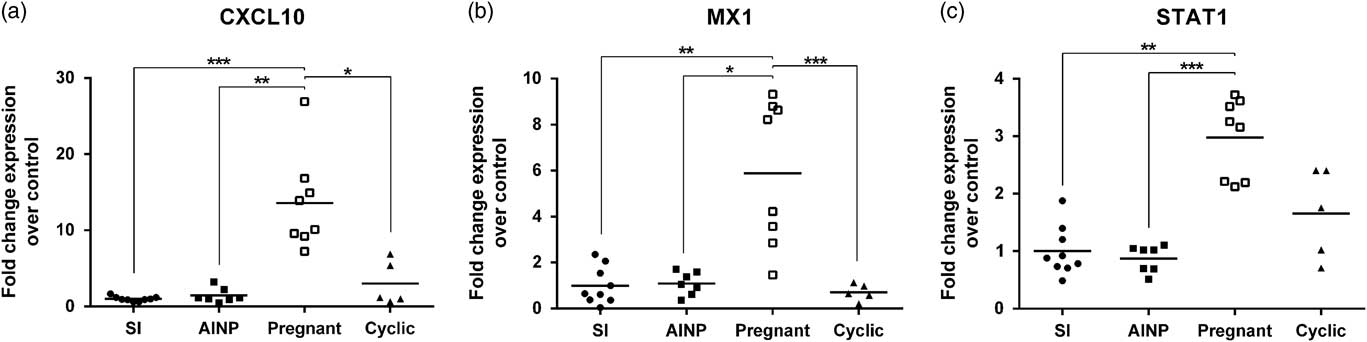
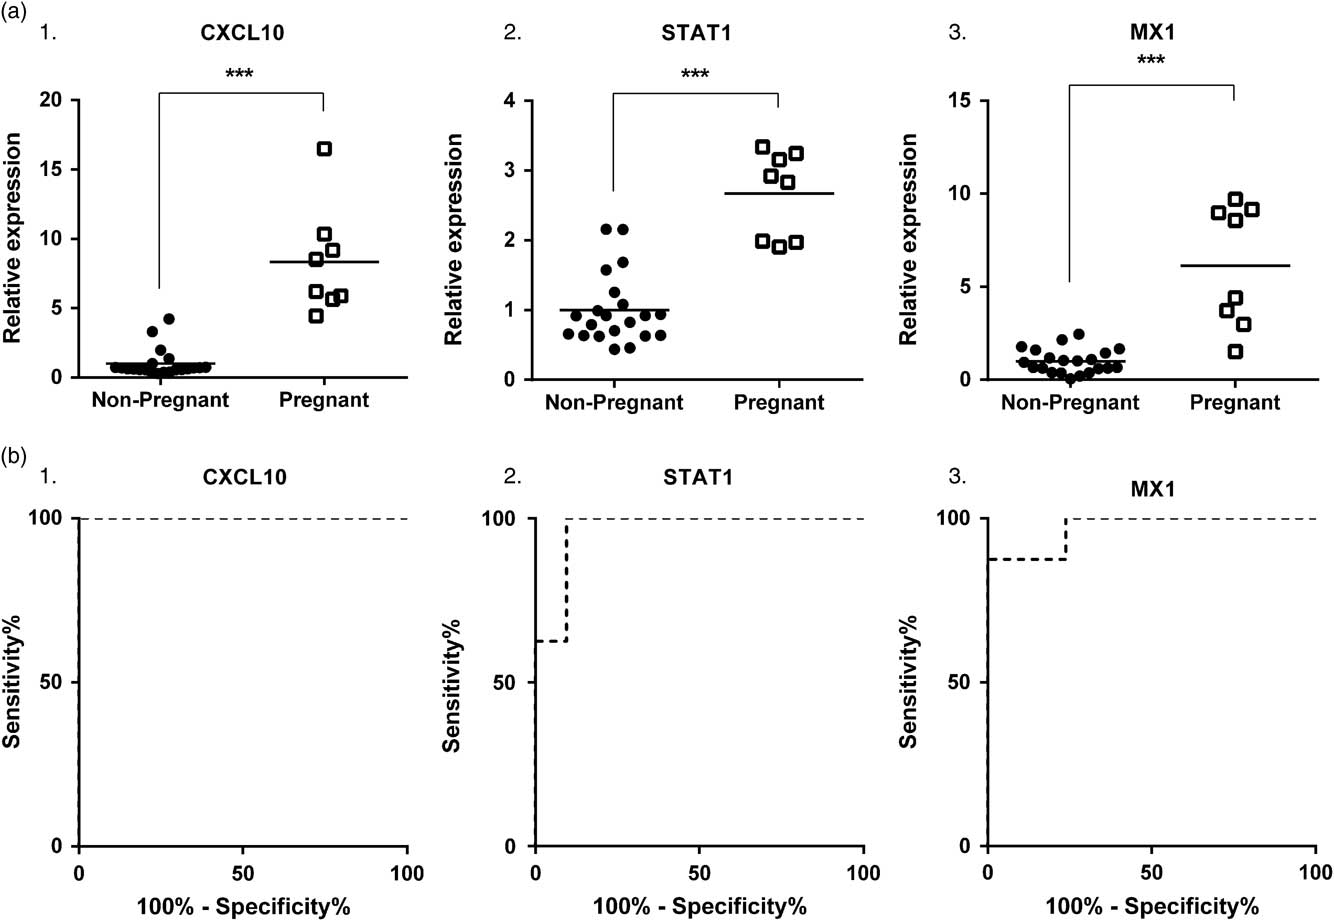
No significant difference (P>0.10) was found in CXCL10, MX1 and STAT1 mRNA levels between SI, inseminated non-pregnant (AINP) and cyclic animals (Figure 1); so these three groups were merged into one group (Non-pregnant, n=21) for further investigation. Gene expression for CXCL10, MX1 and STAT1 mRNA were respectively 8.3-fold, 6.1-fold and 2.7-fold higher (P<0.001) in pregnant compared with non-pregnant ewes (Figure 2a). Individual expression value analysis revealed that 100% and 90% of non-pregnant ewes had lower mRNA abundance of CXCL10 and STAT1 respectively compared with pregnant ewes.
Real-time quantitative PCR results for experiment 1: relative expression of Chemokine (C-X-C motif) ligand 10 (CXCL10) (a), Myxovirus (influenza virus) resistance 1 (MX1) (b) and Signal transducer and activator of transcription 1 (STAT1) (c) in sham inseminated (SI), artificially inseminated non-pregnant (AINP), pregnant and cyclic ewes, 15 days after oestrous. Control refers to SI group. *P<0.5, **P<0.01, ***P<0.001.

Real-time quantitative PCR results for experiment 1: (a) relative expression and (b) receiver operating characteristic (ROC) curves for Chemokine (C-X-C motif) ligand 10 (CXCL10) (1), Myxovirus (influenza virus) resistance 1 (MX1) (2) and Signal transducer and activator of transcription 1 (STAT1) (3) in pregnant and non-pregnant ewes, 15 days after oestrous. (a) Symbols stand for individual values (solid symbols for non-pregnant and open symbols for pregnant animals) and solid lines for the mean of the group. (b) The ROC curve is a graphical representation of the sensitivity and the specificity of a diagnostic test when an increasing threshold is applied. ***P<0.001.
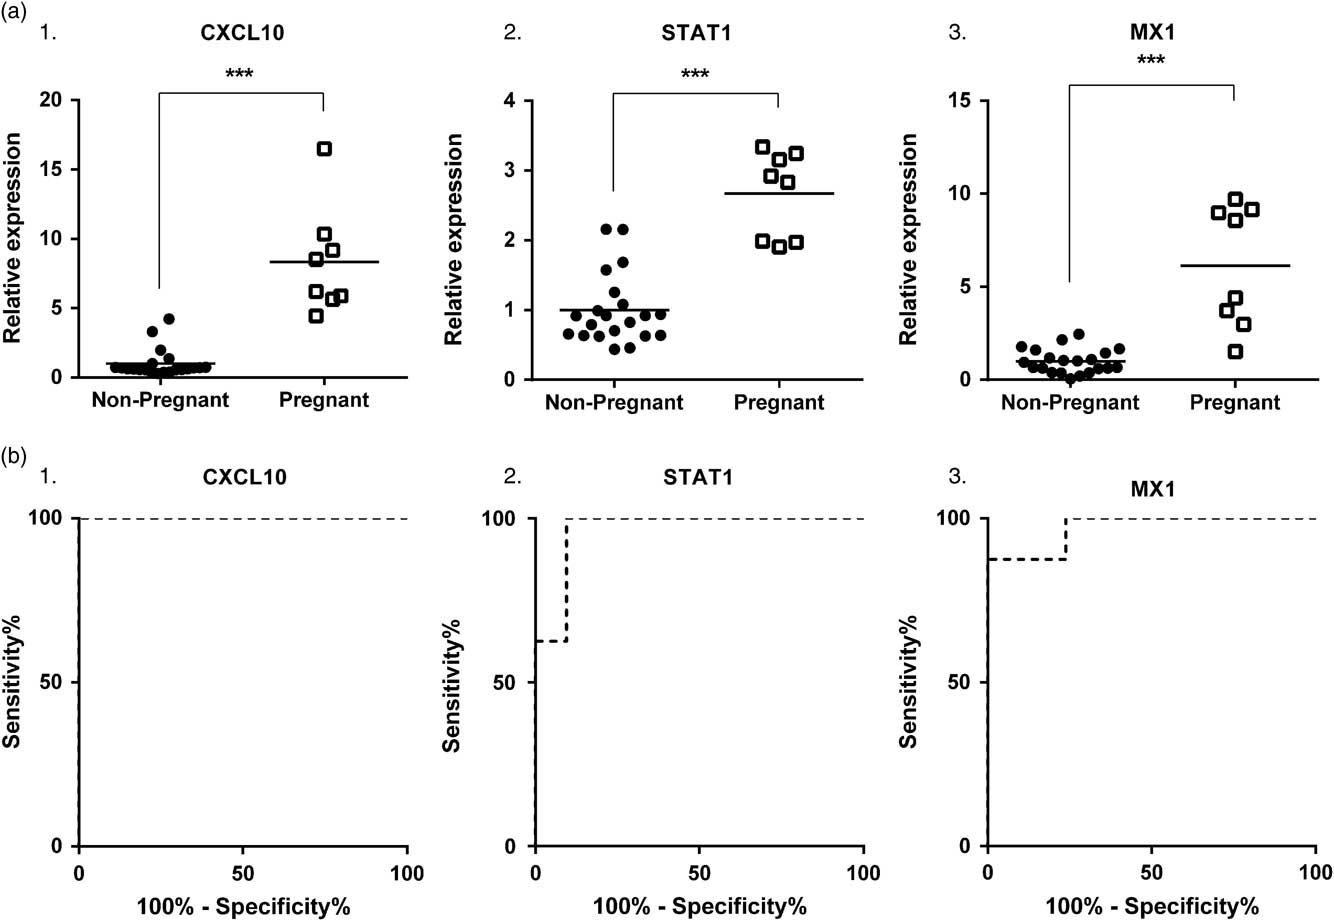
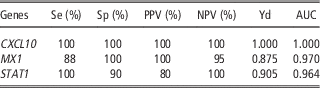
The ROC curve was fully (CXCL10) and highly (MX1, STAT1) deflected to the left (Figure 2b) and AUC were all over 0.95 (Table 2) demonstrating that a reliable cut-off could be established. The diagnosis reliability using CXCL10, MX1 and STAT1 mRNA levels for pregnancy detection is summarized in Table 2. In this experiment, CXCL10 and STAT1 appeared to be very accurate and effective in identifying non-pregnant animals.
Sensitivity (Se), specificity (Sp), positive predictive value (PPV), negative predictive value (NPV), Youden index (Yd) and area under the curve (AUC) for pregnancy diagnosis tests based on candidate interferon stimulated gene expression values (experiment 1)

CXCL10=Chemokine (C-X-C motif) ligand 10; MX1=Myxovirus (influenza virus) resistance 1; STAT1=Signal transducer and activator of transcription 1.
Experiment 2
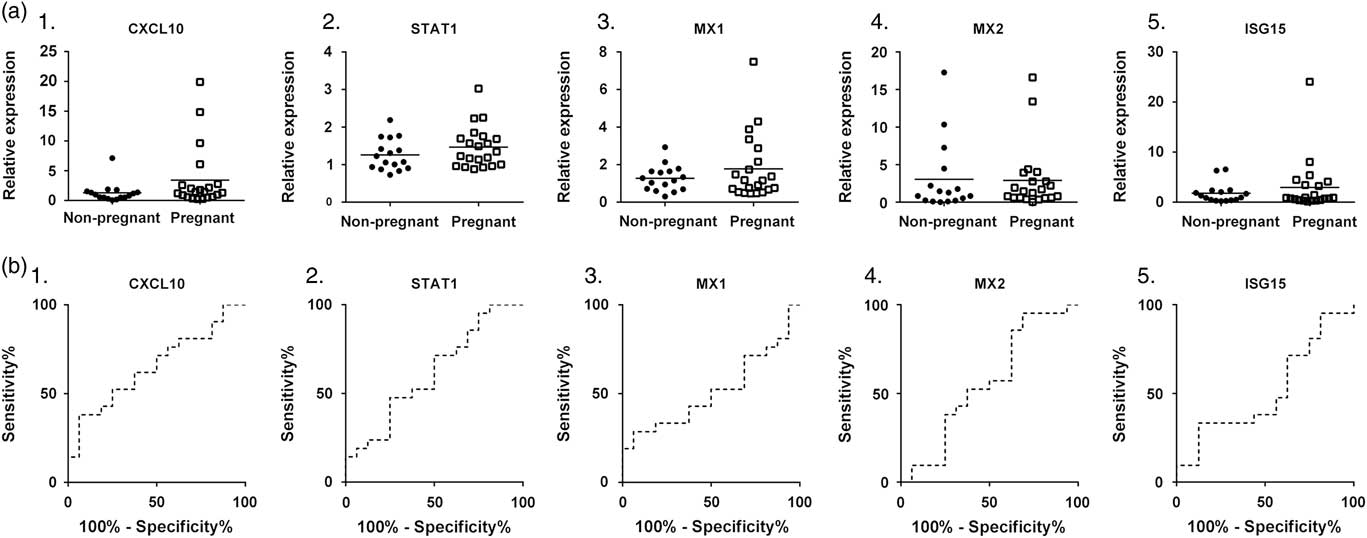
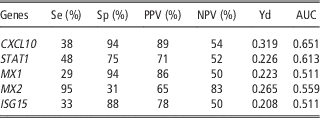
No significant differences (P>0.10) were found between pregnant and non-pregnant ewes for CXCL10, STAT1, MX1, MX2 and ISG15 mRNA levels (Figure 3a). The ROC curves for CXCL10, STAT1, MX1, MX2 and ISG15 showed no deflection to the left of the diagonal line through the centre (Figure 3b) and all AUC failed to reach 0.70 (Table 3) demonstrating that a suitable cut-off could not be established. The reliability of CXCL10, STAT1, MX1, MX2 and ISG15 for pregnancy diagnosis is summarized in Table 3.
Real-time quantitative PCR results for experiment 2: (a) relative expression and (b) receiver operating characteristic (ROC) curves for Chemokine (C-X-C motif) ligand 10 (CXCL10) (1), Myxovirus (influenza virus) resistance 1 (MX1) (2) and Signal transducer and activator of transcription 1 (STAT1) (3), Myxovirus (influenza virus) resistance 2 (MX2) (4) and ISG15 ubiquitin-like modifier (ISG15) (5) in pregnant and non-pregnant ewes, 14 days after mating. (a) Symbols stand for individual values (solid symbols for non-pregnant and open symbols for pregnant animals) and solid lines for the mean of the group. No significant difference were found between pregnant and non-pregnant animals (b) The ROC curve is a graphical representation of the sensitivity and the specificity of a diagnostic test when an increasing threshold is applied.

Sensitivity (Se), specificity (Sp), positive predictive value (PPV), negative predictive value (NPV), Youden index (Yd) and area under the curve (AUC) for pregnancy diagnosis tests based on candidate interferon stimulated gene expression values (experiment 2)

Chemokine (C-X-C motif) ligand 10 (CXCL10), Signal transducer and activator of transcription 1 (STAT1), Myxovirus (influenza virus) resistance 1 (MX1), Myxovirus (influenza virus) resistance 2 (MX2) and ISG15 ubiquitin-like modifier (ISG15).
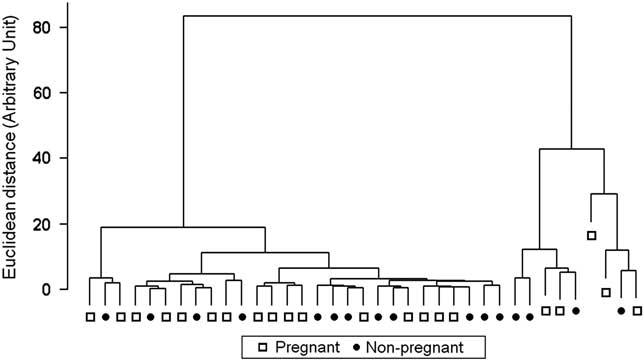
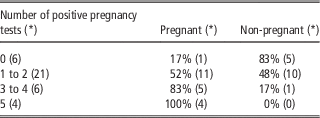
The hierarchical classification-based cluster dendrogram of all 37 blood samples is shown in Figure 4. The hierarchical classification identified five major clusters that combined pregnant and non-pregnant animals and therefore failed to discriminate between pregnant and non-pregnant ewes using the expression of the five selected genes. Table 4 illustrates the high variability in ISG expression levels: 17% of animals identified as non-pregnant by the five tests were in fact pregnant. Only 52% of pregnant animals had at least two positive results and up to five positives results were needed to avoid misclassification.
Cluster dendrogram of hierarchic classification of the 37 ewes (experiment 2, 21 pregnant ewes and 16 non-pregnant) based on the Euclidean distance (ward method) between individual messenger RNA levels of Chemokine (C-X-C motif) ligand 10 (CXCL10), Signal transducer and activator of transcription 1 (STAT1), Myxovirus (influenza virus) resistance 1 (MX1), Myxovirus (influenza virus) resistance 2 (MX2) and ISG15 ubiquitin-like modifier (ISG15). Solid symbols stand for non-pregnant animals and open symbols for pregnant animals.

Distribution of animals according to their results to the five pregnancy tests: Chemokine (C-X-C motif) ligand 10 (CXCL10), ISG15 ubiquitin-like modifier (ISG15), Myxovirus (influenza virus) resistance 1 (MX1), Myxovirus (influenza virus) resistance 2 (MX2), Signal transducer and activator of transcription 1 (STAT1) (experiment 2)

*=Number of animals.
Discussion
These experiments were conducted to evaluate the feasibility and characteristics of early pregnancy diagnosis based on ISG expression in circulating immune cells in sheep.
First, we established the effect of pregnancy on expression levels of CXCL10, STAT1 and MX1 mRNA in Percoll gradient-isolated blood cells from an experimental group of homogenous ewes born and bred under controlled conditions. Significant differences in mRNA abundance were found between pregnant and non-pregnant ewes with an up-regulation of MX1 gene expression in pregnant animals as previously described in sheep (Yankey et al., Reference Yankey, Hicks, Carnahan, Assiri, Sinor, Kodali, Stellflug and Ott2001) and cattle (Gifford et al., Reference Gifford, Racicot, Clark, Austin, Hansen, Lucy, Davies and Ott2007; Pugliesi et al., Reference Pugliesi, Miagawa, Paiva, França, Silva and Binelli2014). Furthermore, if CXCL10 and STAT1 (Gray et al., Reference Gray, Abbey, Beremand, Choi, Farmer, Adelson, Thomas, Bazer and Spencer2006) mRNA levels are known to be up-regulated by pregnancy in the ovine endometrium, we observed that they were also up-regulated in PBMCs during early pregnancy. Early pregnancy diagnosis tests based on CXCL10 and STAT1 mRNA expression on day 15 after oestrous/insemination in the present experiment gave reliable results for pregnancy detection (Se and NPV of 100%, Sp⩾90%, PPV⩾80%). This is similar to results obtained by transrectal ultrasonography on day 20 in sheep (Romano and Christians, Reference Romano and Christians2008), on day 30 in cattle (Romano et al., Reference Romano, Thompson, Forrest, Westhusin, Tomaszweski and Kraemer2006), and to PSP-B assessment on day 28 in cattle (Romano and Larson, Reference Romano and Larson2010).
As late embryonic and foetal death can occur after day 15 of pregnancy (Diskin and Morris, Reference Diskin and Morris2008), a positive diagnosis on day 15 is a poor predictor of lambing. In our first experiment, the expression of CXCL10 and STAT1 led to the identification of non-pregnant ewes on day 15, which is of great interest for farm utilization. The results, generated from our experimental animal group were encouraging but needed to be validated on animals from a commercial herds. This involves blood sampling and processing procedures that are achievable in field conditions, which is not the case for Percoll gradient method. We therefore used PAXgene® tubes in experiment 2 (farm group). This method enables mRNA transcript stabilization immediately upon collection and prevent an ex vivo change in gene expression. In experiment 1 (experimental group), Percoll-isolated immune cells were collected with ethylenediaminetetraacetic acid (EDTA) tubes that do not contain nucleic acid stabilization agents. It has been demonstrated that this type of process results in significant alteration of gene expression, especially for genes such as cytokines and ISGs (Sheridan et al., Reference Sheridan, Browne, MacHugh, Costello and Gormley2012). If the amount of extracted mRNA is higher with Percoll (Prezeau et al., Reference Prezeau, Silvy, Gabert and Picard2006), mRNA quality is better with PAXgene® (Hammerle-Fickinger et al., Reference Hammerle-Fickinger, Riedmaier, Becker, Meyer, Pfaffl and Ulbrich2010). Consequently, the PAXgene® method appears to be particularly suitable for in-field diagnosis utilization.
In the farm group, we observed no significant differences of expression for any of the five genes (CXCL10, STAT1, MX1, MX2 and ISG15) investigated between pregnant and non-pregnant animals. The differences observed in gene expression between the two experiments might be related to the blood sampling technique. Indeed, in the experimental group of animals, EDTA-collected blood was subsequently submitted to a density gradient (Percoll) whereas, in the farm group of ewes, blood samples were collected with PAXgene® tubes. In the experimental group of animals, centrifugation on Percoll gradient separated blood cell components according to their density and led to the isolation of PBMCs that include lymphocytes (B, T and natural killer (NK) cells) and monocytes. PBMC account for <65% of the whole leucocytes (Schalm and Jain, Reference Schalm and Jain1986). Conversely, the PAXgene® procedure allows the collection of all white blood cell populations, including PBMC and polymorphonuclear neutrophils (PMN). Therefore real-time PCR analyses of ISG mRNA expression were run with different populations of circulating cells. Expression of ISG (ISG15, MX1, MX2) has been already described in PBMC (Shirasuna et al., Reference Shirasuna, Matsumoto, Kobayashi, Nitta, Haneda, Matsui, Kawashima, Kida, Shimizu and Miyamoto2012; Kizaki et al., Reference Kizaki, Shichijo-Kizaki, Furusawa, Takahashi, Hosoe and Hashizume2013; Pugliesi et al., Reference Pugliesi, Miagawa, Paiva, França, Silva and Binelli2014), and in leucocytes (Yankey et al., Reference Yankey, Hicks, Carnahan, Assiri, Sinor, Kodali, Stellflug and Ott2001; Gifford et al., Reference Gifford, Racicot, Clark, Austin, Hansen, Lucy, Davies and Ott2007; Green et al., Reference Green, Okamura, Poock and Lucy2010a). Kinetics of ISG expression level during peri-implantation was shown to be similar in PBMC and PMN (Shirasuna et al., Reference Shirasuna, Matsumoto, Kobayashi, Nitta, Haneda, Matsui, Kawashima, Kida, Shimizu and Miyamoto2012). Kizaki et al. (Reference Kizaki, Shichijo-Kizaki, Furusawa, Takahashi, Hosoe and Hashizume2013) demonstrated that ISG mRNA expression during early pregnancy is higher in granulocytes (eliminated during Percoll processing) than in monocytes and lymphocytes. In keeping with these data, expression analyses run with blood samples collected with PAXgene® from primiparous dairy cows at day 19 of pregnancy unveiled significant differences for MX1, MX2 and ISG15 mRNA levels between pregnant and non-pregnant cows (Mauffré et al., unpublished data). Consequently, blood cell populations isolated with PAXgene® might be more reactive during early pregnancy and more representative of ISG expression kinetic than Percoll sorted PBMC population analyzed in experiment 1.
In experiment 2 (farm group), we had no gold standard to identify early pregnancy at day 14. Consequently, some ewes, diagnosed as non-pregnant at day 35 might have been pregnant at day 14. In small ruminants early embryonic death ranges from 11% to 30% (Diskin and Morris, Reference Diskin and Morris2008). This might account for the high ISG expression in some ewes classified as non-pregnant but this cannot explain low levels of ISG expression in pregnant females: gene expression was highly variable in this second group of animals regardless of their pregnancy status. The hierarchical classification identified five major clusters and each of them contained pregnant and non-pregnant ewes. This suggests that biological parameters other than pregnancy have a greater impact on ISG expression. Previous studies have already reported high levels of ISG mRNA in non-pregnant animals and low levels of ISG mRNA in pregnant animals, preventing the definition of a suitable cut-off for pregnancy detection (Stevenson et al., Reference Stevenson, Dalton, Ott, Racicot and Chebel2007; Green et al., Reference Green, Okamura, Poock and Lucy2010a; Pugliesi et al., Reference Pugliesi, Miagawa, Paiva, França, Silva and Binelli2014). ISG are known to be induced by conceptus-secreted IFNT, the major signal of maternal pregnancy recognition in ruminants (Spencer et al., Reference Spencer, Sandra and Wolf2008) but ISG can also be regulated by other types of IFN, particularly in various pathological contexts. Many viruses are known to circulate in farms with various types of clinical conditions. Studies have reported that ISG15, MX1, MX2 expression levels are up-regulated during viral infection in sheep (Rodrigues Hoffmann et al., Reference Rodrigues Hoffmann, Dorniak, Filant, Dunlap, Bazer, de la Concha-Bermejillo, Welsh, Varner and Edwards2013). Moreover, parasitic infestation can be associated with up-regulation of ISG expression such as CXCL10 (Andronicos et al., Reference Andronicos, Hunt and Windon2010). In experiment 1, no infection nor parasite infestation was detected in the ewes born and bred in the research station. This high and controlled health status might explain why ISG expression unambiguously discriminates pregnant from non-pregnant females.
Moreover, in dairy cow populations, additional subclinical diseases have to be considered. Endometritis induces an innate immune response which results in a higher expression of immune genes, including ISG (Johnson et al., Reference Johnson, Torres, Carvallo, Duchens and Peralta2015). This was also observed in subclinical endometritis (Düvel et al., Reference Düvel, Maaß, Heppelmann, Hussen, Koy, Piechotta, Sandra, Smith, Sheldon, Dieuzy-Labaye, Zieger and Schuberth2014), a very common disease in postpartum dairy cows (Bromfield et al., Reference Bromfield, Santos, Block, Williams and Sheldon2015). In dairy herds, mastitis is another recurrent source of infection. Bacterial infection of the mammary gland is locally characterized by neutrophilic inflammation, resulting in production of a large amount of interleukins and cytokines, including ISG (Rainard et al., Reference Rainard, Cunha, Bougarn, Fromageau, Rossignol, Gilbert and Berthon2013). Besides this local reaction, inflammatory response to mastitis involves systemic consequences such as leucocyte activation (Jiang et al., Reference Jiang, Sorensen, Rontved, Vels and Ingvartsen2008) and enhanced expression of antimicrobial and cytokine genes (Mitterhuemer et al., Reference Mitterhuemer, Petzl, Krebs, Mehne, Klanner, Wolf, Zerbe and Blum2010). In commercial herds, prevalence of these subclinical diseases might restrict the relevance of ISG as biomarkers of early pregnancy to nulliparous ewes or heifers, which have not been affected by endometritis or mastitis.
In conclusion, our study highlights the limits of using an ISG-based test for early pregnancy diagnosis (day 14 to 15) in the ewe. The test, although very promising in a controlled healthy group of animals with Percoll-sorted immune cells, was not effective in farm-reared multiparous ewes with PAXgene®-collected blood, even when the combination of five selected ISG was applied. The differences observed between our two experiments might be related to differences in blood sample procedures but were more probably due to the health status of the animals. If several reports have concluded about potential applications of ISG expression levels for early pregnancy detection, our study displays highly variable ISG expression patterns in commercial herds and therefore indicates that transposition of experimental procedures for blood cell collection (Percoll) to in-field appropriate conditions (PAXgene®) fails to provide sufficient sensitivity and specificity for early pregnancy diagnosis.
Acknowledgements
This study was support by the General Direction of Education and Research (French Ministry of Agriculture, DGER), the French National Institute for Agronomic Research (INRA – Phase department) and the French National Agency for Research (ANR-08-GENM-037). The authors address their special thanks to Céline Urien and Isabelle Schwartz-Cornil (INRA, UR 0892 Virologie et Immunologie Moléculaires, Domaine de Vilvert, F-78352 Jouy-en-Josas Cedex, France), to the UCEA team and to the animal carers at the Alfort National Veterinary School (ENVA). They also acknowledge Gaëlle Masse-Morel (ENVA) for help in animal management and sampling.